Cities with the Highest Percentage of Hawaiian / Pacific Population in New York
RELATED REPORTS & OPTIONS
Hawaiian / Pacific
New York
Compare Cities
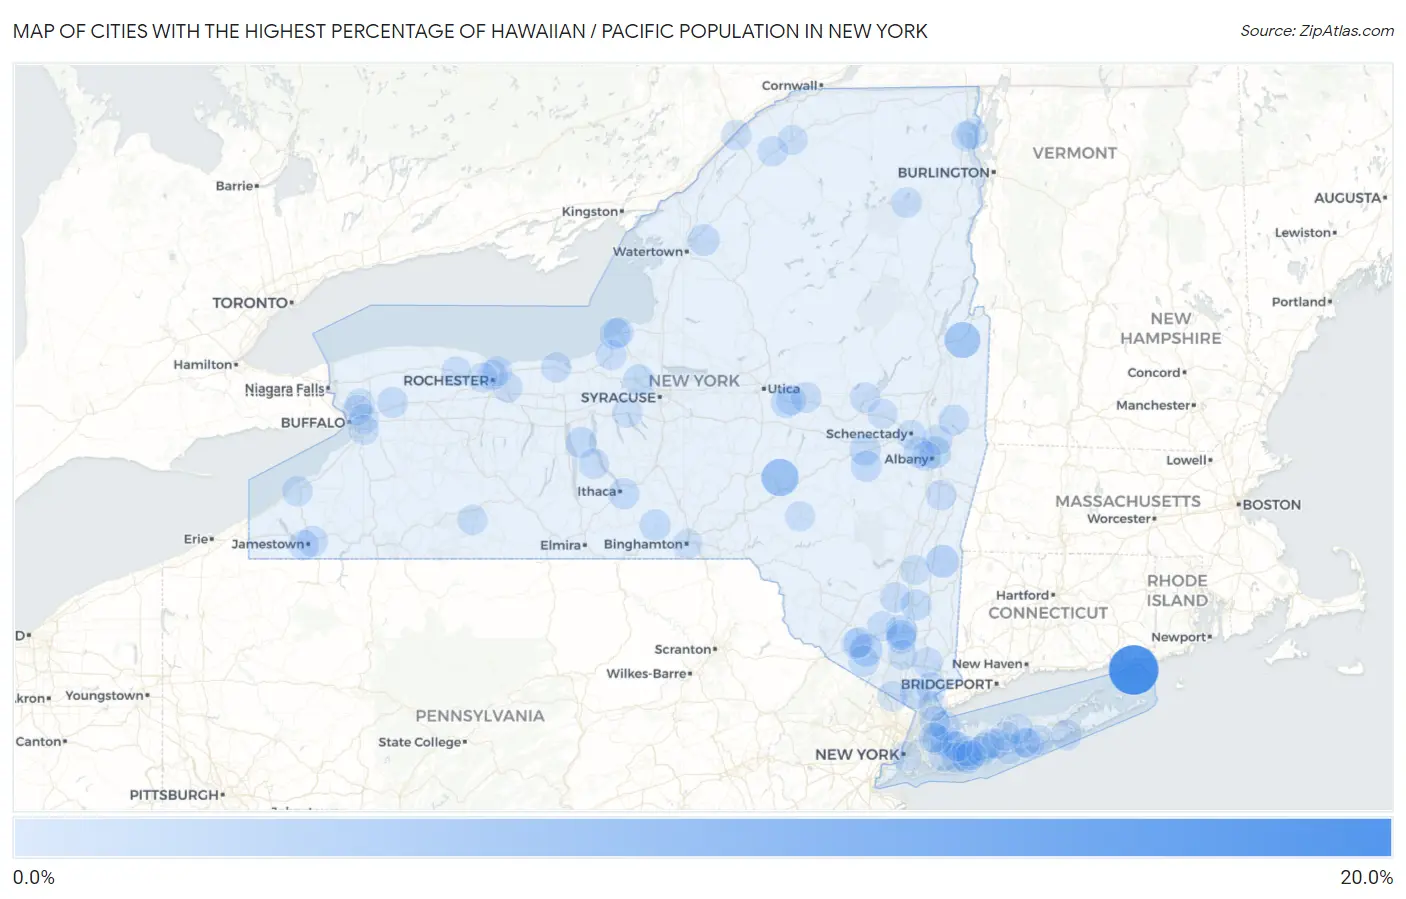
Map of Cities with the Highest Percentage of Hawaiian / Pacific Population in New York
0.0%
20.0%
Cities with the Highest Percentage of Hawaiian / Pacific Population in New York
| City | Hawaiian / Pacific | vs State | vs National | |
| 1. | Fishers Island | 15.1% | 0.046%(+15.0)#1 | 0.19%(+14.9)#57 |
| 2. | Laurens | 5.4% | 0.046%(+5.33)#2 | 0.19%(+5.19)#177 |
| 3. | Fort Ann | 4.3% | 0.046%(+4.26)#3 | 0.19%(+4.12)#218 |
| 4. | Pine Plains | 2.0% | 0.046%(+1.97)#4 | 0.19%(+1.82)#426 |
| 5. | Goshen | 1.7% | 0.046%(+1.68)#5 | 0.19%(+1.54)#499 |
| 6. | Bard College | 1.6% | 0.046%(+1.55)#6 | 0.19%(+1.41)#534 |
| 7. | Marist College | 1.6% | 0.046%(+1.51)#7 | 0.19%(+1.37)#543 |
| 8. | Balmville | 1.4% | 0.046%(+1.36)#8 | 0.19%(+1.21)#582 |
| 9. | Menands | 1.4% | 0.046%(+1.33)#9 | 0.19%(+1.19)#593 |
| 10. | Fort Drum | 1.1% | 0.046%(+1.08)#10 | 0.19%(+0.934)#688 |
| 11. | Central Bridge | 1.1% | 0.046%(+1.02)#11 | 0.19%(+0.881)#706 |
| 12. | Newark Valley | 0.83% | 0.046%(+0.788)#12 | 0.19%(+0.645)#855 |
| 13. | Middleburgh | 0.83% | 0.046%(+0.780)#13 | 0.19%(+0.637)#866 |
| 14. | Arlington | 0.79% | 0.046%(+0.744)#14 | 0.19%(+0.601)#899 |
| 15. | Romulus | 0.78% | 0.046%(+0.738)#15 | 0.19%(+0.595)#909 |
| 16. | Baldwinsville | 0.76% | 0.046%(+0.716)#16 | 0.19%(+0.573)#929 |
| 17. | Suny Oswego | 0.72% | 0.046%(+0.673)#17 | 0.19%(+0.530)#973 |
| 18. | East Ithaca | 0.70% | 0.046%(+0.657)#18 | 0.19%(+0.514)#996 |
| 19. | Ilion | 0.69% | 0.046%(+0.642)#19 | 0.19%(+0.499)#1,017 |
| 20. | Cumberland Head | 0.66% | 0.046%(+0.618)#20 | 0.19%(+0.475)#1,047 |
| 21. | Akron | 0.65% | 0.046%(+0.607)#21 | 0.19%(+0.464)#1,059 |
| 22. | Falconer | 0.59% | 0.046%(+0.547)#22 | 0.19%(+0.404)#1,129 |
| 23. | South Lansing | 0.55% | 0.046%(+0.504)#23 | 0.19%(+0.361)#1,172 |
| 24. | Westmere | 0.54% | 0.046%(+0.493)#24 | 0.19%(+0.350)#1,193 |
| 25. | New Cassel | 0.50% | 0.046%(+0.457)#25 | 0.19%(+0.314)#1,246 |
| 26. | East Hills | 0.50% | 0.046%(+0.451)#26 | 0.19%(+0.308)#1,256 |
| 27. | Florida | 0.48% | 0.046%(+0.431)#27 | 0.19%(+0.288)#1,294 |
| 28. | Valley Falls | 0.43% | 0.046%(+0.388)#28 | 0.19%(+0.245)#1,372 |
| 29. | Interlaken | 0.40% | 0.046%(+0.352)#29 | 0.19%(+0.209)#1,447 |
| 30. | Jamestown West | 0.39% | 0.046%(+0.341)#30 | 0.19%(+0.198)#1,478 |
| 31. | East Quogue | 0.36% | 0.046%(+0.310)#31 | 0.19%(+0.167)#1,564 |
| 32. | Sayville | 0.35% | 0.046%(+0.307)#32 | 0.19%(+0.164)#1,569 |
| 33. | Lake Placid | 0.35% | 0.046%(+0.305)#33 | 0.19%(+0.162)#1,579 |
| 34. | Siena College | 0.35% | 0.046%(+0.303)#34 | 0.19%(+0.160)#1,585 |
| 35. | Jefferson Valley Yorktown | 0.35% | 0.046%(+0.303)#35 | 0.19%(+0.159)#1,589 |
| 36. | West Hempstead | 0.35% | 0.046%(+0.303)#36 | 0.19%(+0.159)#1,591 |
| 37. | North Massapequa | 0.34% | 0.046%(+0.295)#37 | 0.19%(+0.152)#1,611 |
| 38. | Upper Nyack | 0.33% | 0.046%(+0.281)#38 | 0.19%(+0.138)#1,645 |
| 39. | Plandome Heights | 0.32% | 0.046%(+0.274)#39 | 0.19%(+0.131)#1,661 |
| 40. | Ogdensburg | 0.31% | 0.046%(+0.267)#40 | 0.19%(+0.124)#1,680 |
| 41. | Airmont | 0.31% | 0.046%(+0.264)#41 | 0.19%(+0.121)#1,694 |
| 42. | Valatie | 0.30% | 0.046%(+0.254)#42 | 0.19%(+0.111)#1,730 |
| 43. | Brookhaven | 0.29% | 0.046%(+0.248)#43 | 0.19%(+0.105)#1,749 |
| 44. | Little Falls | 0.28% | 0.046%(+0.237)#44 | 0.19%(+0.094)#1,792 |
| 45. | Hannibal | 0.28% | 0.046%(+0.237)#45 | 0.19%(+0.094)#1,793 |
| 46. | Walden | 0.28% | 0.046%(+0.231)#46 | 0.19%(+0.088)#1,824 |
| 47. | Gloversville | 0.24% | 0.046%(+0.199)#47 | 0.19%(+0.056)#1,947 |
| 48. | Roessleville | 0.24% | 0.046%(+0.196)#48 | 0.19%(+0.053)#1,957 |
| 49. | New Windsor | 0.24% | 0.046%(+0.193)#49 | 0.19%(+0.050)#1,973 |
| 50. | Glen Cove | 0.23% | 0.046%(+0.189)#50 | 0.19%(+0.046)#1,990 |
| 51. | Herkimer | 0.23% | 0.046%(+0.188)#51 | 0.19%(+0.045)#1,994 |
| 52. | East Rochester | 0.22% | 0.046%(+0.176)#52 | 0.19%(+0.033)#2,030 |
| 53. | Middletown | 0.20% | 0.046%(+0.153)#53 | 0.19%(+0.010)#2,136 |
| 54. | Canton | 0.19% | 0.046%(+0.148)#54 | 0.19%(+0.005)#2,161 |
| 55. | Fredonia | 0.19% | 0.046%(+0.140)#55 | 0.19%(-0.003)#2,199 |
| 56. | New Paltz | 0.18% | 0.046%(+0.135)#56 | 0.19%(-0.008)#2,223 |
| 57. | Alfred | 0.17% | 0.046%(+0.129)#57 | 0.19%(-0.014)#2,255 |
| 58. | Cohoes | 0.17% | 0.046%(+0.121)#58 | 0.19%(-0.022)#2,297 |
| 59. | Vassar College | 0.17% | 0.046%(+0.120)#59 | 0.19%(-0.023)#2,303 |
| 60. | Rochester | 0.17% | 0.046%(+0.120)#60 | 0.19%(-0.023)#2,308 |
| 61. | North Bellmore | 0.16% | 0.046%(+0.116)#61 | 0.19%(-0.027)#2,338 |
| 62. | Sodus | 0.16% | 0.046%(+0.111)#62 | 0.19%(-0.032)#2,364 |
| 63. | East Massapequa | 0.14% | 0.046%(+0.098)#63 | 0.19%(-0.045)#2,441 |
| 64. | Farmingdale | 0.13% | 0.046%(+0.085)#64 | 0.19%(-0.058)#2,520 |
| 65. | Mechanicstown | 0.13% | 0.046%(+0.082)#65 | 0.19%(-0.061)#2,542 |
| 66. | Brentwood | 0.13% | 0.046%(+0.082)#66 | 0.19%(-0.061)#2,543 |
| 67. | Delhi | 0.13% | 0.046%(+0.081)#67 | 0.19%(-0.062)#2,548 |
| 68. | Baywood | 0.13% | 0.046%(+0.080)#68 | 0.19%(-0.063)#2,555 |
| 69. | Schenectady | 0.12% | 0.046%(+0.079)#69 | 0.19%(-0.065)#2,563 |
| 70. | Mamaroneck | 0.12% | 0.046%(+0.075)#70 | 0.19%(-0.068)#2,590 |
| 71. | Oswego | 0.11% | 0.046%(+0.066)#71 | 0.19%(-0.078)#2,661 |
| 72. | Plattsburgh | 0.11% | 0.046%(+0.065)#72 | 0.19%(-0.078)#2,667 |
| 73. | West Point | 0.11% | 0.046%(+0.064)#73 | 0.19%(-0.079)#2,675 |
| 74. | Chappaqua | 0.11% | 0.046%(+0.061)#74 | 0.19%(-0.082)#2,687 |
| 75. | Irondequoit | 0.10% | 0.046%(+0.057)#75 | 0.19%(-0.086)#2,723 |
| 76. | North Gates | 0.099% | 0.046%(+0.053)#76 | 0.19%(-0.090)#2,745 |
| 77. | Kings Point | 0.089% | 0.046%(+0.044)#77 | 0.19%(-0.099)#2,821 |
| 78. | University At Buffalo | 0.081% | 0.046%(+0.035)#78 | 0.19%(-0.108)#2,892 |
| 79. | Eggertsville | 0.080% | 0.046%(+0.034)#79 | 0.19%(-0.109)#2,903 |
| 80. | Potsdam | 0.070% | 0.046%(+0.024)#80 | 0.19%(-0.119)#2,994 |
| 81. | Hicksville | 0.064% | 0.046%(+0.018)#81 | 0.19%(-0.125)#3,062 |
| 82. | New York | 0.063% | 0.046%(+0.017)#82 | 0.19%(-0.126)#3,066 |
| 83. | Coram | 0.062% | 0.046%(+0.016)#83 | 0.19%(-0.127)#3,080 |
| 84. | North Babylon | 0.060% | 0.046%(+0.014)#84 | 0.19%(-0.129)#3,102 |
| 85. | Central Islip | 0.058% | 0.046%(+0.012)#85 | 0.19%(-0.131)#3,131 |
| 86. | Brockport | 0.056% | 0.046%(+0.010)#86 | 0.19%(-0.133)#3,149 |
| 87. | Cheektowaga | 0.052% | 0.046%(+0.007)#87 | 0.19%(-0.136)#3,179 |
| 88. | White Plains | 0.050% | 0.046%(+0.005)#88 | 0.19%(-0.138)#3,198 |
| 89. | Binghamton | 0.050% | 0.046%(+0.005)#89 | 0.19%(-0.138)#3,199 |
| 90. | Lake Ronkonkoma | 0.049% | 0.046%(+0.003)#90 | 0.19%(-0.140)#3,217 |
| 91. | Skaneateles | 0.039% | 0.046%(-0.006)#91 | 0.19%(-0.149)#3,327 |
| 92. | Newburgh | 0.038% | 0.046%(-0.007)#92 | 0.19%(-0.150)#3,335 |
| 93. | Moriches | 0.038% | 0.046%(-0.008)#93 | 0.19%(-0.151)#3,341 |
| 94. | North Bellport | 0.038% | 0.046%(-0.008)#94 | 0.19%(-0.151)#3,343 |
| 95. | Rhinebeck | 0.037% | 0.046%(-0.008)#95 | 0.19%(-0.152)#3,355 |
| 96. | West Seneca | 0.035% | 0.046%(-0.010)#96 | 0.19%(-0.153)#3,376 |
| 97. | North Amityville | 0.034% | 0.046%(-0.011)#97 | 0.19%(-0.154)#3,386 |
| 98. | Rochester Institute Of Technology | 0.034% | 0.046%(-0.012)#98 | 0.19%(-0.155)#3,392 |
| 99. | Amsterdam | 0.033% | 0.046%(-0.013)#99 | 0.19%(-0.156)#3,404 |
| 100. | Albany | 0.030% | 0.046%(-0.016)#100 | 0.19%(-0.159)#3,443 |
Common Questions
What are the Top 10 Cities with the Highest Percentage of Hawaiian / Pacific Population in New York?
Top 10 Cities with the Highest Percentage of Hawaiian / Pacific Population in New York are:
#1
15.1%
#2
5.4%
#3
4.3%
#4
2.0%
#5
1.7%
#6
1.4%
#7
1.4%
#8
1.1%
#9
1.1%
#10
0.83%
What city has the Highest Percentage of Hawaiian / Pacific Population in New York?
Fishers Island has the Highest Percentage of Hawaiian / Pacific Population in New York with 15.1%.
What is the Percentage of Hawaiian / Pacific Population in the State of New York?
Percentage of Hawaiian / Pacific Population in New York is 0.046%.
What is the Percentage of Hawaiian / Pacific Population in the United States?
Percentage of Hawaiian / Pacific Population in the United States is 0.19%.