Cities with the Highest Percentage of Hawaiian / Pacific Population in Georgia
RELATED REPORTS & OPTIONS
Hawaiian / Pacific
Georgia
Compare Cities
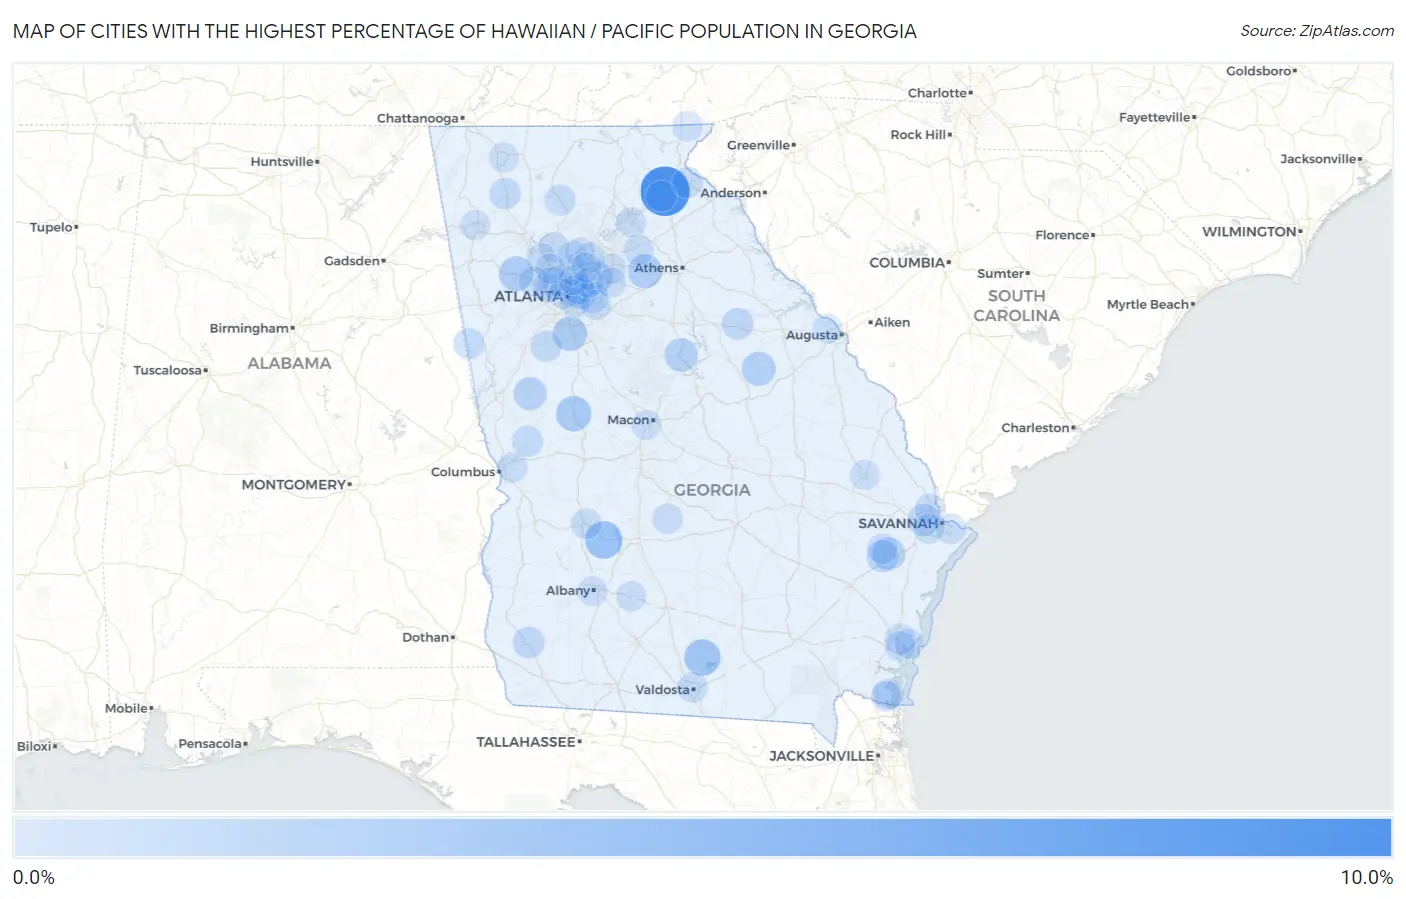
Map of Cities with the Highest Percentage of Hawaiian / Pacific Population in Georgia
0.0%
10.0%
Cities with the Highest Percentage of Hawaiian / Pacific Population in Georgia
| City | Hawaiian / Pacific | vs State | vs National | |
| 1. | Cornelia | 8.3% | 0.069%(+8.24)#1 | 0.19%(+8.12)#117 |
| 2. | De Soto | 3.0% | 0.069%(+2.92)#2 | 0.19%(+2.80)#309 |
| 3. | Ray City | 2.6% | 0.069%(+2.52)#3 | 0.19%(+2.40)#346 |
| 4. | Thomaston | 2.1% | 0.069%(+2.07)#4 | 0.19%(+1.95)#404 |
| 5. | Dallas | 1.9% | 0.069%(+1.81)#5 | 0.19%(+1.69)#461 |
| 6. | Irondale | 1.8% | 0.069%(+1.69)#6 | 0.19%(+1.57)#490 |
| 7. | Bethlehem | 1.7% | 0.069%(+1.60)#7 | 0.19%(+1.48)#512 |
| 8. | Mitchell | 1.6% | 0.069%(+1.51)#8 | 0.19%(+1.39)#540 |
| 9. | Eatonton | 1.4% | 0.069%(+1.28)#9 | 0.19%(+1.16)#603 |
| 10. | Greenville | 1.2% | 0.069%(+1.13)#10 | 0.19%(+1.01)#655 |
| 11. | Flemington | 1.2% | 0.069%(+1.10)#11 | 0.19%(+0.976)#666 |
| 12. | Lilburn | 1.1% | 0.069%(+1.08)#12 | 0.19%(+0.958)#673 |
| 13. | Hinesville | 0.83% | 0.069%(+0.757)#13 | 0.19%(+0.638)#864 |
| 14. | Cusseta Chattahoochee County Unified Government | 0.78% | 0.069%(+0.707)#14 | 0.19%(+0.588)#919 |
| 15. | Pooler | 0.77% | 0.069%(+0.704)#15 | 0.19%(+0.584)#923 |
| 16. | Colquitt | 0.70% | 0.069%(+0.635)#16 | 0.19%(+0.515)#992 |
| 17. | Crawfordville | 0.68% | 0.069%(+0.610)#17 | 0.19%(+0.490)#1,029 |
| 18. | Redan | 0.62% | 0.069%(+0.550)#18 | 0.19%(+0.431)#1,091 |
| 19. | Calhoun | 0.61% | 0.069%(+0.542)#19 | 0.19%(+0.422)#1,102 |
| 20. | Jasper | 0.48% | 0.069%(+0.410)#20 | 0.19%(+0.290)#1,289 |
| 21. | Baldwin | 0.45% | 0.069%(+0.376)#21 | 0.19%(+0.257)#1,352 |
| 22. | Waverly Hall | 0.43% | 0.069%(+0.359)#22 | 0.19%(+0.240)#1,379 |
| 23. | Peachtree City | 0.42% | 0.069%(+0.355)#23 | 0.19%(+0.236)#1,384 |
| 24. | Toccoa | 0.42% | 0.069%(+0.351)#24 | 0.19%(+0.231)#1,391 |
| 25. | Avondale Estates | 0.37% | 0.069%(+0.302)#25 | 0.19%(+0.182)#1,520 |
| 26. | Ephesus | 0.36% | 0.069%(+0.293)#26 | 0.19%(+0.173)#1,548 |
| 27. | Smyrna | 0.30% | 0.069%(+0.226)#27 | 0.19%(+0.107)#1,745 |
| 28. | Druid Hills | 0.26% | 0.069%(+0.191)#28 | 0.19%(+0.071)#1,888 |
| 29. | Kings Bay Base | 0.24% | 0.069%(+0.176)#29 | 0.19%(+0.056)#1,946 |
| 30. | Valdosta | 0.22% | 0.069%(+0.148)#30 | 0.19%(+0.028)#2,057 |
| 31. | Americus | 0.21% | 0.069%(+0.143)#31 | 0.19%(+0.024)#2,078 |
| 32. | Port Wentworth | 0.18% | 0.069%(+0.111)#32 | 0.19%(-0.009)#2,228 |
| 33. | St Marys | 0.17% | 0.069%(+0.104)#33 | 0.19%(-0.016)#2,262 |
| 34. | Sky Valley | 0.17% | 0.069%(+0.098)#34 | 0.19%(-0.022)#2,298 |
| 35. | Pineview | 0.16% | 0.069%(+0.095)#35 | 0.19%(-0.025)#2,321 |
| 36. | North Decatur | 0.16% | 0.069%(+0.094)#36 | 0.19%(-0.026)#2,328 |
| 37. | Kennesaw | 0.16% | 0.069%(+0.093)#37 | 0.19%(-0.027)#2,335 |
| 38. | Bemiss | 0.15% | 0.069%(+0.086)#38 | 0.19%(-0.034)#2,376 |
| 39. | Country Club Estates | 0.15% | 0.069%(+0.085)#39 | 0.19%(-0.034)#2,379 |
| 40. | Columbus | 0.15% | 0.069%(+0.085)#40 | 0.19%(-0.035)#2,387 |
| 41. | Brunswick | 0.14% | 0.069%(+0.075)#41 | 0.19%(-0.044)#2,435 |
| 42. | Hoschton | 0.13% | 0.069%(+0.060)#42 | 0.19%(-0.060)#2,531 |
| 43. | Fort Stewart | 0.13% | 0.069%(+0.060)#43 | 0.19%(-0.060)#2,534 |
| 44. | Sylvester | 0.12% | 0.069%(+0.055)#44 | 0.19%(-0.064)#2,560 |
| 45. | Whitemarsh Island | 0.12% | 0.069%(+0.049)#45 | 0.19%(-0.071)#2,613 |
| 46. | Mableton | 0.12% | 0.069%(+0.046)#46 | 0.19%(-0.073)#2,634 |
| 47. | Kennesaw State University | 0.11% | 0.069%(+0.044)#47 | 0.19%(-0.075)#2,640 |
| 48. | Vinings | 0.11% | 0.069%(+0.039)#48 | 0.19%(-0.081)#2,683 |
| 49. | Woodstock | 0.088% | 0.069%(+0.019)#49 | 0.19%(-0.101)#2,832 |
| 50. | Savannah | 0.075% | 0.069%(+0.005)#50 | 0.19%(-0.114)#2,946 |
| 51. | Augusta-Richmond County Consolidated Government (Balance) | 0.073% | 0.069%(+0.004)#51 | 0.19%(-0.115)#2,957 |
| 52. | Dalton | 0.073% | 0.069%(+0.004)#52 | 0.19%(-0.116)#2,962 |
| 53. | Stonecrest | 0.062% | 0.069%(-0.007)#53 | 0.19%(-0.126)#3,073 |
| 54. | Albany | 0.049% | 0.069%(-0.020)#54 | 0.19%(-0.139)#3,213 |
| 55. | Powder Springs | 0.047% | 0.069%(-0.022)#55 | 0.19%(-0.141)#3,236 |
| 56. | Atlanta | 0.045% | 0.069%(-0.024)#56 | 0.19%(-0.144)#3,268 |
| 57. | Lawrenceville | 0.043% | 0.069%(-0.026)#57 | 0.19%(-0.146)#3,293 |
| 58. | Rome | 0.043% | 0.069%(-0.027)#58 | 0.19%(-0.146)#3,296 |
| 59. | Sandy Springs | 0.038% | 0.069%(-0.031)#59 | 0.19%(-0.150)#3,336 |
| 60. | Tucker | 0.038% | 0.069%(-0.031)#60 | 0.19%(-0.151)#3,346 |
| 61. | St Simons | 0.038% | 0.069%(-0.032)#61 | 0.19%(-0.151)#3,350 |
| 62. | Gainesville | 0.033% | 0.069%(-0.036)#62 | 0.19%(-0.156)#3,407 |
| 63. | Athens-Clarke County Unified Government (Balance) | 0.028% | 0.069%(-0.041)#63 | 0.19%(-0.160)#3,465 |
| 64. | Macon Bibb County | 0.025% | 0.069%(-0.044)#64 | 0.19%(-0.164)#3,520 |
| 65. | Statesboro | 0.024% | 0.069%(-0.045)#65 | 0.19%(-0.165)#3,534 |
| 66. | Roswell | 0.022% | 0.069%(-0.048)#66 | 0.19%(-0.167)#3,564 |
| 67. | Martinez | 0.015% | 0.069%(-0.054)#67 | 0.19%(-0.174)#3,659 |
| 68. | Gresham Park | 0.013% | 0.069%(-0.056)#68 | 0.19%(-0.176)#3,681 |
| 69. | Alpharetta | 0.011% | 0.069%(-0.058)#69 | 0.19%(-0.178)#3,710 |
| 70. | Brookhaven | 0.011% | 0.069%(-0.059)#70 | 0.19%(-0.178)#3,712 |
| 71. | Johns Creek | 0.0097% | 0.069%(-0.059)#71 | 0.19%(-0.179)#3,720 |
| 72. | Marietta | 0.0081% | 0.069%(-0.061)#72 | 0.19%(-0.181)#3,738 |
| 73. | Snellville | 0.0048% | 0.069%(-0.064)#73 | 0.19%(-0.184)#3,771 |
| 74. | Peachtree Corners | 0.0047% | 0.069%(-0.064)#74 | 0.19%(-0.184)#3,773 |
Common Questions
What are the Top 10 Cities with the Highest Percentage of Hawaiian / Pacific Population in Georgia?
Top 10 Cities with the Highest Percentage of Hawaiian / Pacific Population in Georgia are:
What city has the Highest Percentage of Hawaiian / Pacific Population in Georgia?
Cornelia has the Highest Percentage of Hawaiian / Pacific Population in Georgia with 8.3%.
What is the Percentage of Hawaiian / Pacific Population in the State of Georgia?
Percentage of Hawaiian / Pacific Population in Georgia is 0.069%.
What is the Percentage of Hawaiian / Pacific Population in the United States?
Percentage of Hawaiian / Pacific Population in the United States is 0.19%.