Prunedale, CA Map & Demographics
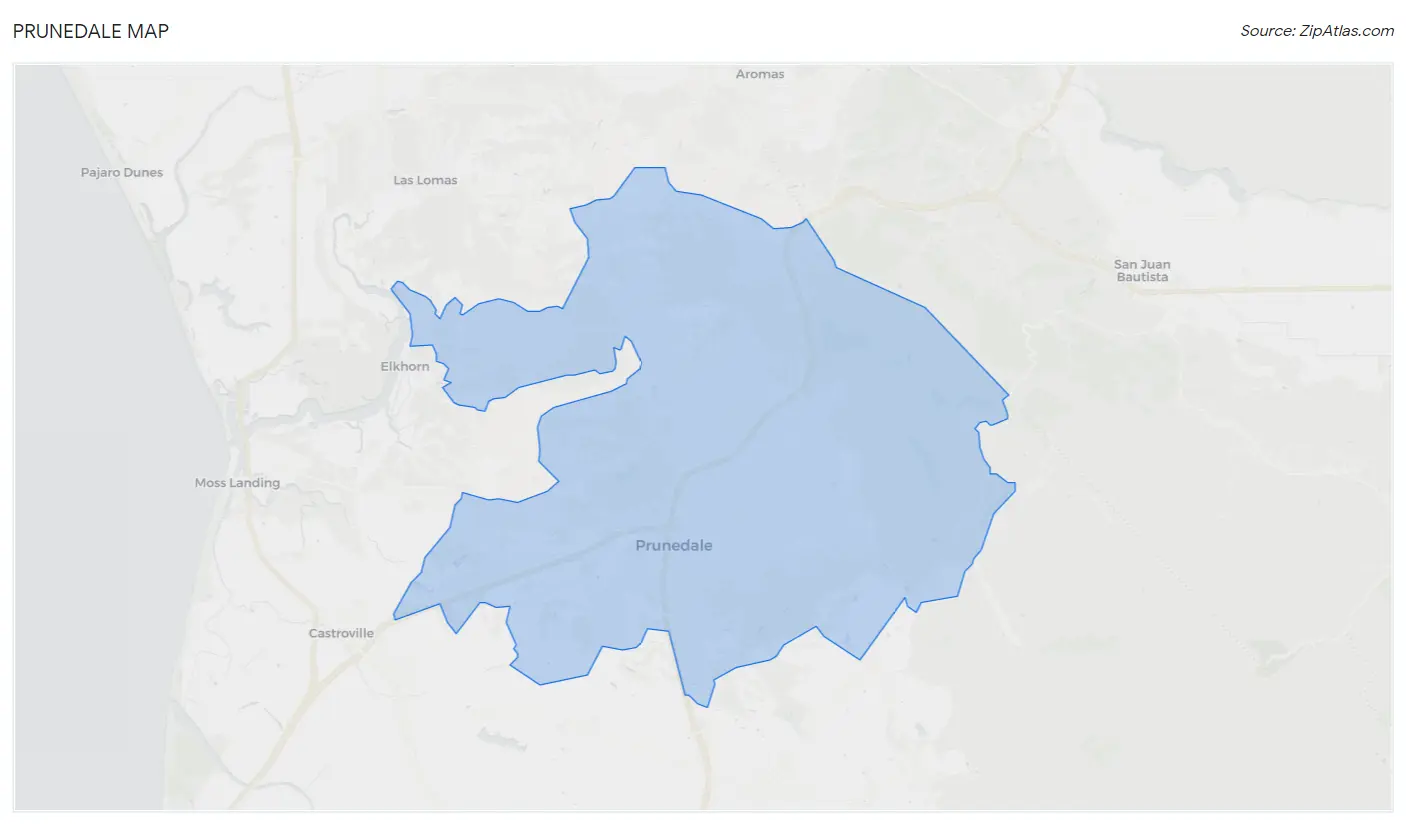
Prunedale Map
Prunedale Overview
$42,666
PER CAPITA INCOME
$115,665
AVG FAMILY INCOME
$106,150
AVG HOUSEHOLD INCOME
24.6%
WAGE / INCOME GAP [ % ]
75.4¢/ $1
WAGE / INCOME GAP [ $ ]
0.47
INEQUALITY / GINI INDEX
19,372
TOTAL POPULATION
9,303
MALE POPULATION
10,069
FEMALE POPULATION
92.39
MALES / 100 FEMALES
108.23
FEMALES / 100 MALES
39.1
MEDIAN AGE
3.7
AVG FAMILY SIZE
3.5
AVG HOUSEHOLD SIZE
8,318
LABOR FORCE [ PEOPLE ]
56.7%
PERCENT IN LABOR FORCE
6.6%
UNEMPLOYMENT RATE
Prunedale Area Codes
Income in Prunedale
Income Overview in Prunedale
Per Capita Income in Prunedale is $42,666, while median incomes of families and households are $115,665 and $106,150 respectively.
| Characteristic | Number | Measure |
| Per Capita Income | 19,372 | $42,666 |
| Median Family Income | 4,507 | $115,665 |
| Mean Family Income | 4,507 | $144,464 |
| Median Household Income | 5,593 | $106,150 |
| Mean Household Income | 5,593 | $147,356 |
| Income Deficit | 4,507 | $0 |
| Wage / Income Gap (%) | 19,372 | 24.65% |
| Wage / Income Gap ($) | 19,372 | 75.35¢ per $1 |
| Gini / Inequality Index | 19,372 | 0.47 |
Earnings by Sex in Prunedale
Average Earnings in Prunedale are $42,506, $48,044 for men and $36,202 for women, a difference of 24.6%.
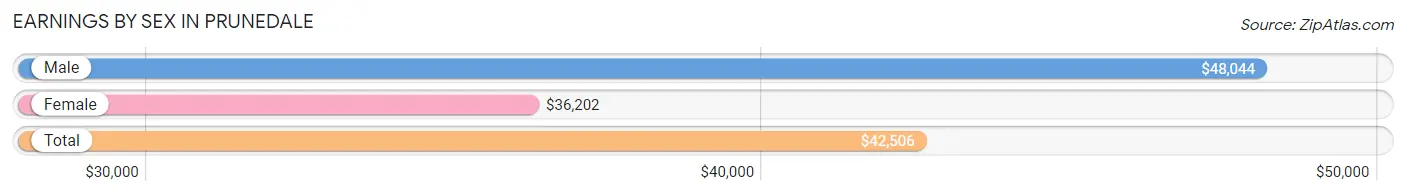
| Sex | Number | Average Earnings |
| Male | 4,842 (55.5%) | $48,044 |
| Female | 3,879 (44.5%) | $36,202 |
| Total | 8,721 (100.0%) | $42,506 |
Earnings by Sex by Income Bracket in Prunedale
The most common earnings brackets in Prunedale are $100,000+ for men (1,053 | 21.7%) and $100,000+ for women (647 | 16.7%).
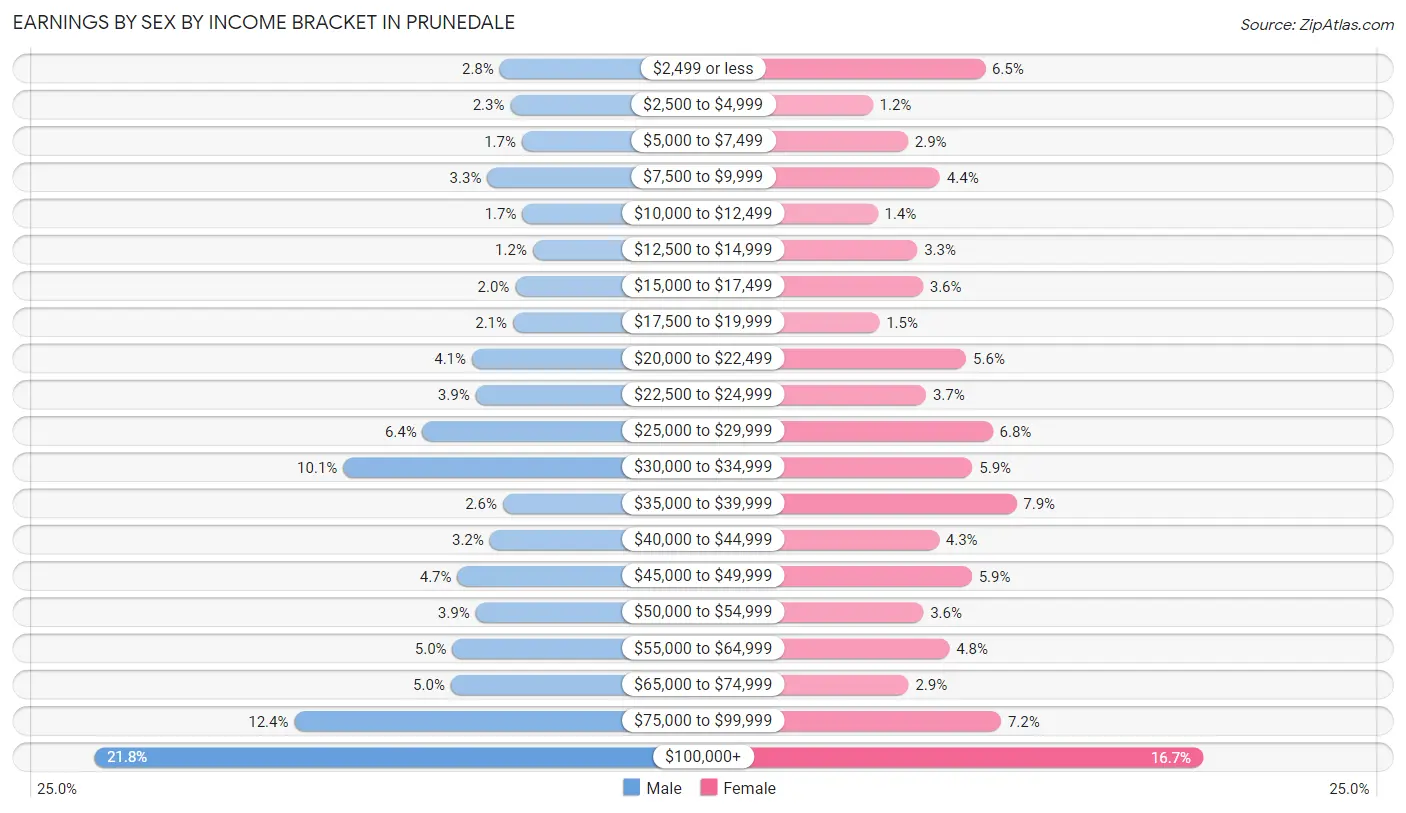
| Income | Male | Female |
| $2,499 or less | 133 (2.8%) | 251 (6.5%) |
| $2,500 to $4,999 | 109 (2.2%) | 47 (1.2%) |
| $5,000 to $7,499 | 83 (1.7%) | 111 (2.9%) |
| $7,500 to $9,999 | 161 (3.3%) | 169 (4.4%) |
| $10,000 to $12,499 | 82 (1.7%) | 56 (1.4%) |
| $12,500 to $14,999 | 58 (1.2%) | 128 (3.3%) |
| $15,000 to $17,499 | 98 (2.0%) | 138 (3.6%) |
| $17,500 to $19,999 | 103 (2.1%) | 59 (1.5%) |
| $20,000 to $22,499 | 196 (4.1%) | 217 (5.6%) |
| $22,500 to $24,999 | 188 (3.9%) | 144 (3.7%) |
| $25,000 to $29,999 | 308 (6.4%) | 265 (6.8%) |
| $30,000 to $34,999 | 488 (10.1%) | 228 (5.9%) |
| $35,000 to $39,999 | 126 (2.6%) | 308 (7.9%) |
| $40,000 to $44,999 | 156 (3.2%) | 167 (4.3%) |
| $45,000 to $49,999 | 229 (4.7%) | 227 (5.9%) |
| $50,000 to $54,999 | 188 (3.9%) | 139 (3.6%) |
| $55,000 to $64,999 | 240 (5.0%) | 186 (4.8%) |
| $65,000 to $74,999 | 244 (5.0%) | 112 (2.9%) |
| $75,000 to $99,999 | 599 (12.4%) | 280 (7.2%) |
| $100,000+ | 1,053 (21.7%) | 647 (16.7%) |
| Total | 4,842 (100.0%) | 3,879 (100.0%) |
Earnings by Sex by Educational Attainment in Prunedale
Average earnings in Prunedale are $54,234 for men and $45,109 for women, a difference of 16.8%. Men with an educational attainment of graduate degree enjoy the highest average annual earnings of $131,607, while those with less than high school education earn the least with $37,785. Women with an educational attainment of graduate degree earn the most with the average annual earnings of $94,299, while those with less than high school education have the smallest earnings of $26,031.
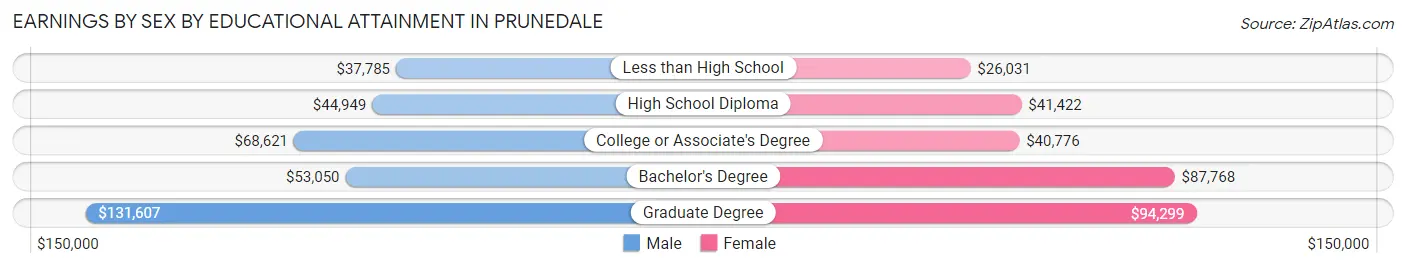
| Educational Attainment | Male Income | Female Income |
| Less than High School | $37,785 | $26,031 |
| High School Diploma | $44,949 | $41,422 |
| College or Associate's Degree | $68,621 | $40,776 |
| Bachelor's Degree | $53,050 | $87,768 |
| Graduate Degree | $131,607 | $94,299 |
| Total | $54,234 | $45,109 |
Family Income in Prunedale
Family Income Brackets in Prunedale
According to the Prunedale family income data, there are 1,230 families falling into the $100,000 to $149,999 income range, which is the most common income bracket and makes up 27.3% of all families. Conversely, the less than $10,000 income bracket is the least frequent group with only 32 families (0.7%) belonging to this category.
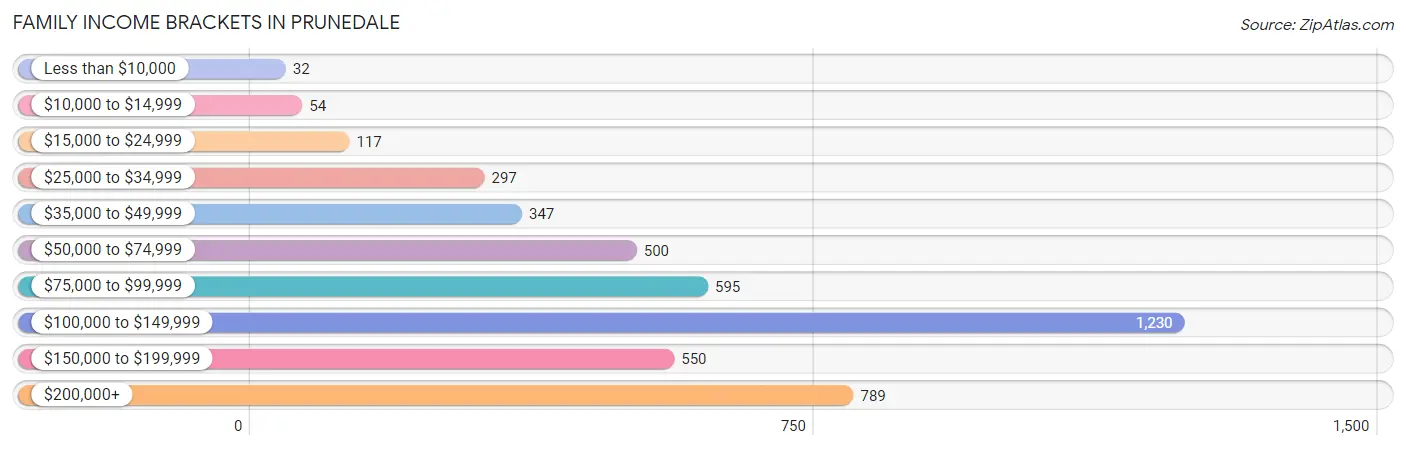
| Income Bracket | # Families | % Families |
| Less than $10,000 | 32 | 0.7% |
| $10,000 to $14,999 | 54 | 1.2% |
| $15,000 to $24,999 | 117 | 2.6% |
| $25,000 to $34,999 | 297 | 6.6% |
| $35,000 to $49,999 | 347 | 7.7% |
| $50,000 to $74,999 | 500 | 11.1% |
| $75,000 to $99,999 | 595 | 13.2% |
| $100,000 to $149,999 | 1,230 | 27.3% |
| $150,000 to $199,999 | 550 | 12.2% |
| $200,000+ | 789 | 17.5% |
Family Income by Famaliy Size in Prunedale
5-person families (315 | 7.0%) account for the highest median family income in Prunedale with $142,548 per family, while 2-person families (1,845 | 40.9%) have the highest median income of $51,562 per family member.
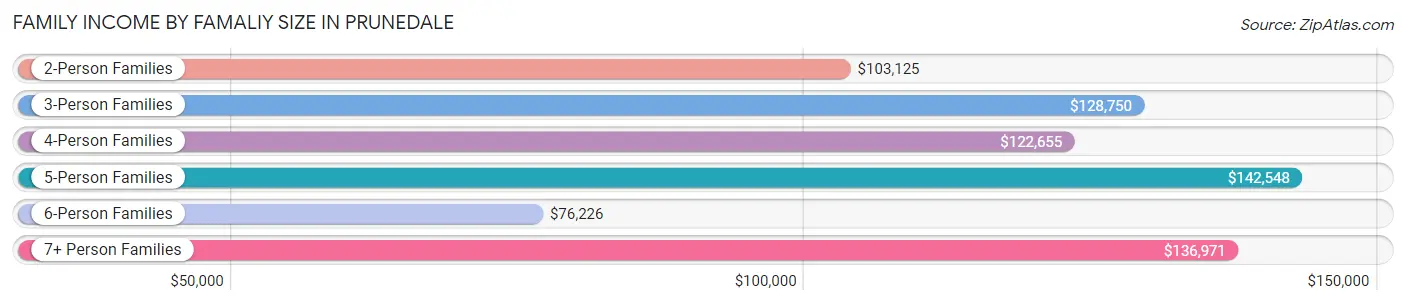
| Income Bracket | # Families | Median Income |
| 2-Person Families | 1,845 (40.9%) | $103,125 |
| 3-Person Families | 824 (18.3%) | $128,750 |
| 4-Person Families | 975 (21.6%) | $122,655 |
| 5-Person Families | 315 (7.0%) | $142,548 |
| 6-Person Families | 292 (6.5%) | $76,226 |
| 7+ Person Families | 256 (5.7%) | $136,971 |
| Total | 4,507 (100.0%) | $115,665 |
Family Income by Number of Earners in Prunedale
The median family income in Prunedale is $115,665, with families comprising 3+ earners (720) having the highest median family income of $148,043, while families with no earners (791) have the lowest median family income of $74,375, accounting for 16.0% and 17.5% of families, respectively.
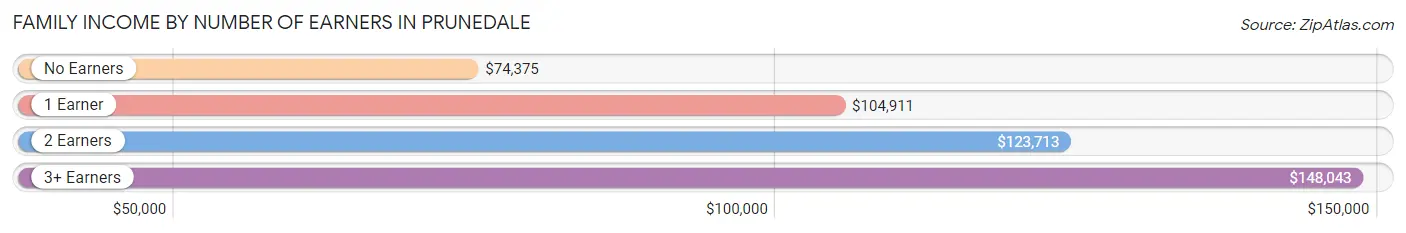
| Number of Earners | # Families | Median Income |
| No Earners | 791 (17.5%) | $74,375 |
| 1 Earner | 1,584 (35.1%) | $104,911 |
| 2 Earners | 1,412 (31.3%) | $123,713 |
| 3+ Earners | 720 (16.0%) | $148,043 |
| Total | 4,507 (100.0%) | $115,665 |
Household Income in Prunedale
Household Income Brackets in Prunedale
With 1,275 households falling in the category, the $100,000 to $149,999 income range is the most frequent in Prunedale, accounting for 22.8% of all households. In contrast, only 106 households (1.9%) fall into the $10,000 to $14,999 income bracket, making it the least populous group.
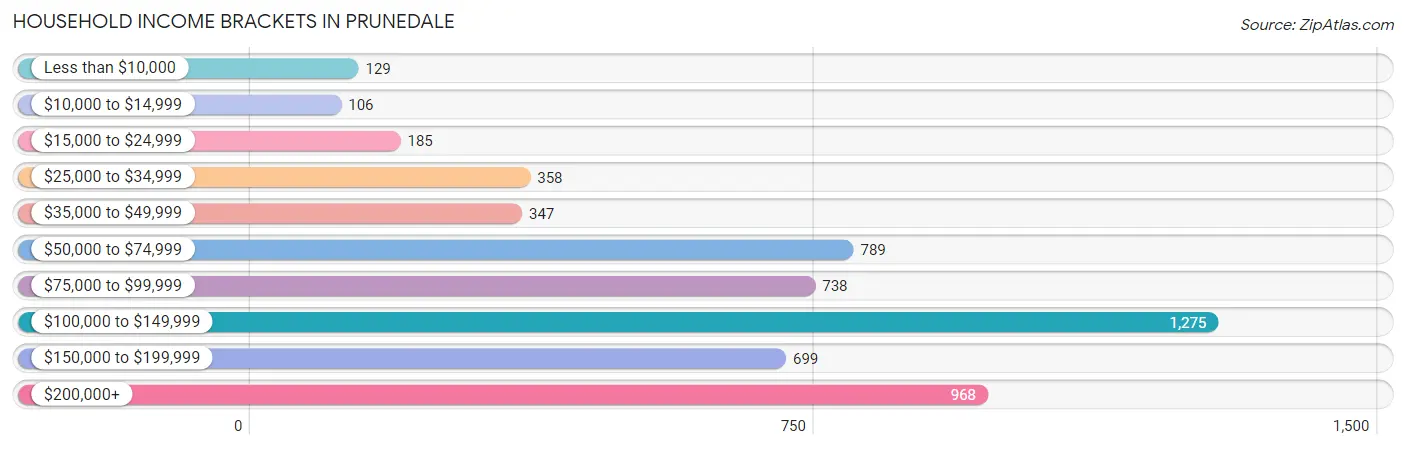
| Income Bracket | # Households | % Households |
| Less than $10,000 | 129 | 2.3% |
| $10,000 to $14,999 | 106 | 1.9% |
| $15,000 to $24,999 | 185 | 3.3% |
| $25,000 to $34,999 | 358 | 6.4% |
| $35,000 to $49,999 | 347 | 6.2% |
| $50,000 to $74,999 | 789 | 14.1% |
| $75,000 to $99,999 | 738 | 13.2% |
| $100,000 to $149,999 | 1,275 | 22.8% |
| $150,000 to $199,999 | 699 | 12.5% |
| $200,000+ | 968 | 17.3% |
Household Income by Householder Age in Prunedale
The median household income in Prunedale is $106,150, with the highest median household income of $118,990 found in the 45 to 64 years age bracket for the primary householder. A total of 2,487 households (44.5%) fall into this category. Meanwhile, the 15 to 24 years age bracket for the primary householder has the lowest median household income of $0, with 14 households (0.3%) in this group.
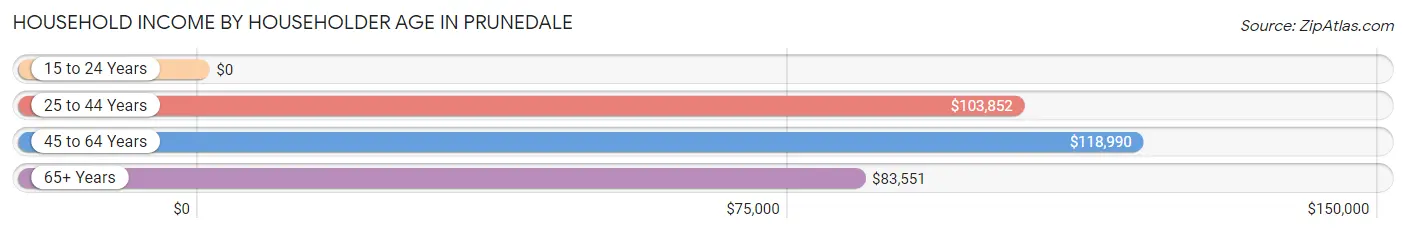
| Income Bracket | # Households | Median Income |
| 15 to 24 Years | 14 (0.3%) | $0 |
| 25 to 44 Years | 1,338 (23.9%) | $103,852 |
| 45 to 64 Years | 2,487 (44.5%) | $118,990 |
| 65+ Years | 1,754 (31.4%) | $83,551 |
| Total | 5,593 (100.0%) | $106,150 |
Poverty in Prunedale
Income Below Poverty by Sex and Age in Prunedale
With 6.8% poverty level for males and 10.5% for females among the residents of Prunedale, 5 year old males and 15 year old females are the most vulnerable to poverty, with 24 males (20.7%) and 83 females (50.0%) in their respective age groups living below the poverty level.
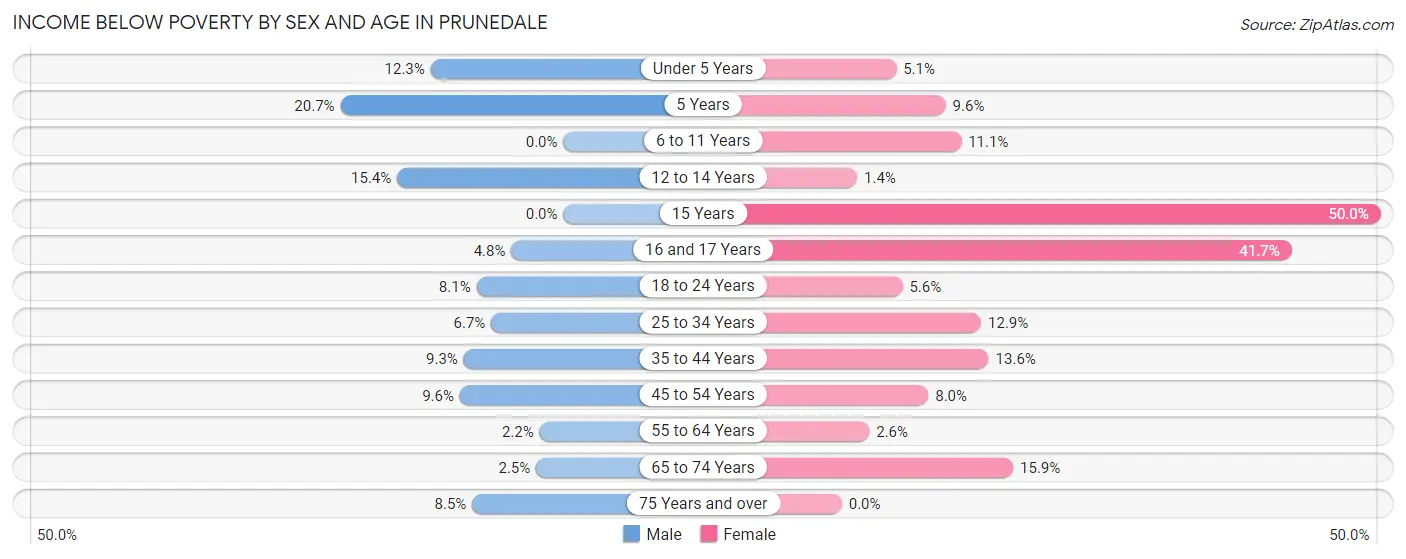
| Age Bracket | Male | Female |
| Under 5 Years | 75 (12.3%) | 25 (5.1%) |
| 5 Years | 24 (20.7%) | 16 (9.6%) |
| 6 to 11 Years | 0 (0.0%) | 113 (11.1%) |
| 12 to 14 Years | 77 (15.4%) | 9 (1.4%) |
| 15 Years | 0 (0.0%) | 83 (50.0%) |
| 16 and 17 Years | 10 (4.8%) | 134 (41.7%) |
| 18 to 24 Years | 52 (8.1%) | 48 (5.6%) |
| 25 to 34 Years | 60 (6.7%) | 149 (12.9%) |
| 35 to 44 Years | 134 (9.2%) | 127 (13.6%) |
| 45 to 54 Years | 95 (9.6%) | 99 (8.0%) |
| 55 to 64 Years | 31 (2.2%) | 29 (2.5%) |
| 65 to 74 Years | 25 (2.5%) | 228 (15.9%) |
| 75 Years and over | 43 (8.5%) | 0 (0.0%) |
| Total | 626 (6.8%) | 1,060 (10.5%) |
Income Above Poverty by Sex and Age in Prunedale
According to the poverty statistics in Prunedale, males aged 6 to 11 years and females aged 75 years and over are the age groups that are most secure financially, with 100.0% of males and 100.0% of females in these age groups living above the poverty line.
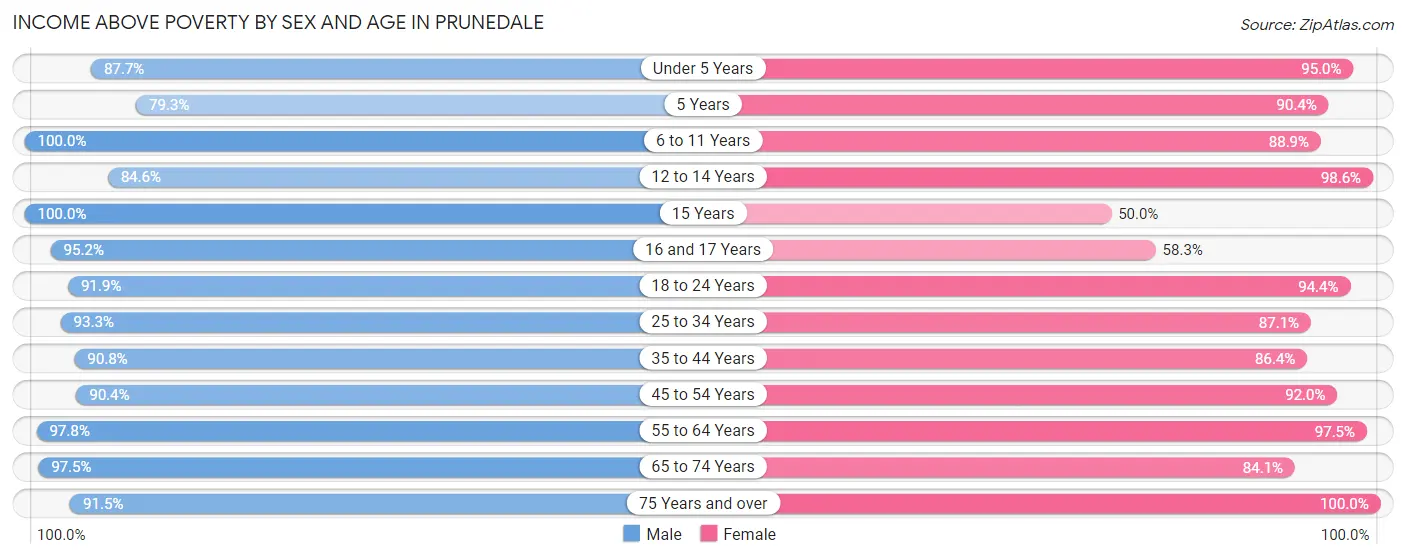
| Age Bracket | Male | Female |
| Under 5 Years | 534 (87.7%) | 470 (95.0%) |
| 5 Years | 92 (79.3%) | 150 (90.4%) |
| 6 to 11 Years | 690 (100.0%) | 907 (88.9%) |
| 12 to 14 Years | 422 (84.6%) | 627 (98.6%) |
| 15 Years | 168 (100.0%) | 83 (50.0%) |
| 16 and 17 Years | 197 (95.2%) | 187 (58.3%) |
| 18 to 24 Years | 593 (91.9%) | 805 (94.4%) |
| 25 to 34 Years | 836 (93.3%) | 1,003 (87.1%) |
| 35 to 44 Years | 1,314 (90.7%) | 805 (86.4%) |
| 45 to 54 Years | 894 (90.4%) | 1,134 (92.0%) |
| 55 to 64 Years | 1,370 (97.8%) | 1,110 (97.5%) |
| 65 to 74 Years | 962 (97.5%) | 1,206 (84.1%) |
| 75 Years and over | 465 (91.5%) | 522 (100.0%) |
| Total | 8,537 (93.2%) | 9,009 (89.5%) |
Income Below Poverty Among Married-Couple Families in Prunedale
The poverty statistics for married-couple families in Prunedale show that 3.4% or 123 of the total 3,672 families live below the poverty line. Families with 3 or 4 children have the highest poverty rate of 7.5%, comprising of 32 families. On the other hand, families with 5 or more children have the lowest poverty rate of 0.0%, which includes 0 families.
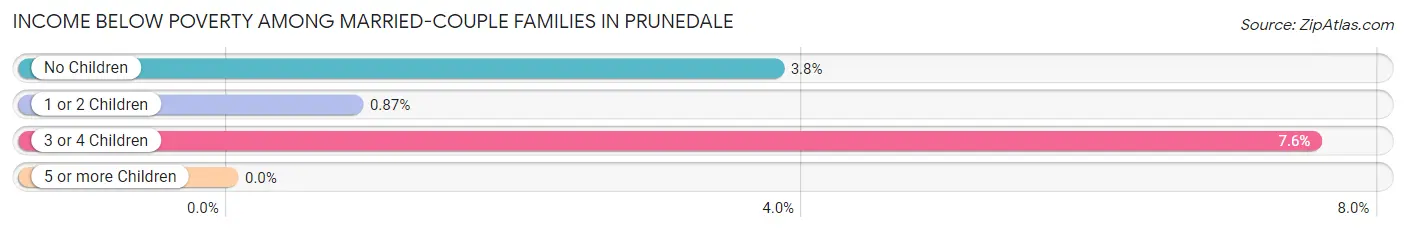
| Children | Above Poverty | Below Poverty |
| No Children | 2,076 (96.2%) | 82 (3.8%) |
| 1 or 2 Children | 1,024 (99.1%) | 9 (0.9%) |
| 3 or 4 Children | 392 (92.4%) | 32 (7.5%) |
| 5 or more Children | 57 (100.0%) | 0 (0.0%) |
| Total | 3,549 (96.7%) | 123 (3.4%) |
Income Below Poverty Among Single-Parent Households in Prunedale
According to the poverty data in Prunedale, 0.6% or 2 single-father households and 8.6% or 43 single-mother households are living below the poverty line. Among single-father households, those with 1 or 2 children have the highest poverty rate, with 2 households (1.4%) experiencing poverty. Likewise, among single-mother households, those with 3 or 4 children have the highest poverty rate, with 43 households (53.1%) falling below the poverty line.
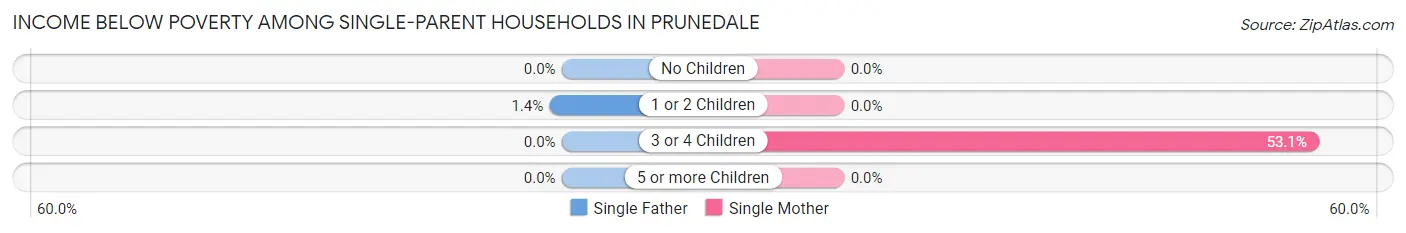
| Children | Single Father | Single Mother |
| No Children | 0 (0.0%) | 0 (0.0%) |
| 1 or 2 Children | 2 (1.4%) | 0 (0.0%) |
| 3 or 4 Children | 0 (0.0%) | 43 (53.1%) |
| 5 or more Children | 0 (0.0%) | 0 (0.0%) |
| Total | 2 (0.6%) | 43 (8.6%) |
Income Below Poverty Among Married-Couple vs Single-Parent Households in Prunedale
The poverty data for Prunedale shows that 123 of the married-couple family households (3.4%) and 45 of the single-parent households (5.4%) are living below the poverty level. Within the married-couple family households, those with 3 or 4 children have the highest poverty rate, with 32 households (7.5%) falling below the poverty line. Among the single-parent households, those with 3 or 4 children have the highest poverty rate, with 43 household (24.6%) living below poverty.
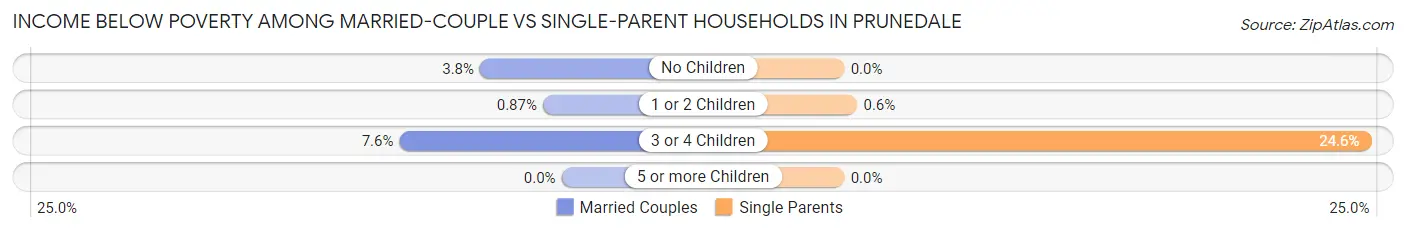
| Children | Married-Couple Families | Single-Parent Households |
| No Children | 82 (3.8%) | 0 (0.0%) |
| 1 or 2 Children | 9 (0.9%) | 2 (0.6%) |
| 3 or 4 Children | 32 (7.5%) | 43 (24.6%) |
| 5 or more Children | 0 (0.0%) | 0 (0.0%) |
| Total | 123 (3.4%) | 45 (5.4%) |
Race in Prunedale
The most populous races in Prunedale are White / Caucasian (10,166 | 52.5%), Hispanic or Latino (9,508 | 49.1%), and Some other Race (4,742 | 24.5%).
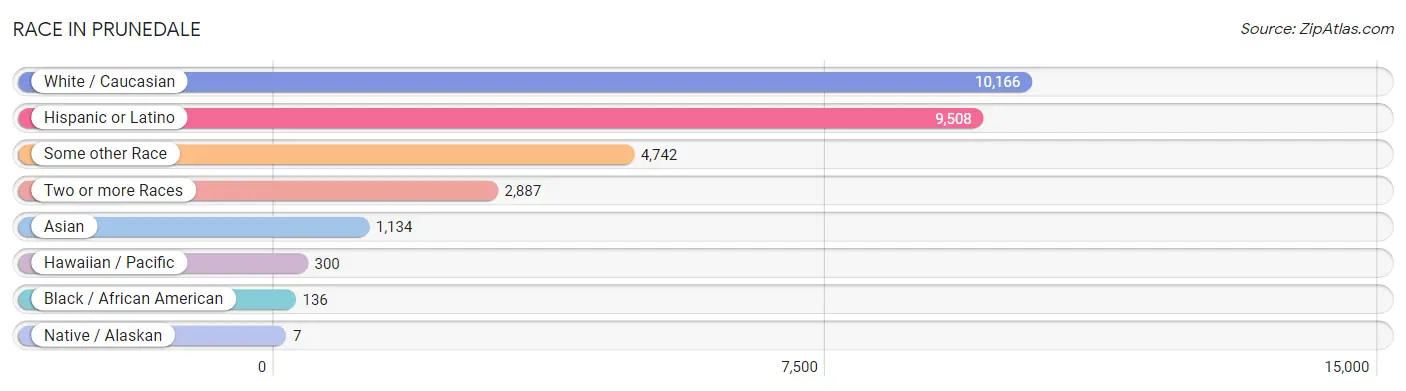
| Race | # Population | % Population |
| Asian | 1,134 | 5.9% |
| Black / African American | 136 | 0.7% |
| Hawaiian / Pacific | 300 | 1.5% |
| Hispanic or Latino | 9,508 | 49.1% |
| Native / Alaskan | 7 | 0.0% |
| White / Caucasian | 10,166 | 52.5% |
| Two or more Races | 2,887 | 14.9% |
| Some other Race | 4,742 | 24.5% |
| Total | 19,372 | 100.0% |
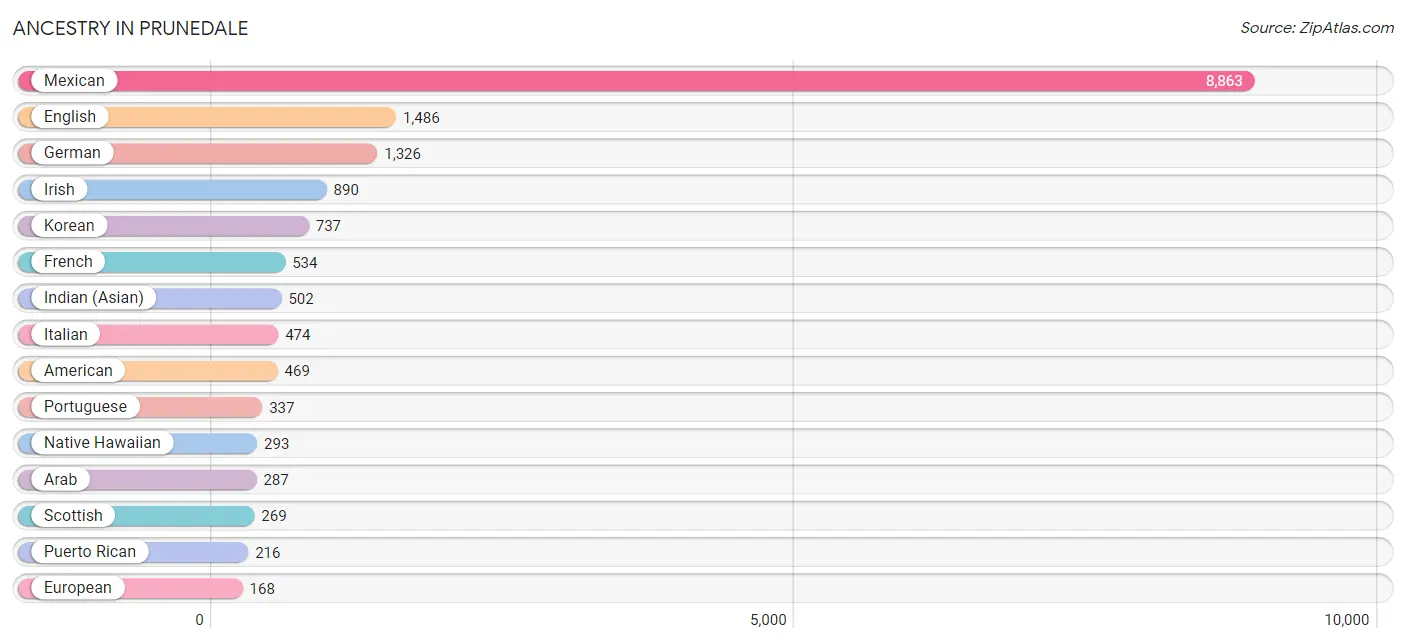
Ancestry in Prunedale
The most populous ancestries reported in Prunedale are Mexican (8,863 | 45.8%), English (1,486 | 7.7%), German (1,326 | 6.8%), Irish (890 | 4.6%), and Korean (737 | 3.8%), together accounting for 68.7% of all Prunedale residents.
| Ancestry | # Population | % Population |
| African | 25 | 0.1% |
| American | 469 | 2.4% |
| Apache | 7 | 0.0% |
| Arab | 287 | 1.5% |
| Arapaho | 16 | 0.1% |
| Armenian | 8 | 0.0% |
| Austrian | 24 | 0.1% |
| Belgian | 43 | 0.2% |
| Bhutanese | 80 | 0.4% |
| Brazilian | 15 | 0.1% |
| British | 97 | 0.5% |
| Burmese | 37 | 0.2% |
| Canadian | 15 | 0.1% |
| Celtic | 22 | 0.1% |
| Central American | 47 | 0.2% |
| Cherokee | 106 | 0.5% |
| Chilean | 6 | 0.0% |
| Choctaw | 63 | 0.3% |
| Colombian | 21 | 0.1% |
| Croatian | 10 | 0.1% |
| Czech | 28 | 0.1% |
| Danish | 97 | 0.5% |
| Dominican | 50 | 0.3% |
| Dutch | 109 | 0.6% |
| Eastern European | 65 | 0.3% |
| Ecuadorian | 98 | 0.5% |
| Egyptian | 110 | 0.6% |
| English | 1,486 | 7.7% |
| European | 168 | 0.9% |
| Finnish | 17 | 0.1% |
| French | 534 | 2.8% |
| French Canadian | 5 | 0.0% |
| German | 1,326 | 6.8% |
| Greek | 15 | 0.1% |
| Guatemalan | 6 | 0.0% |
| Honduran | 30 | 0.2% |
| Hungarian | 13 | 0.1% |
| Indian (Asian) | 502 | 2.6% |
| Iraqi | 80 | 0.4% |
| Irish | 890 | 4.6% |
| Italian | 474 | 2.5% |
| Japanese | 14 | 0.1% |
| Korean | 737 | 3.8% |
| Lebanese | 28 | 0.1% |
| Lithuanian | 6 | 0.0% |
| Mexican | 8,863 | 45.8% |
| Native Hawaiian | 293 | 1.5% |
| Northern European | 38 | 0.2% |
| Norwegian | 128 | 0.7% |
| Palestinian | 9 | 0.1% |
| Paraguayan | 17 | 0.1% |
| Peruvian | 11 | 0.1% |
| Polish | 55 | 0.3% |
| Portuguese | 337 | 1.7% |
| Puerto Rican | 216 | 1.1% |
| Russian | 14 | 0.1% |
| Salvadoran | 11 | 0.1% |
| Samoan | 157 | 0.8% |
| Scandinavian | 90 | 0.5% |
| Scotch-Irish | 98 | 0.5% |
| Scottish | 269 | 1.4% |
| Serbian | 10 | 0.1% |
| Sioux | 10 | 0.1% |
| South African | 28 | 0.1% |
| South American | 153 | 0.8% |
| Spaniard | 10 | 0.1% |
| Spanish | 121 | 0.6% |
| Sri Lankan | 80 | 0.4% |
| Subsaharan African | 53 | 0.3% |
| Swedish | 129 | 0.7% |
| Swiss | 12 | 0.1% |
| Thai | 83 | 0.4% |
| Tongan | 10 | 0.1% |
| Turkish | 91 | 0.5% |
| Ukrainian | 9 | 0.1% |
| Welsh | 31 | 0.2% |
| Yaqui | 10 | 0.1% | View All 77 Rows |
Immigrants in Prunedale
The most numerous immigrant groups reported in Prunedale came from Latin America (3,279 | 16.9%), Central America (3,167 | 16.4%), Mexico (3,137 | 16.2%), Asia (706 | 3.6%), and South Eastern Asia (387 | 2.0%), together accounting for 55.1% of all Prunedale residents.
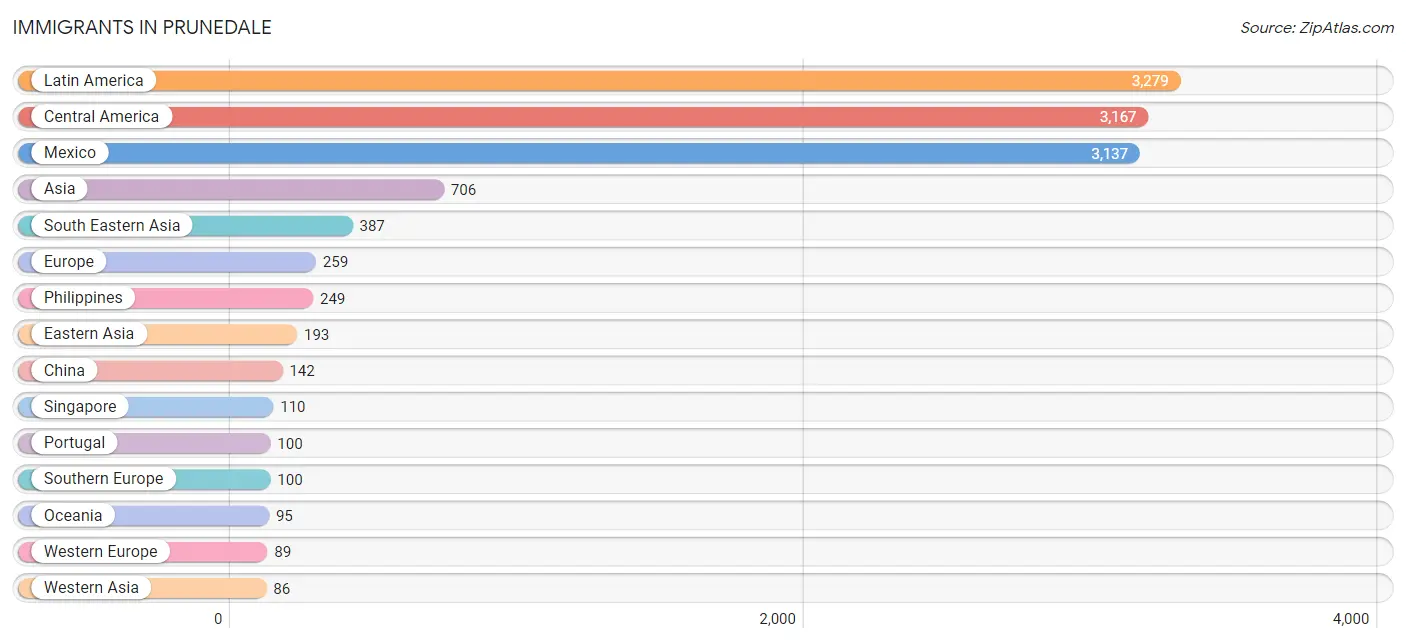
| Immigration Origin | # Population | % Population |
| Asia | 706 | 3.6% |
| Azores | 77 | 0.4% |
| Brazil | 28 | 0.1% |
| Cambodia | 14 | 0.1% |
| Canada | 17 | 0.1% |
| Caribbean | 50 | 0.3% |
| Central America | 3,167 | 16.4% |
| Chile | 6 | 0.0% |
| China | 142 | 0.7% |
| Colombia | 21 | 0.1% |
| Dominican Republic | 50 | 0.3% |
| Eastern Asia | 193 | 1.0% |
| England | 21 | 0.1% |
| Europe | 259 | 1.3% |
| Fiji | 73 | 0.4% |
| France | 41 | 0.2% |
| Germany | 21 | 0.1% |
| Honduras | 30 | 0.2% |
| India | 5 | 0.0% |
| Iraq | 50 | 0.3% |
| Israel | 7 | 0.0% |
| Japan | 18 | 0.1% |
| Korea | 33 | 0.2% |
| Latin America | 3,279 | 16.9% |
| Lebanon | 8 | 0.0% |
| Mexico | 3,137 | 16.2% |
| Netherlands | 27 | 0.1% |
| Northern Europe | 70 | 0.4% |
| Oceania | 95 | 0.5% |
| Philippines | 249 | 1.3% |
| Portugal | 100 | 0.5% |
| Singapore | 110 | 0.6% |
| South America | 62 | 0.3% |
| South Central Asia | 5 | 0.0% |
| South Eastern Asia | 387 | 2.0% |
| Southern Europe | 100 | 0.5% |
| Taiwan | 3 | 0.0% |
| Turkey | 21 | 0.1% |
| Vietnam | 14 | 0.1% |
| Western Asia | 86 | 0.4% |
| Western Europe | 89 | 0.5% | View All 41 Rows |
Sex and Age in Prunedale
Sex and Age in Prunedale
The most populous age groups in Prunedale are 10 to 14 Years (869 | 9.3%) for men and 10 to 14 Years (1,233 | 12.2%) for women.
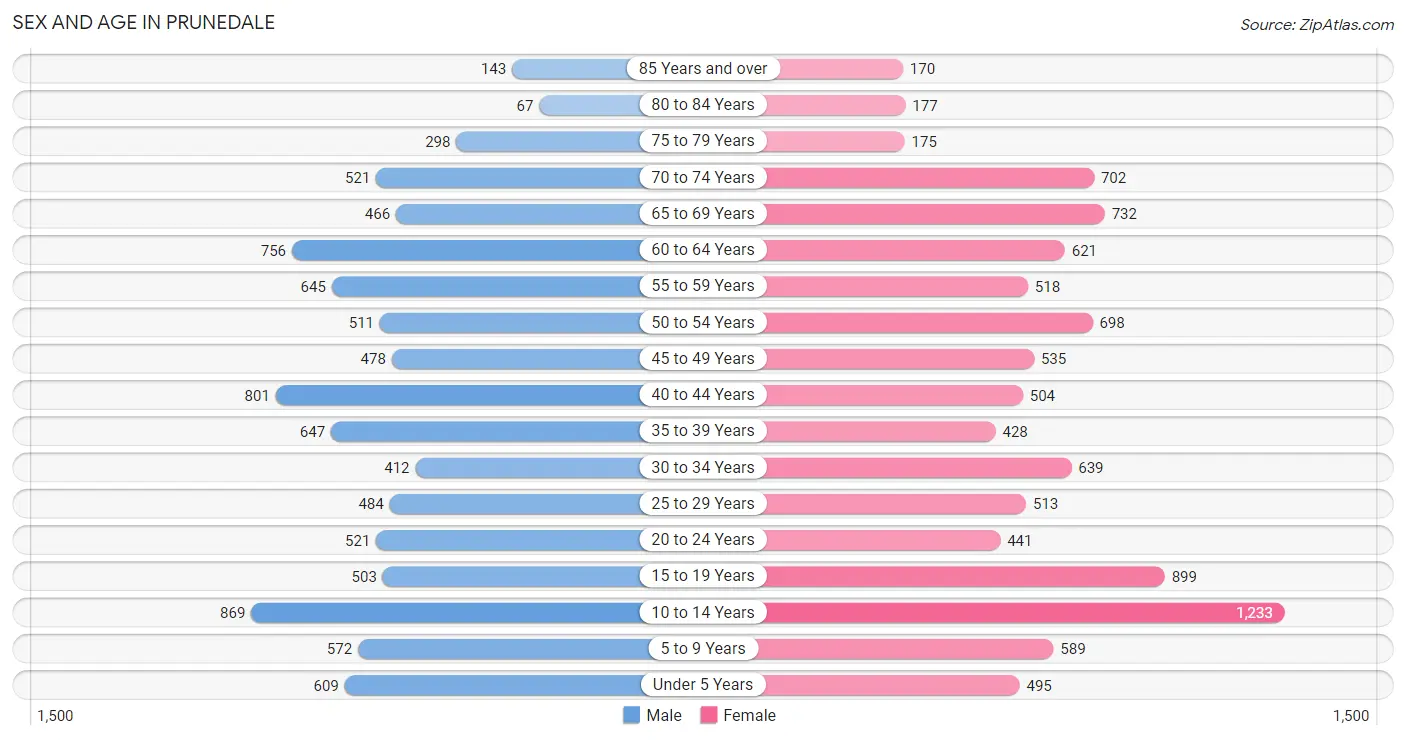
| Age Bracket | Male | Female |
| Under 5 Years | 609 (6.6%) | 495 (4.9%) |
| 5 to 9 Years | 572 (6.1%) | 589 (5.9%) |
| 10 to 14 Years | 869 (9.3%) | 1,233 (12.2%) |
| 15 to 19 Years | 503 (5.4%) | 899 (8.9%) |
| 20 to 24 Years | 521 (5.6%) | 441 (4.4%) |
| 25 to 29 Years | 484 (5.2%) | 513 (5.1%) |
| 30 to 34 Years | 412 (4.4%) | 639 (6.4%) |
| 35 to 39 Years | 647 (7.0%) | 428 (4.3%) |
| 40 to 44 Years | 801 (8.6%) | 504 (5.0%) |
| 45 to 49 Years | 478 (5.1%) | 535 (5.3%) |
| 50 to 54 Years | 511 (5.5%) | 698 (6.9%) |
| 55 to 59 Years | 645 (6.9%) | 518 (5.1%) |
| 60 to 64 Years | 756 (8.1%) | 621 (6.2%) |
| 65 to 69 Years | 466 (5.0%) | 732 (7.3%) |
| 70 to 74 Years | 521 (5.6%) | 702 (7.0%) |
| 75 to 79 Years | 298 (3.2%) | 175 (1.7%) |
| 80 to 84 Years | 67 (0.7%) | 177 (1.8%) |
| 85 Years and over | 143 (1.5%) | 170 (1.7%) |
| Total | 9,303 (100.0%) | 10,069 (100.0%) |
Families and Households in Prunedale
Median Family Size in Prunedale
The median family size in Prunedale is 3.71 persons per family, with married-couple families (3,672 | 81.5%) accounting for the largest median family size of 3.76 persons per family. On the other hand, single female/mother families (499 | 11.1%) represent the smallest median family size with 3.46 persons per family.
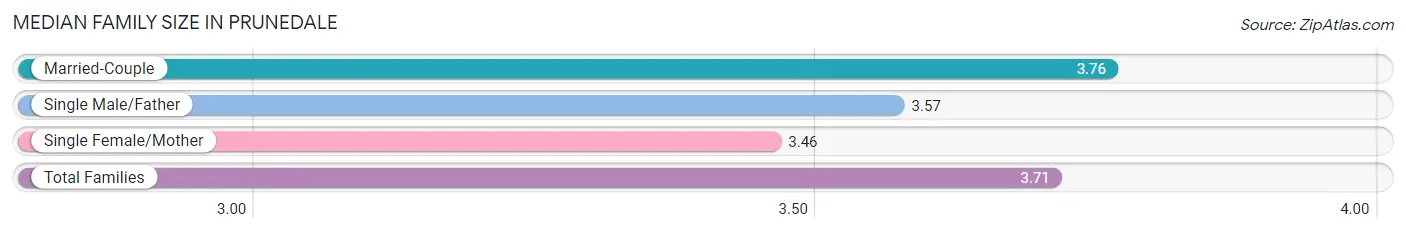
| Family Type | # Families | Family Size |
| Married-Couple | 3,672 (81.5%) | 3.76 |
| Single Male/Father | 336 (7.5%) | 3.57 |
| Single Female/Mother | 499 (11.1%) | 3.46 |
| Total Families | 4,507 (100.0%) | 3.71 |
Median Household Size in Prunedale
The median household size in Prunedale is 3.46 persons per household, with single male/father households (336 | 6.0%) accounting for the largest median household size of 4.55 persons per household. non-family households (1,086 | 19.4%) represent the smallest median household size with 1.67 persons per household.
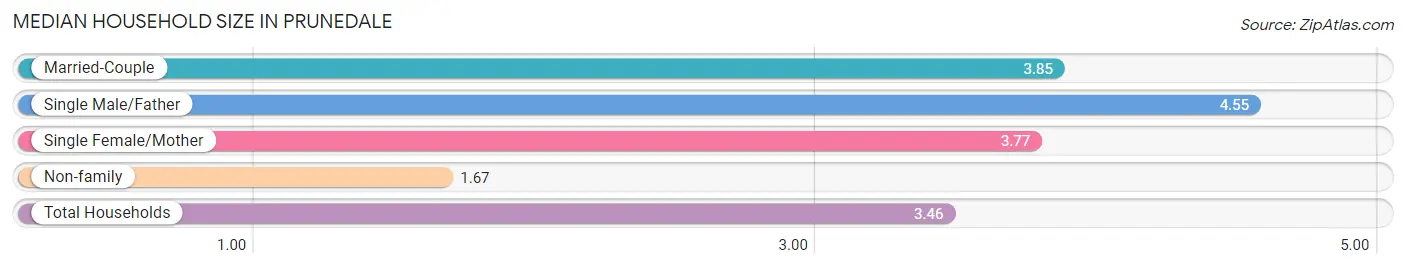
| Household Type | # Households | Household Size |
| Married-Couple | 3,672 (65.6%) | 3.85 |
| Single Male/Father | 336 (6.0%) | 4.55 |
| Single Female/Mother | 499 (8.9%) | 3.77 |
| Non-family | 1,086 (19.4%) | 1.67 |
| Total Households | 5,593 (100.0%) | 3.46 |
Household Size by Marriage Status in Prunedale
Out of a total of 5,593 households in Prunedale, 4,507 (80.6%) are family households, while 1,086 (19.4%) are nonfamily households. The most numerous type of family households are 2-person households, comprising 1,657, and the most common type of nonfamily households are 1-person households, comprising 685.
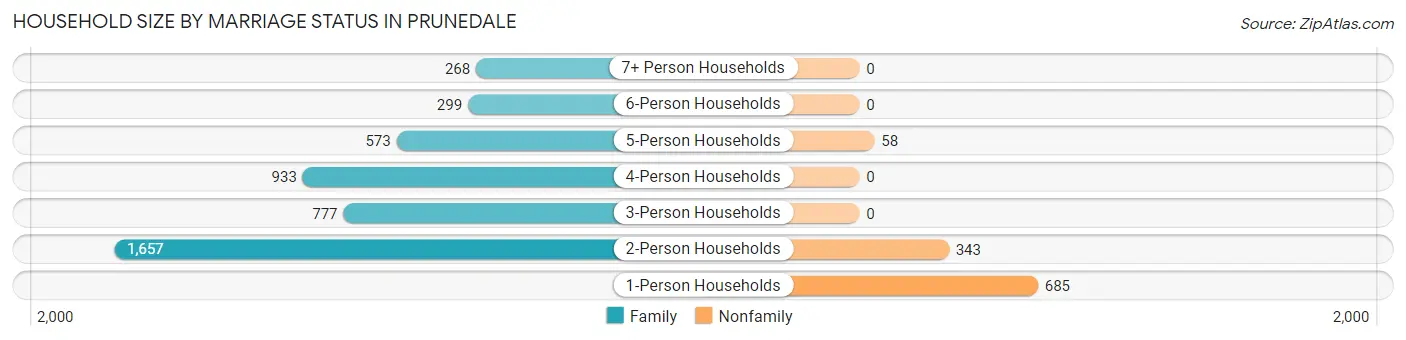
| Household Size | Family Households | Nonfamily Households |
| 1-Person Households | - | 685 (12.2%) |
| 2-Person Households | 1,657 (29.6%) | 343 (6.1%) |
| 3-Person Households | 777 (13.9%) | 0 (0.0%) |
| 4-Person Households | 933 (16.7%) | 0 (0.0%) |
| 5-Person Households | 573 (10.2%) | 58 (1.0%) |
| 6-Person Households | 299 (5.3%) | 0 (0.0%) |
| 7+ Person Households | 268 (4.8%) | 0 (0.0%) |
| Total | 4,507 (80.6%) | 1,086 (19.4%) |
Female Fertility in Prunedale
Fertility by Age in Prunedale
Average fertility rate in Prunedale is 48.0 births per 1,000 women. Women in the age bracket of 20 to 34 years have the highest fertility rate with 87.0 births per 1,000 women. Women in the age bracket of 20 to 34 years acount for 70.2% of all women with births.
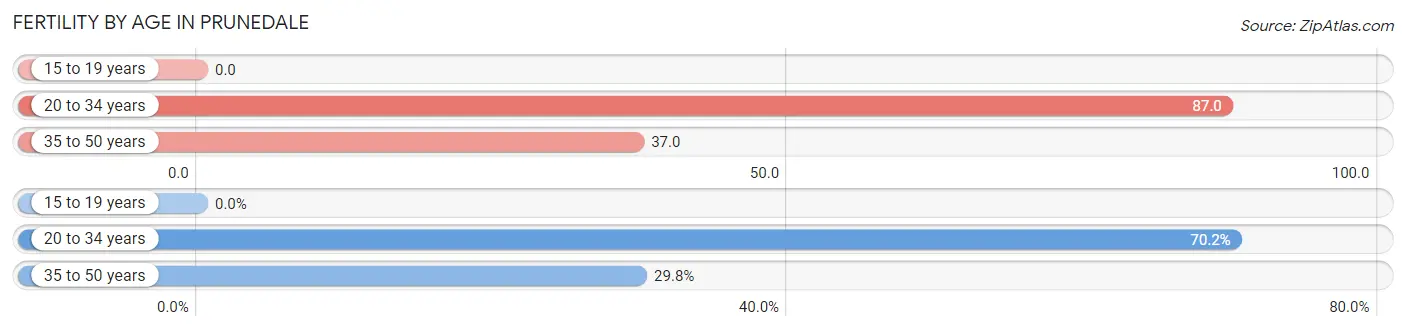
| Age Bracket | Women with Births | Births / 1,000 Women |
| 15 to 19 years | 0 (0.0%) | 0.0 |
| 20 to 34 years | 139 (70.2%) | 87.0 |
| 35 to 50 years | 59 (29.8%) | 37.0 |
| Total | 198 (100.0%) | 48.0 |
Fertility by Age by Marriage Status in Prunedale
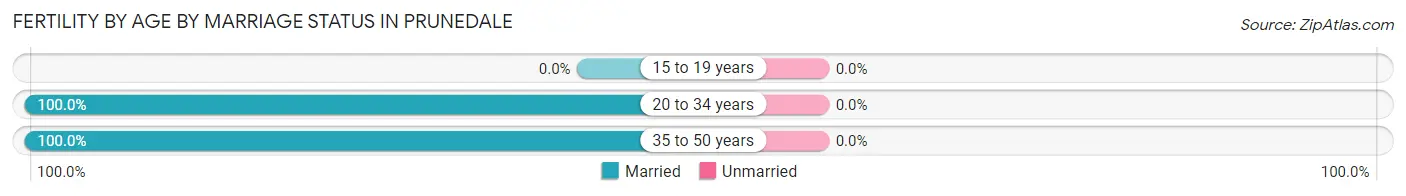
| Age Bracket | Married | Unmarried |
| 15 to 19 years | 0 (0.0%) | 0 (0.0%) |
| 20 to 34 years | 139 (100.0%) | 0 (0.0%) |
| 35 to 50 years | 59 (100.0%) | 0 (0.0%) |
| Total | 198 (100.0%) | 0 (0.0%) |
Fertility by Education in Prunedale
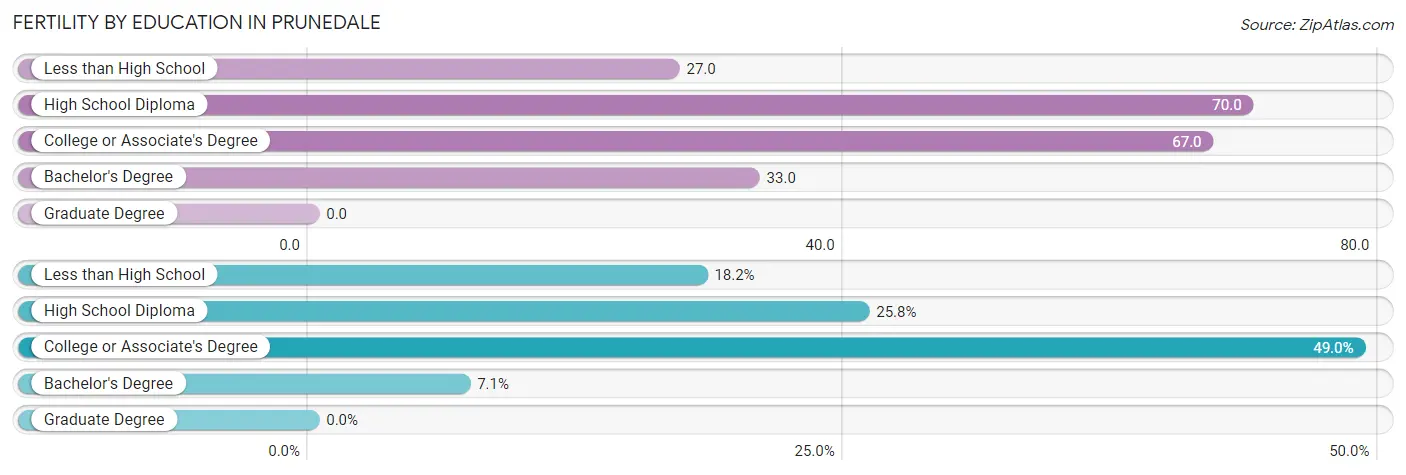
| Educational Attainment | Women with Births | Births / 1,000 Women |
| Less than High School | 36 (18.2%) | 27.0 |
| High School Diploma | 51 (25.8%) | 70.0 |
| College or Associate's Degree | 97 (49.0%) | 67.0 |
| Bachelor's Degree | 14 (7.1%) | 33.0 |
| Graduate Degree | 0 (0.0%) | 0.0 |
| Total | 198 (100.0%) | 48.0 |
Fertility by Education by Marriage Status in Prunedale
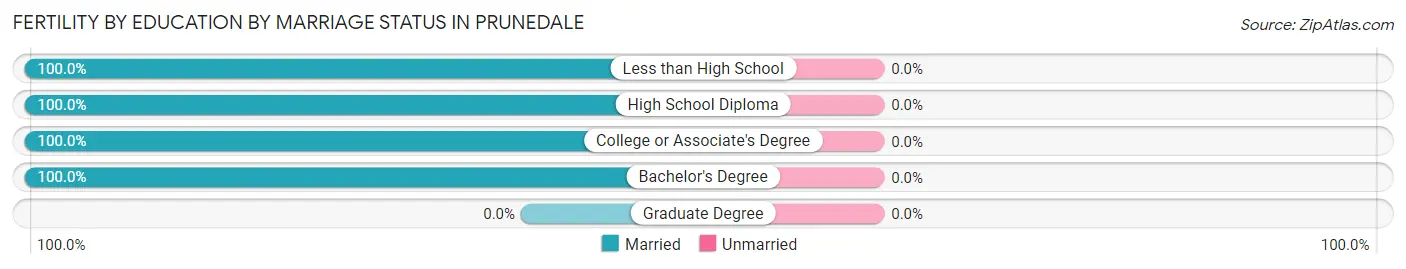
| Educational Attainment | Married | Unmarried |
| Less than High School | 36 (100.0%) | 0 (0.0%) |
| High School Diploma | 51 (100.0%) | 0 (0.0%) |
| College or Associate's Degree | 97 (100.0%) | 0 (0.0%) |
| Bachelor's Degree | 14 (100.0%) | 0 (0.0%) |
| Graduate Degree | 0 (0.0%) | 0 (0.0%) |
| Total | 198 (100.0%) | 0 (0.0%) |
Employment Characteristics in Prunedale
Employment by Class of Employer in Prunedale
Among the 7,513 employed individuals in Prunedale, private company employees (5,102 | 67.9%), self-employed (not incorporated) (712 | 9.5%), and local government employees (573 | 7.6%) make up the most common classes of employment.
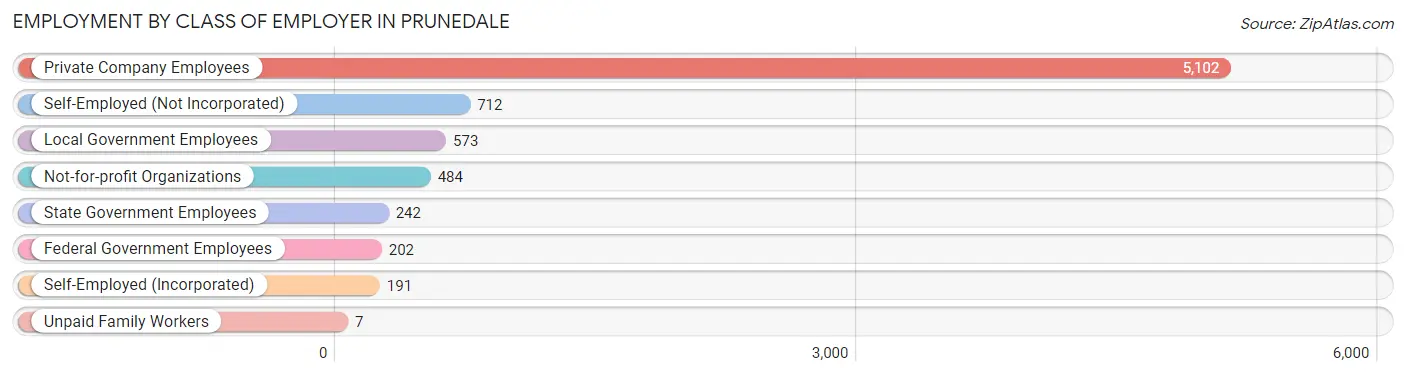
| Employer Class | # Employees | % Employees |
| Private Company Employees | 5,102 | 67.9% |
| Self-Employed (Incorporated) | 191 | 2.5% |
| Self-Employed (Not Incorporated) | 712 | 9.5% |
| Not-for-profit Organizations | 484 | 6.4% |
| Local Government Employees | 573 | 7.6% |
| State Government Employees | 242 | 3.2% |
| Federal Government Employees | 202 | 2.7% |
| Unpaid Family Workers | 7 | 0.1% |
| Total | 7,513 | 100.0% |
Employment Status by Age in Prunedale
According to the labor force statistics for Prunedale, out of the total population over 16 years of age (14,670), 56.7% or 8,318 individuals are in the labor force, with 6.6% or 549 of them unemployed. The age group with the highest labor force participation rate is 55 to 59 years, with 79.6% or 926 individuals in the labor force. Within the labor force, the 25 to 29 years age range has the highest percentage of unemployed individuals, with 12.6% or 72 of them being unemployed.
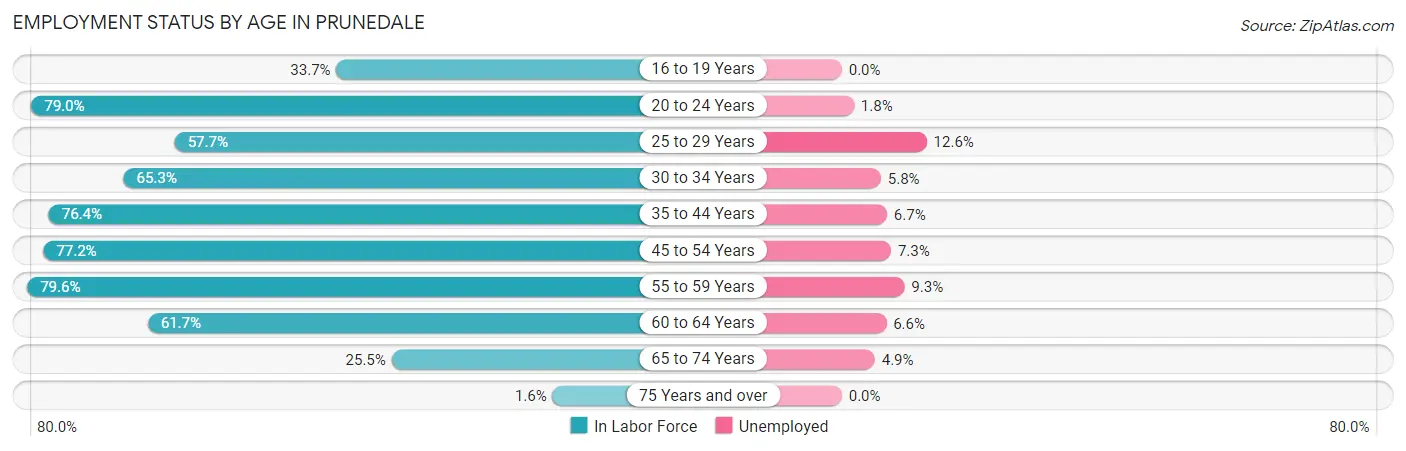
| Age Bracket | In Labor Force | Unemployed |
| 16 to 19 Years | 360 (33.7%) | 0 (0.0%) |
| 20 to 24 Years | 760 (79.0%) | 14 (1.8%) |
| 25 to 29 Years | 575 (57.7%) | 72 (12.6%) |
| 30 to 34 Years | 686 (65.3%) | 40 (5.8%) |
| 35 to 44 Years | 1,818 (76.4%) | 122 (6.7%) |
| 45 to 54 Years | 1,715 (77.2%) | 125 (7.3%) |
| 55 to 59 Years | 926 (79.6%) | 86 (9.3%) |
| 60 to 64 Years | 850 (61.7%) | 56 (6.6%) |
| 65 to 74 Years | 617 (25.5%) | 30 (4.9%) |
| 75 Years and over | 16 (1.6%) | 0 (0.0%) |
| Total | 8,318 (56.7%) | 549 (6.6%) |
Employment Status by Educational Attainment in Prunedale
According to labor force statistics for Prunedale, 71.5% of individuals (6,571) out of the total population between 25 and 64 years of age (9,190) are in the labor force, with 7.6% or 499 of them being unemployed. The group with the highest labor force participation rate are those with the educational attainment of bachelor's degree or higher, with 82.0% or 1,626 individuals in the labor force. Within the labor force, individuals with less than high school education have the highest percentage of unemployment, with 10.9% or 165 of them being unemployed.
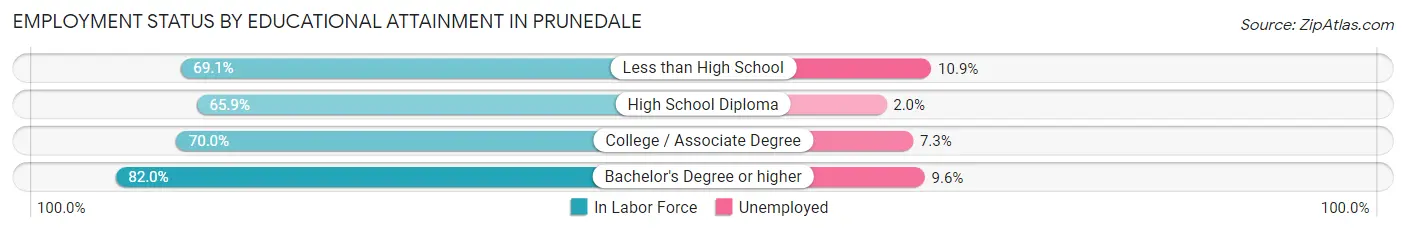
| Educational Attainment | In Labor Force | Unemployed |
| Less than High School | 1,511 (69.1%) | 238 (10.9%) |
| High School Diploma | 1,329 (65.9%) | 40 (2.0%) |
| College / Associate Degree | 2,104 (70.0%) | 219 (7.3%) |
| Bachelor's Degree or higher | 1,626 (82.0%) | 190 (9.6%) |
| Total | 6,571 (71.5%) | 698 (7.6%) |
Employment Occupations by Sex in Prunedale
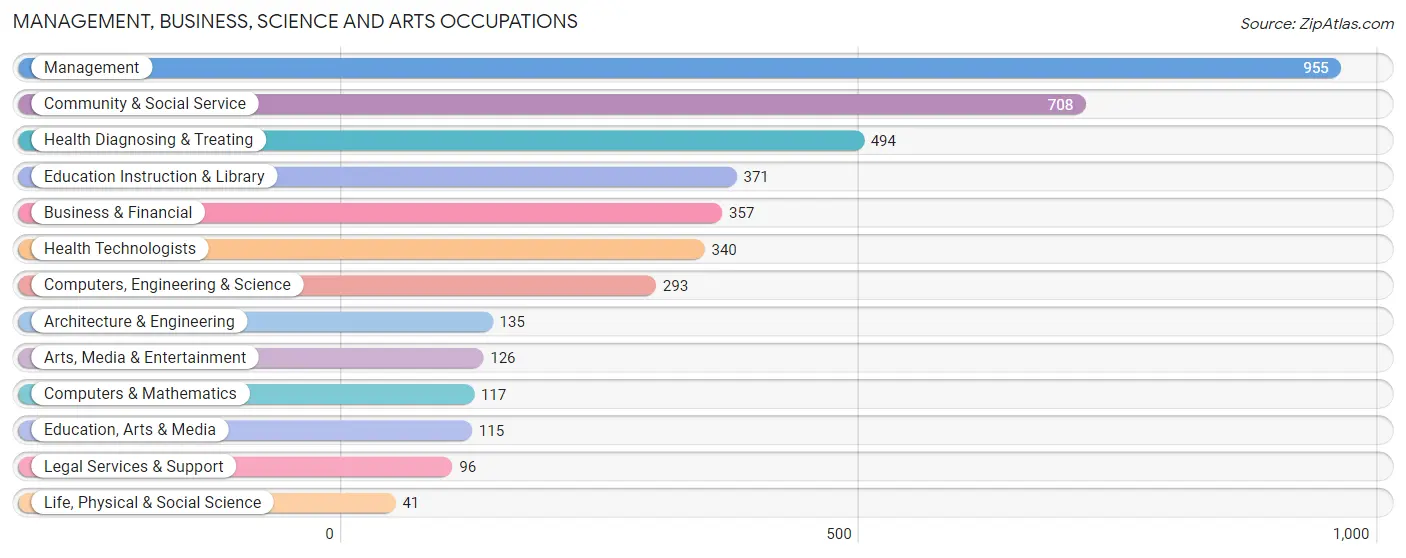
Management, Business, Science and Arts Occupations
The most common Management, Business, Science and Arts occupations in Prunedale are Management (955 | 12.3%), Community & Social Service (708 | 9.1%), Health Diagnosing & Treating (494 | 6.4%), Education Instruction & Library (371 | 4.8%), and Business & Financial (357 | 4.6%).
Management, Business, Science and Arts Occupations by Sex
Within the Management, Business, Science and Arts occupations in Prunedale, the most male-oriented occupations are Life, Physical & Social Science (85.4%), Computers & Mathematics (68.4%), and Computers, Engineering & Science (66.9%), while the most female-oriented occupations are Health Diagnosing & Treating (81.2%), Education Instruction & Library (76.0%), and Health Technologists (74.7%).
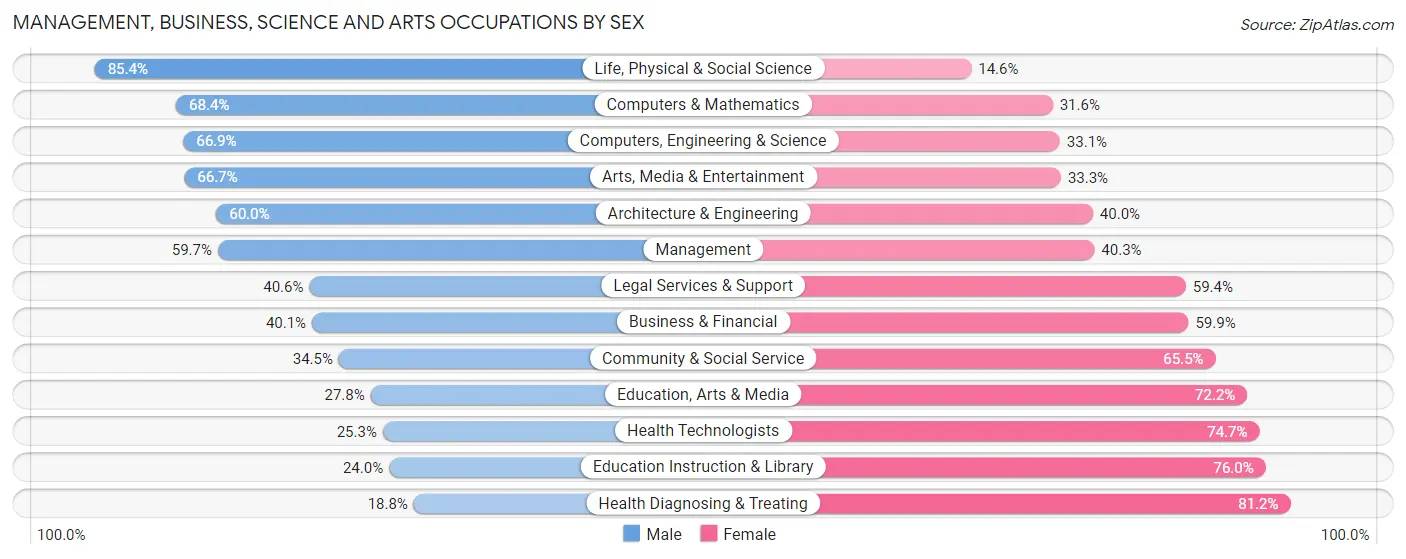
| Occupation | Male | Female |
| Management | 570 (59.7%) | 385 (40.3%) |
| Business & Financial | 143 (40.1%) | 214 (59.9%) |
| Computers, Engineering & Science | 196 (66.9%) | 97 (33.1%) |
| Computers & Mathematics | 80 (68.4%) | 37 (31.6%) |
| Architecture & Engineering | 81 (60.0%) | 54 (40.0%) |
| Life, Physical & Social Science | 35 (85.4%) | 6 (14.6%) |
| Community & Social Service | 244 (34.5%) | 464 (65.5%) |
| Education, Arts & Media | 32 (27.8%) | 83 (72.2%) |
| Legal Services & Support | 39 (40.6%) | 57 (59.4%) |
| Education Instruction & Library | 89 (24.0%) | 282 (76.0%) |
| Arts, Media & Entertainment | 84 (66.7%) | 42 (33.3%) |
| Health Diagnosing & Treating | 93 (18.8%) | 401 (81.2%) |
| Health Technologists | 86 (25.3%) | 254 (74.7%) |
| Total (Category) | 1,246 (44.4%) | 1,561 (55.6%) |
| Total (Overall) | 4,330 (55.7%) | 3,445 (44.3%) |
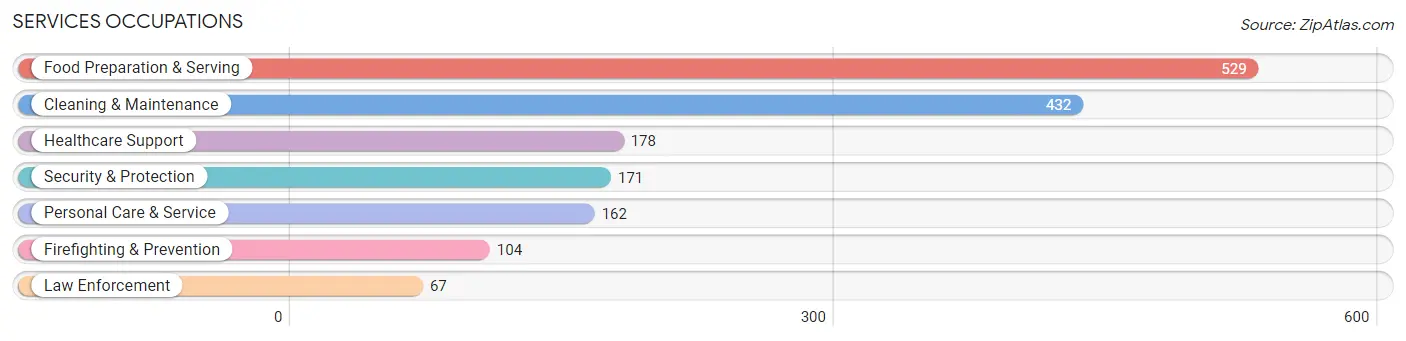
Services Occupations
The most common Services occupations in Prunedale are Food Preparation & Serving (529 | 6.8%), Cleaning & Maintenance (432 | 5.6%), Healthcare Support (178 | 2.3%), Security & Protection (171 | 2.2%), and Personal Care & Service (162 | 2.1%).
Services Occupations by Sex
Within the Services occupations in Prunedale, the most male-oriented occupations are Law Enforcement (100.0%), Cleaning & Maintenance (74.1%), and Security & Protection (60.2%), while the most female-oriented occupations are Healthcare Support (71.9%), Firefighting & Prevention (65.4%), and Food Preparation & Serving (59.0%).
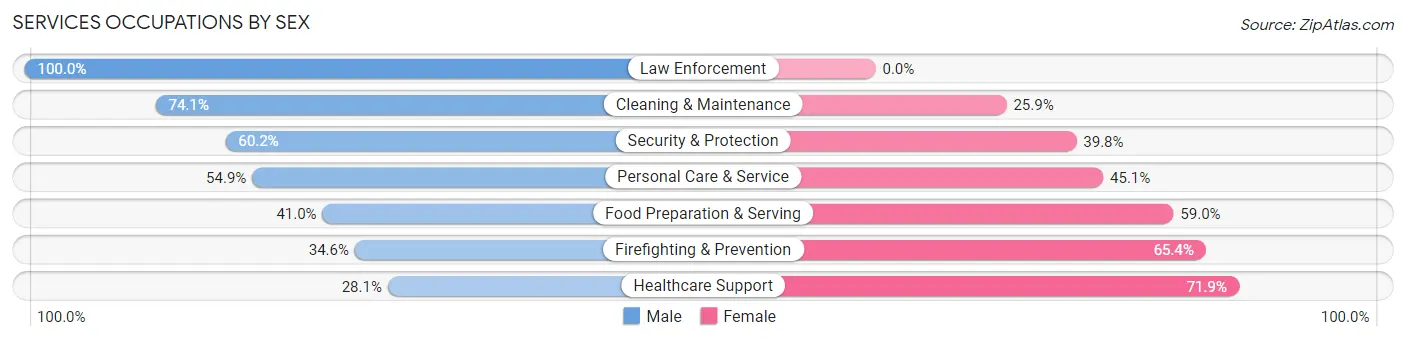
| Occupation | Male | Female |
| Healthcare Support | 50 (28.1%) | 128 (71.9%) |
| Security & Protection | 103 (60.2%) | 68 (39.8%) |
| Firefighting & Prevention | 36 (34.6%) | 68 (65.4%) |
| Law Enforcement | 67 (100.0%) | 0 (0.0%) |
| Food Preparation & Serving | 217 (41.0%) | 312 (59.0%) |
| Cleaning & Maintenance | 320 (74.1%) | 112 (25.9%) |
| Personal Care & Service | 89 (54.9%) | 73 (45.1%) |
| Total (Category) | 779 (52.9%) | 693 (47.1%) |
| Total (Overall) | 4,330 (55.7%) | 3,445 (44.3%) |
Sales and Office Occupations
The most common Sales and Office occupations in Prunedale are Office & Administration (787 | 10.1%), and Sales & Related (751 | 9.7%).

Sales and Office Occupations by Sex
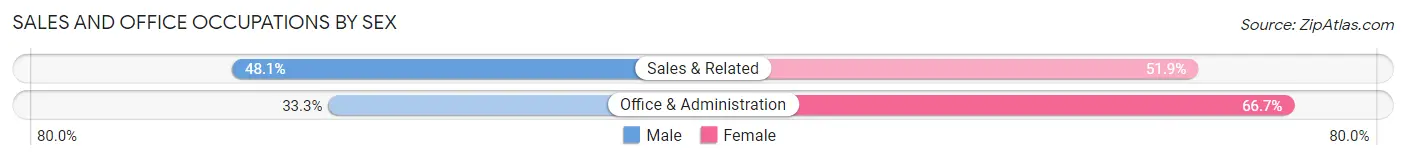
| Occupation | Male | Female |
| Sales & Related | 361 (48.1%) | 390 (51.9%) |
| Office & Administration | 262 (33.3%) | 525 (66.7%) |
| Total (Category) | 623 (40.5%) | 915 (59.5%) |
| Total (Overall) | 4,330 (55.7%) | 3,445 (44.3%) |
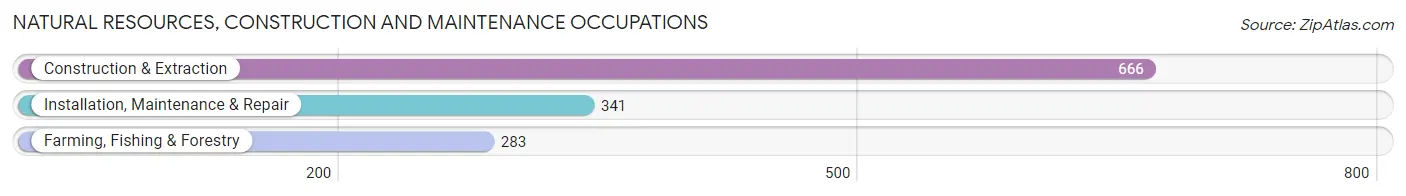
Natural Resources, Construction and Maintenance Occupations
The most common Natural Resources, Construction and Maintenance occupations in Prunedale are Construction & Extraction (666 | 8.6%), Installation, Maintenance & Repair (341 | 4.4%), and Farming, Fishing & Forestry (283 | 3.6%).
Natural Resources, Construction and Maintenance Occupations by Sex
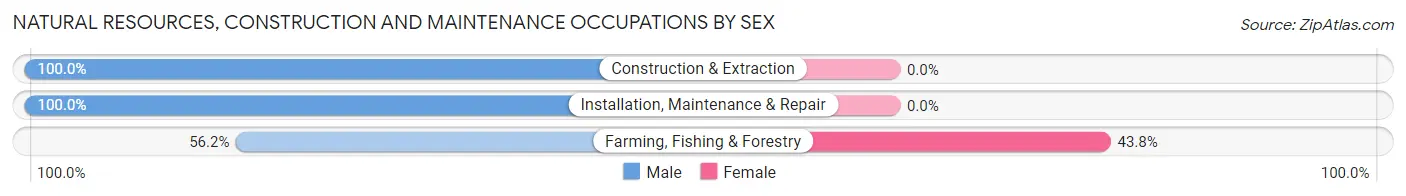
| Occupation | Male | Female |
| Farming, Fishing & Forestry | 159 (56.2%) | 124 (43.8%) |
| Construction & Extraction | 666 (100.0%) | 0 (0.0%) |
| Installation, Maintenance & Repair | 341 (100.0%) | 0 (0.0%) |
| Total (Category) | 1,166 (90.4%) | 124 (9.6%) |
| Total (Overall) | 4,330 (55.7%) | 3,445 (44.3%) |
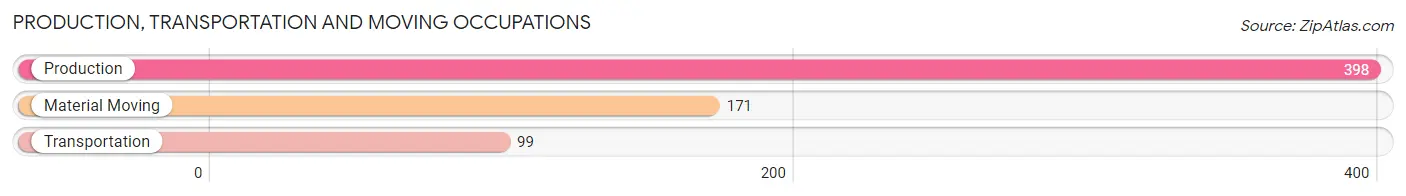
Production, Transportation and Moving Occupations
The most common Production, Transportation and Moving occupations in Prunedale are Production (398 | 5.1%), Material Moving (171 | 2.2%), and Transportation (99 | 1.3%).
Production, Transportation and Moving Occupations by Sex
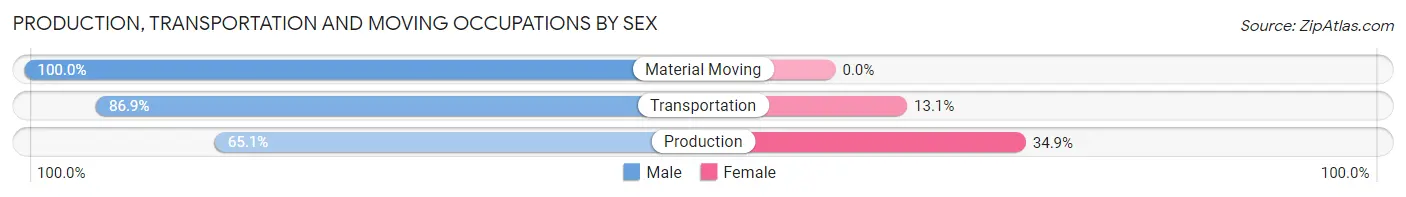
| Occupation | Male | Female |
| Production | 259 (65.1%) | 139 (34.9%) |
| Transportation | 86 (86.9%) | 13 (13.1%) |
| Material Moving | 171 (100.0%) | 0 (0.0%) |
| Total (Category) | 516 (77.2%) | 152 (22.8%) |
| Total (Overall) | 4,330 (55.7%) | 3,445 (44.3%) |
Employment Industries by Sex in Prunedale
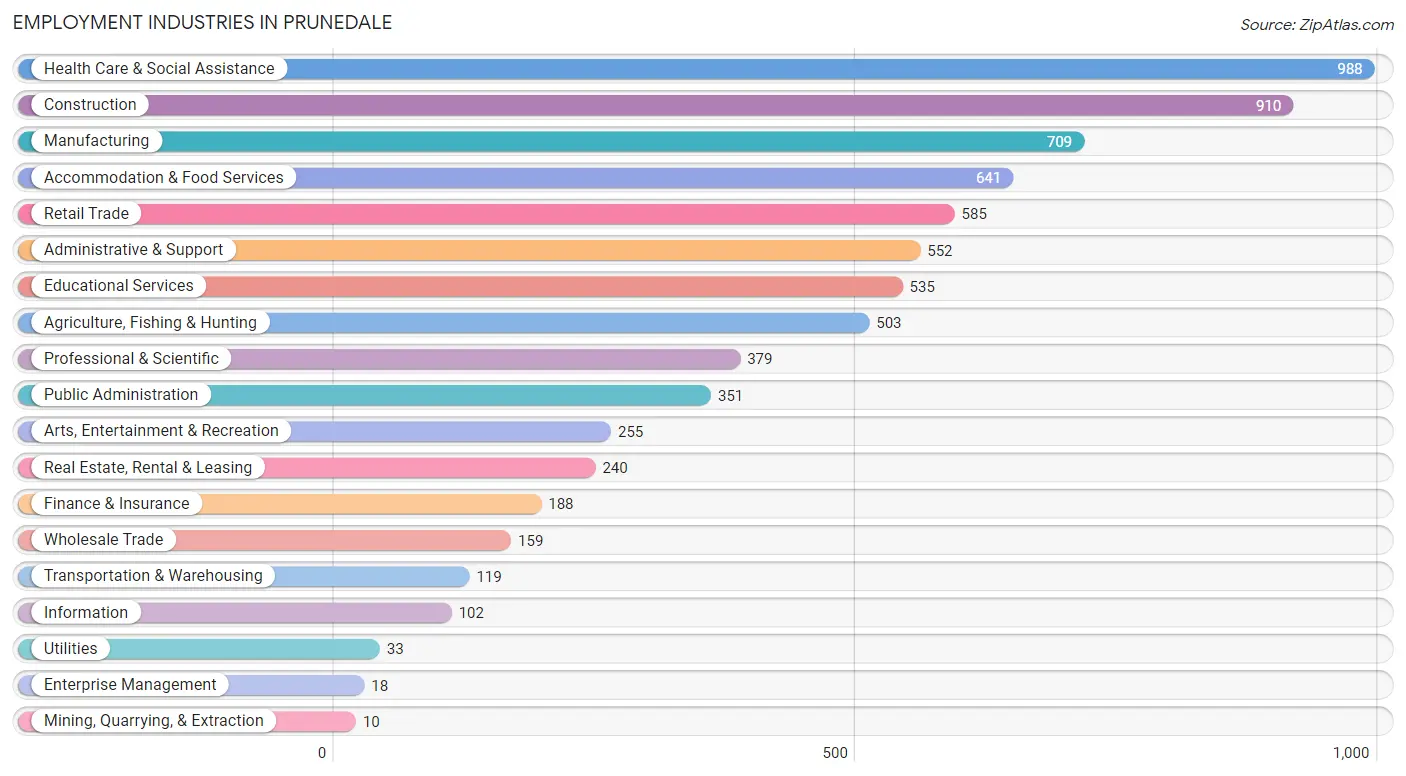
Employment Industries in Prunedale
The major employment industries in Prunedale include Health Care & Social Assistance (988 | 12.7%), Construction (910 | 11.7%), Manufacturing (709 | 9.1%), Accommodation & Food Services (641 | 8.2%), and Retail Trade (585 | 7.5%).
Employment Industries by Sex in Prunedale
The Prunedale industries that see more men than women are Mining, Quarrying, & Extraction (100.0%), Information (100.0%), and Enterprise Management (100.0%), whereas the industries that tend to have a higher number of women are Educational Services (77.0%), Health Care & Social Assistance (72.9%), and Wholesale Trade (64.8%).
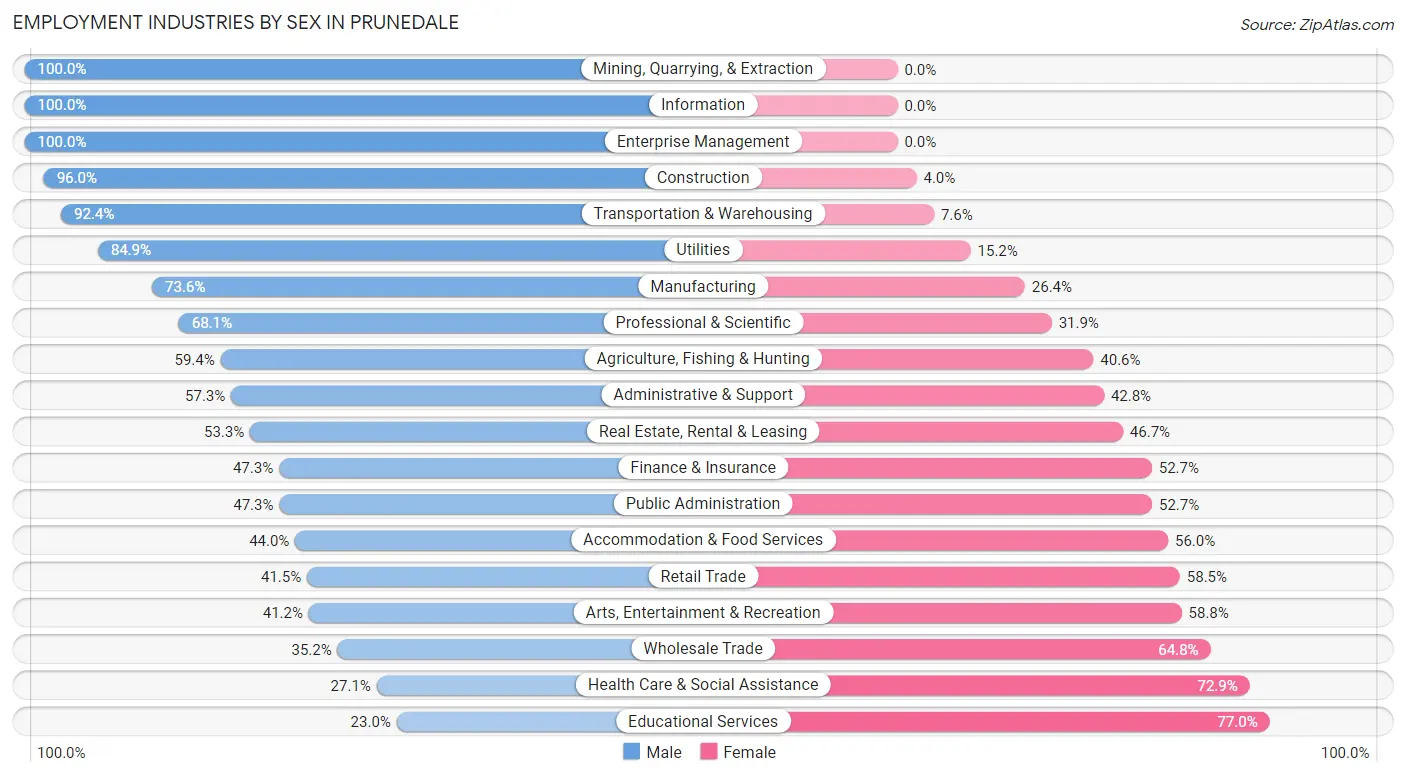
| Industry | Male | Female |
| Agriculture, Fishing & Hunting | 299 (59.4%) | 204 (40.6%) |
| Mining, Quarrying, & Extraction | 10 (100.0%) | 0 (0.0%) |
| Construction | 874 (96.0%) | 36 (4.0%) |
| Manufacturing | 522 (73.6%) | 187 (26.4%) |
| Wholesale Trade | 56 (35.2%) | 103 (64.8%) |
| Retail Trade | 243 (41.5%) | 342 (58.5%) |
| Transportation & Warehousing | 110 (92.4%) | 9 (7.6%) |
| Utilities | 28 (84.9%) | 5 (15.1%) |
| Information | 102 (100.0%) | 0 (0.0%) |
| Finance & Insurance | 89 (47.3%) | 99 (52.7%) |
| Real Estate, Rental & Leasing | 128 (53.3%) | 112 (46.7%) |
| Professional & Scientific | 258 (68.1%) | 121 (31.9%) |
| Enterprise Management | 18 (100.0%) | 0 (0.0%) |
| Administrative & Support | 316 (57.3%) | 236 (42.7%) |
| Educational Services | 123 (23.0%) | 412 (77.0%) |
| Health Care & Social Assistance | 268 (27.1%) | 720 (72.9%) |
| Arts, Entertainment & Recreation | 105 (41.2%) | 150 (58.8%) |
| Accommodation & Food Services | 282 (44.0%) | 359 (56.0%) |
| Public Administration | 166 (47.3%) | 185 (52.7%) |
| Total | 4,330 (55.7%) | 3,445 (44.3%) |
Education in Prunedale
School Enrollment in Prunedale
The most common levels of schooling among the 5,546 students in Prunedale are middle school (1,445 | 26.1%), high school (1,442 | 26.0%), and college / undergraduate (1,156 | 20.8%).
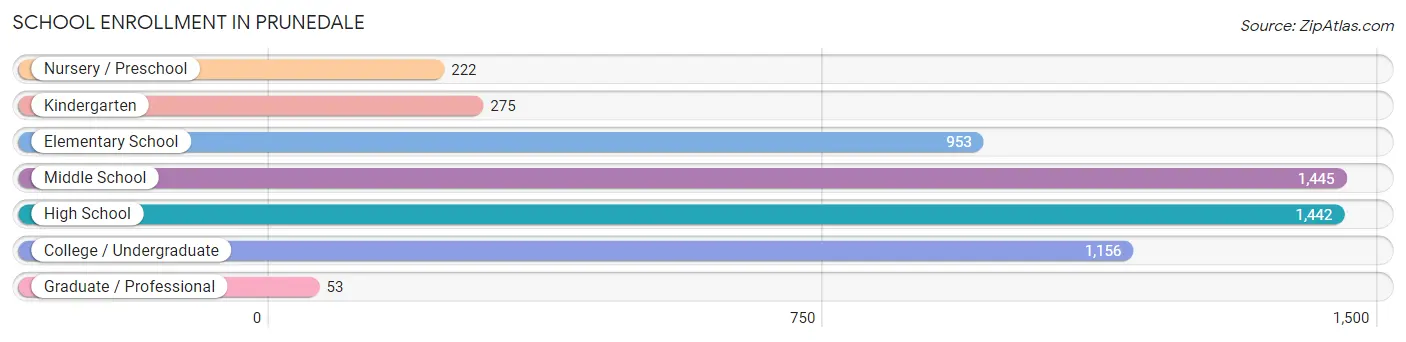
| School Level | # Students | % Students |
| Nursery / Preschool | 222 | 4.0% |
| Kindergarten | 275 | 5.0% |
| Elementary School | 953 | 17.2% |
| Middle School | 1,445 | 26.1% |
| High School | 1,442 | 26.0% |
| College / Undergraduate | 1,156 | 20.8% |
| Graduate / Professional | 53 | 1.0% |
| Total | 5,546 | 100.0% |
School Enrollment by Age by Funding Source in Prunedale
Out of a total of 5,546 students who are enrolled in schools in Prunedale, 666 (12.0%) attend a private institution, while the remaining 4,880 (88.0%) are enrolled in public schools. The age group of 35 years and over has the highest likelihood of being enrolled in private schools, with 30 (20.0% in the age bracket) enrolled. Conversely, the age group of 3 to 4 year olds has the lowest likelihood of being enrolled in a private school, with 135 (100.0% in the age bracket) attending a public institution.
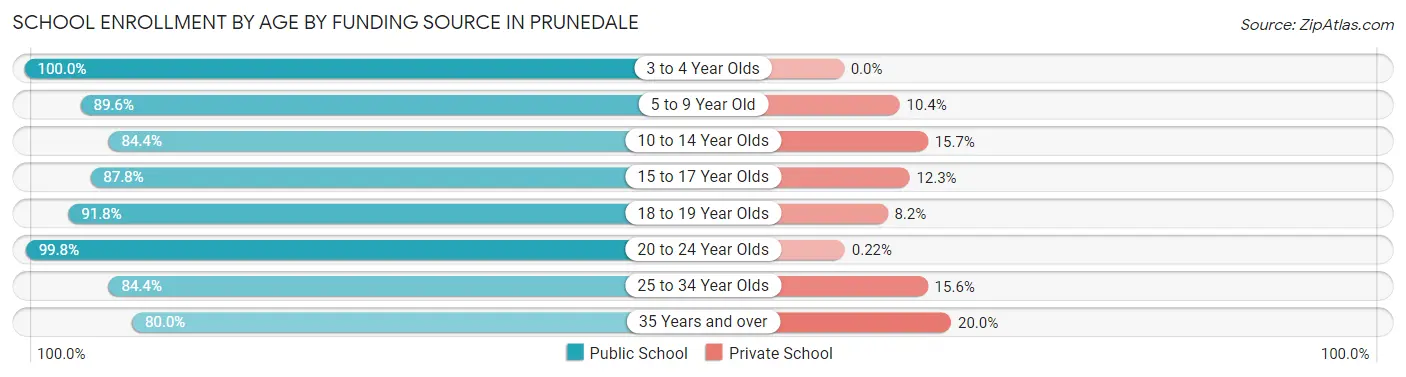
| Age Bracket | Public School | Private School |
| 3 to 4 Year Olds | 135 (100.0%) | 0 (0.0%) |
| 5 to 9 Year Old | 1,040 (89.6%) | 121 (10.4%) |
| 10 to 14 Year Olds | 1,757 (84.4%) | 326 (15.7%) |
| 15 to 17 Year Olds | 759 (87.7%) | 106 (12.2%) |
| 18 to 19 Year Olds | 349 (91.8%) | 31 (8.2%) |
| 20 to 24 Year Olds | 445 (99.8%) | 1 (0.2%) |
| 25 to 34 Year Olds | 275 (84.4%) | 51 (15.6%) |
| 35 Years and over | 120 (80.0%) | 30 (20.0%) |
| Total | 4,880 (88.0%) | 666 (12.0%) |
Educational Attainment by Field of Study in Prunedale
Science & technology (358 | 11.0%), business (344 | 10.5%), education (311 | 9.5%), liberal arts & history (308 | 9.4%), and engineering (305 | 9.3%) are the most common fields of study among 3,269 individuals in Prunedale who have obtained a bachelor's degree or higher.
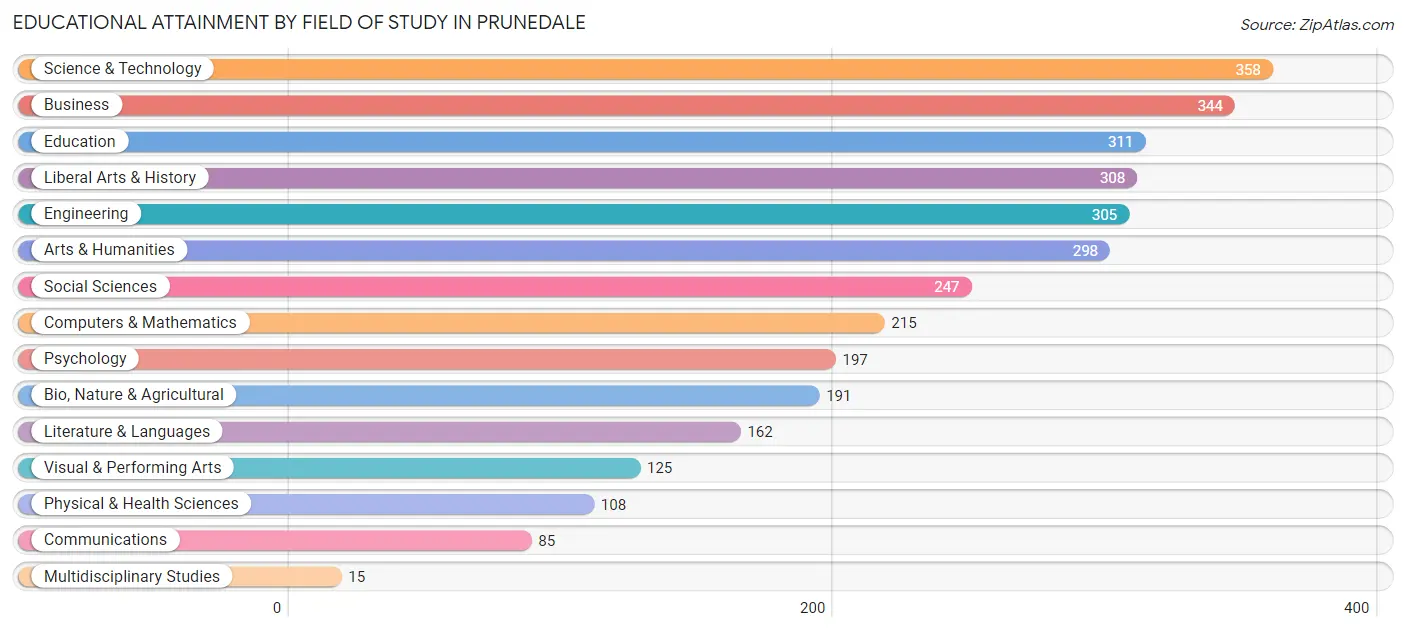
| Field of Study | # Graduates | % Graduates |
| Computers & Mathematics | 215 | 6.6% |
| Bio, Nature & Agricultural | 191 | 5.8% |
| Physical & Health Sciences | 108 | 3.3% |
| Psychology | 197 | 6.0% |
| Social Sciences | 247 | 7.6% |
| Engineering | 305 | 9.3% |
| Multidisciplinary Studies | 15 | 0.5% |
| Science & Technology | 358 | 11.0% |
| Business | 344 | 10.5% |
| Education | 311 | 9.5% |
| Literature & Languages | 162 | 5.0% |
| Liberal Arts & History | 308 | 9.4% |
| Visual & Performing Arts | 125 | 3.8% |
| Communications | 85 | 2.6% |
| Arts & Humanities | 298 | 9.1% |
| Total | 3,269 | 100.0% |
Transportation & Commute in Prunedale
Vehicle Availability by Sex in Prunedale
The most prevalent vehicle ownership categories in Prunedale are males with 3 vehicles (1,419, accounting for 33.7%) and females with 3 vehicles (1,286, making up 43.0%).
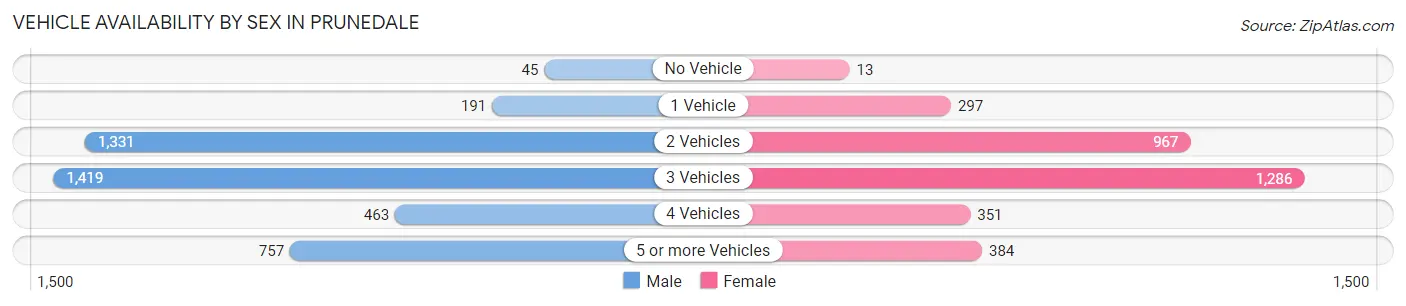
| Vehicles Available | Male | Female |
| No Vehicle | 45 (1.1%) | 13 (0.4%) |
| 1 Vehicle | 191 (4.5%) | 297 (9.0%) |
| 2 Vehicles | 1,331 (31.7%) | 967 (29.3%) |
| 3 Vehicles | 1,419 (33.7%) | 1,286 (39.0%) |
| 4 Vehicles | 463 (11.0%) | 351 (10.6%) |
| 5 or more Vehicles | 757 (18.0%) | 384 (11.6%) |
| Total | 4,206 (100.0%) | 3,298 (100.0%) |
Commute Time in Prunedale
The most frequently occuring commute durations in Prunedale are 20 to 24 minutes (1,647 commuters, 23.7%), 30 to 34 minutes (901 commuters, 13.0%), and 15 to 19 minutes (875 commuters, 12.6%).
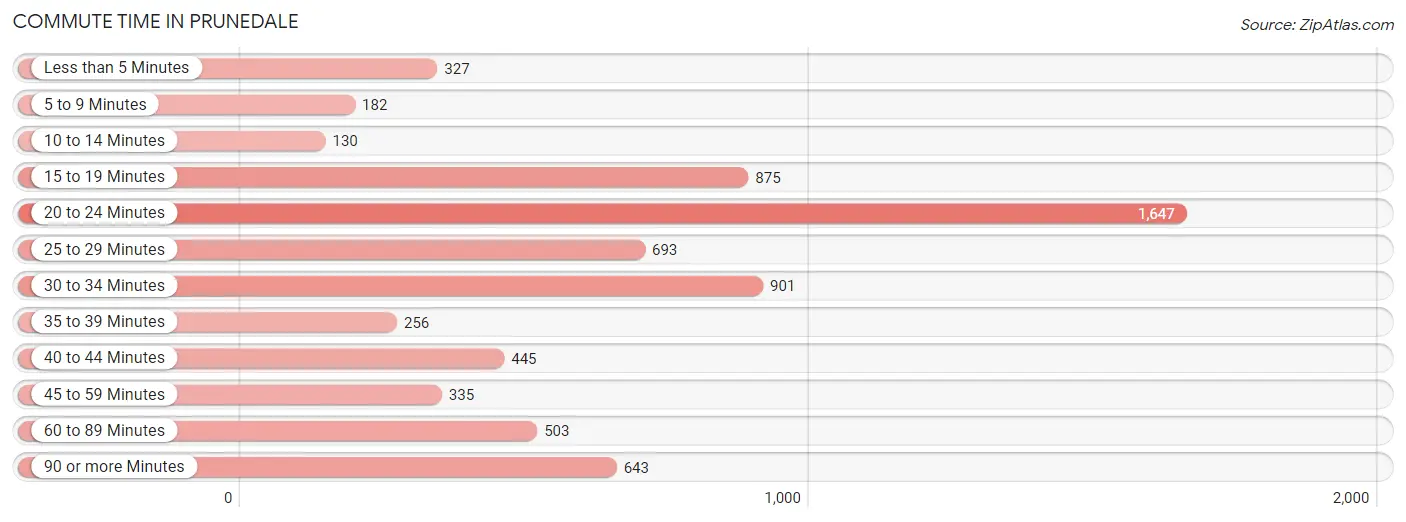
| Commute Time | # Commuters | % Commuters |
| Less than 5 Minutes | 327 | 4.7% |
| 5 to 9 Minutes | 182 | 2.6% |
| 10 to 14 Minutes | 130 | 1.9% |
| 15 to 19 Minutes | 875 | 12.6% |
| 20 to 24 Minutes | 1,647 | 23.7% |
| 25 to 29 Minutes | 693 | 10.0% |
| 30 to 34 Minutes | 901 | 13.0% |
| 35 to 39 Minutes | 256 | 3.7% |
| 40 to 44 Minutes | 445 | 6.4% |
| 45 to 59 Minutes | 335 | 4.8% |
| 60 to 89 Minutes | 503 | 7.2% |
| 90 or more Minutes | 643 | 9.3% |
Commute Time by Sex in Prunedale
The most common commute times in Prunedale are 20 to 24 minutes (764 commuters, 19.0%) for males and 20 to 24 minutes (883 commuters, 30.4%) for females.
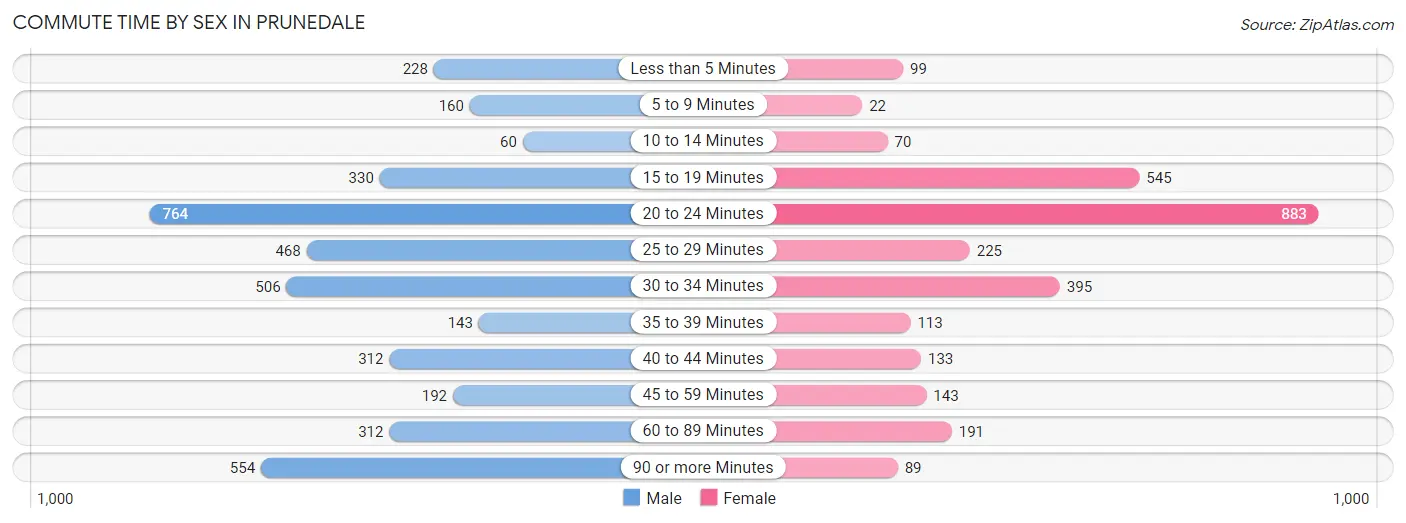
| Commute Time | Male | Female |
| Less than 5 Minutes | 228 (5.7%) | 99 (3.4%) |
| 5 to 9 Minutes | 160 (4.0%) | 22 (0.8%) |
| 10 to 14 Minutes | 60 (1.5%) | 70 (2.4%) |
| 15 to 19 Minutes | 330 (8.2%) | 545 (18.7%) |
| 20 to 24 Minutes | 764 (19.0%) | 883 (30.4%) |
| 25 to 29 Minutes | 468 (11.6%) | 225 (7.7%) |
| 30 to 34 Minutes | 506 (12.6%) | 395 (13.6%) |
| 35 to 39 Minutes | 143 (3.5%) | 113 (3.9%) |
| 40 to 44 Minutes | 312 (7.7%) | 133 (4.6%) |
| 45 to 59 Minutes | 192 (4.8%) | 143 (4.9%) |
| 60 to 89 Minutes | 312 (7.7%) | 191 (6.6%) |
| 90 or more Minutes | 554 (13.8%) | 89 (3.1%) |
Time of Departure to Work by Sex in Prunedale
The most frequent times of departure to work in Prunedale are 7:00 AM to 7:29 AM (1,194, 29.6%) for males and 7:00 AM to 7:29 AM (709, 24.4%) for females.
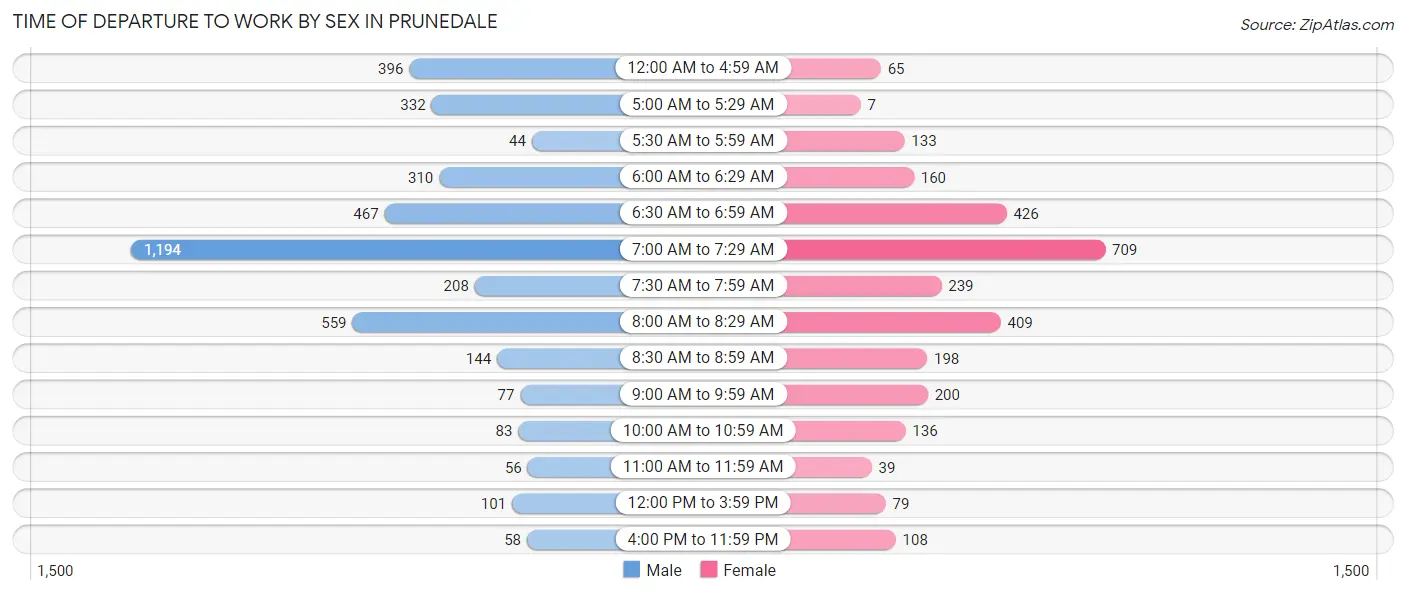
| Time of Departure | Male | Female |
| 12:00 AM to 4:59 AM | 396 (9.8%) | 65 (2.2%) |
| 5:00 AM to 5:29 AM | 332 (8.2%) | 7 (0.2%) |
| 5:30 AM to 5:59 AM | 44 (1.1%) | 133 (4.6%) |
| 6:00 AM to 6:29 AM | 310 (7.7%) | 160 (5.5%) |
| 6:30 AM to 6:59 AM | 467 (11.6%) | 426 (14.6%) |
| 7:00 AM to 7:29 AM | 1,194 (29.6%) | 709 (24.4%) |
| 7:30 AM to 7:59 AM | 208 (5.2%) | 239 (8.2%) |
| 8:00 AM to 8:29 AM | 559 (13.9%) | 409 (14.1%) |
| 8:30 AM to 8:59 AM | 144 (3.6%) | 198 (6.8%) |
| 9:00 AM to 9:59 AM | 77 (1.9%) | 200 (6.9%) |
| 10:00 AM to 10:59 AM | 83 (2.1%) | 136 (4.7%) |
| 11:00 AM to 11:59 AM | 56 (1.4%) | 39 (1.3%) |
| 12:00 PM to 3:59 PM | 101 (2.5%) | 79 (2.7%) |
| 4:00 PM to 11:59 PM | 58 (1.4%) | 108 (3.7%) |
| Total | 4,029 (100.0%) | 2,908 (100.0%) |
Housing Occupancy in Prunedale
Occupancy by Ownership in Prunedale
Of the total 5,593 dwellings in Prunedale, owner-occupied units account for 4,456 (79.7%), while renter-occupied units make up 1,137 (20.3%).
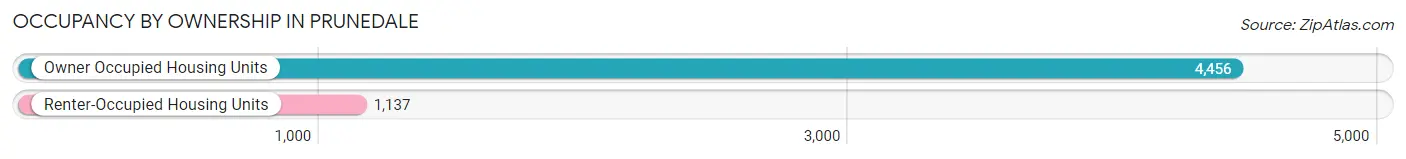
| Occupancy | # Housing Units | % Housing Units |
| Owner Occupied Housing Units | 4,456 | 79.7% |
| Renter-Occupied Housing Units | 1,137 | 20.3% |
| Total Occupied Housing Units | 5,593 | 100.0% |
Occupancy by Household Size in Prunedale
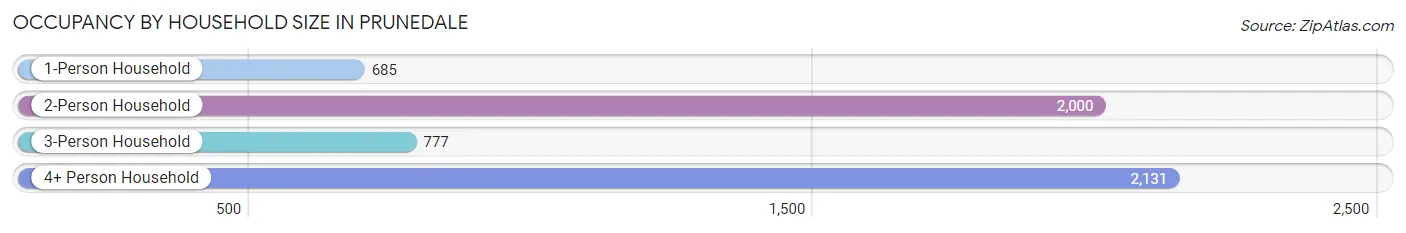
| Household Size | # Housing Units | % Housing Units |
| 1-Person Household | 685 | 12.2% |
| 2-Person Household | 2,000 | 35.8% |
| 3-Person Household | 777 | 13.9% |
| 4+ Person Household | 2,131 | 38.1% |
| Total Housing Units | 5,593 | 100.0% |
Occupancy by Ownership by Household Size in Prunedale
| Household Size | Owner-occupied | Renter-occupied |
| 1-Person Household | 567 (82.8%) | 118 (17.2%) |
| 2-Person Household | 1,738 (86.9%) | 262 (13.1%) |
| 3-Person Household | 602 (77.5%) | 175 (22.5%) |
| 4+ Person Household | 1,549 (72.7%) | 582 (27.3%) |
| Total Housing Units | 4,456 (79.7%) | 1,137 (20.3%) |
Occupancy by Educational Attainment in Prunedale
| Household Size | Owner-occupied | Renter-occupied |
| Less than High School | 615 (54.9%) | 505 (45.1%) |
| High School Diploma | 742 (82.6%) | 156 (17.4%) |
| College/Associate Degree | 1,845 (84.5%) | 338 (15.5%) |
| Bachelor's Degree or higher | 1,254 (90.1%) | 138 (9.9%) |
Occupancy by Age of Householder in Prunedale
| Age Bracket | # Households | % Households |
| Under 35 Years | 384 | 6.9% |
| 35 to 44 Years | 968 | 17.3% |
| 45 to 54 Years | 1,112 | 19.9% |
| 55 to 64 Years | 1,375 | 24.6% |
| 65 to 74 Years | 1,384 | 24.7% |
| 75 to 84 Years | 259 | 4.6% |
| 85 Years and Over | 111 | 2.0% |
| Total | 5,593 | 100.0% |
Housing Finances in Prunedale
Median Income by Occupancy in Prunedale
| Occupancy Type | # Households | Median Income |
| Owner-Occupied | 4,456 (79.7%) | $114,461 |
| Renter-Occupied | 1,137 (20.3%) | $62,105 |
| Average | 5,593 (100.0%) | $106,150 |
Occupancy by Householder Income Bracket in Prunedale
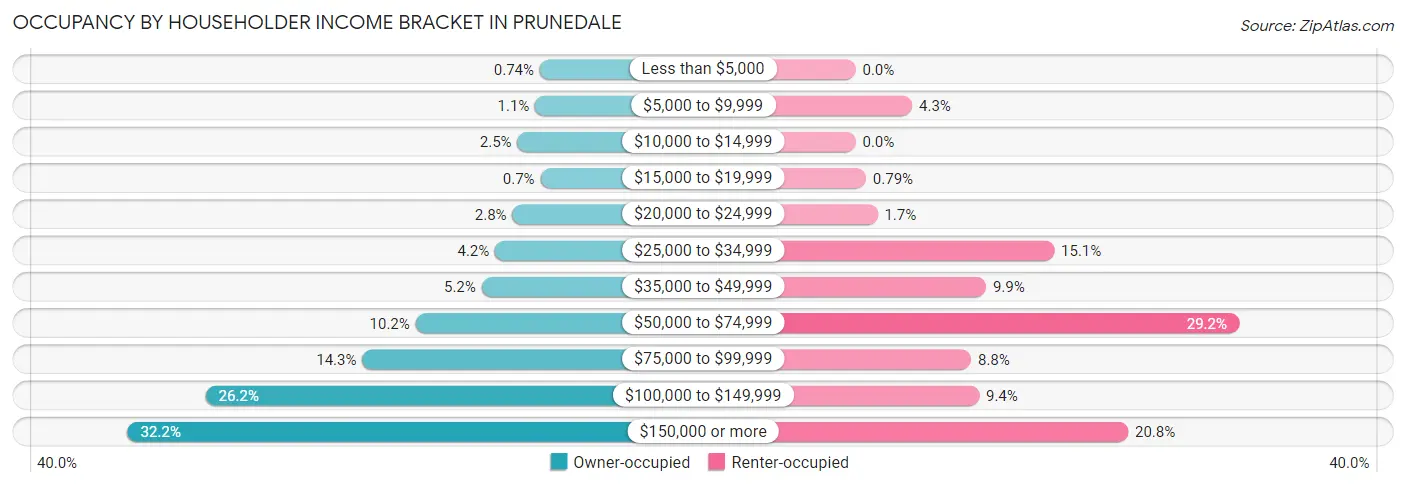
| Income Bracket | Owner-occupied | Renter-occupied |
| Less than $5,000 | 33 (0.7%) | 0 (0.0%) |
| $5,000 to $9,999 | 49 (1.1%) | 49 (4.3%) |
| $10,000 to $14,999 | 109 (2.5%) | 0 (0.0%) |
| $15,000 to $19,999 | 31 (0.7%) | 9 (0.8%) |
| $20,000 to $24,999 | 126 (2.8%) | 19 (1.7%) |
| $25,000 to $34,999 | 185 (4.2%) | 172 (15.1%) |
| $35,000 to $49,999 | 231 (5.2%) | 113 (9.9%) |
| $50,000 to $74,999 | 455 (10.2%) | 332 (29.2%) |
| $75,000 to $99,999 | 636 (14.3%) | 100 (8.8%) |
| $100,000 to $149,999 | 1,168 (26.2%) | 107 (9.4%) |
| $150,000 or more | 1,433 (32.2%) | 236 (20.8%) |
| Total | 4,456 (100.0%) | 1,137 (100.0%) |
Monthly Housing Cost Tiers in Prunedale
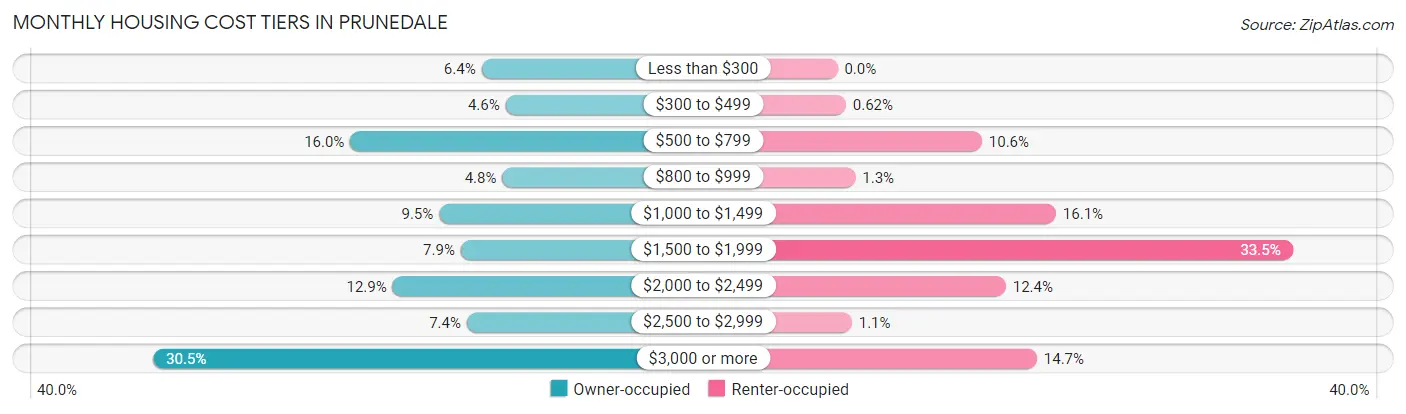
| Monthly Cost | Owner-occupied | Renter-occupied |
| Less than $300 | 283 (6.4%) | 0 (0.0%) |
| $300 to $499 | 204 (4.6%) | 7 (0.6%) |
| $500 to $799 | 714 (16.0%) | 121 (10.6%) |
| $800 to $999 | 215 (4.8%) | 15 (1.3%) |
| $1,000 to $1,499 | 422 (9.5%) | 183 (16.1%) |
| $1,500 to $1,999 | 351 (7.9%) | 381 (33.5%) |
| $2,000 to $2,499 | 575 (12.9%) | 141 (12.4%) |
| $2,500 to $2,999 | 331 (7.4%) | 12 (1.1%) |
| $3,000 or more | 1,361 (30.5%) | 167 (14.7%) |
| Total | 4,456 (100.0%) | 1,137 (100.0%) |
Physical Housing Characteristics in Prunedale
Housing Structures in Prunedale
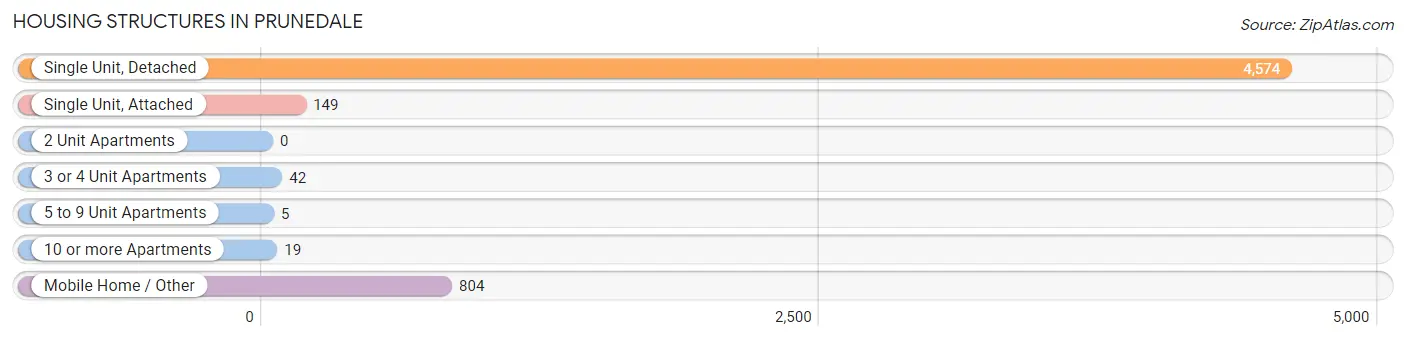
| Structure Type | # Housing Units | % Housing Units |
| Single Unit, Detached | 4,574 | 81.8% |
| Single Unit, Attached | 149 | 2.7% |
| 2 Unit Apartments | 0 | 0.0% |
| 3 or 4 Unit Apartments | 42 | 0.7% |
| 5 to 9 Unit Apartments | 5 | 0.1% |
| 10 or more Apartments | 19 | 0.3% |
| Mobile Home / Other | 804 | 14.4% |
| Total | 5,593 | 100.0% |
Housing Structures by Occupancy in Prunedale
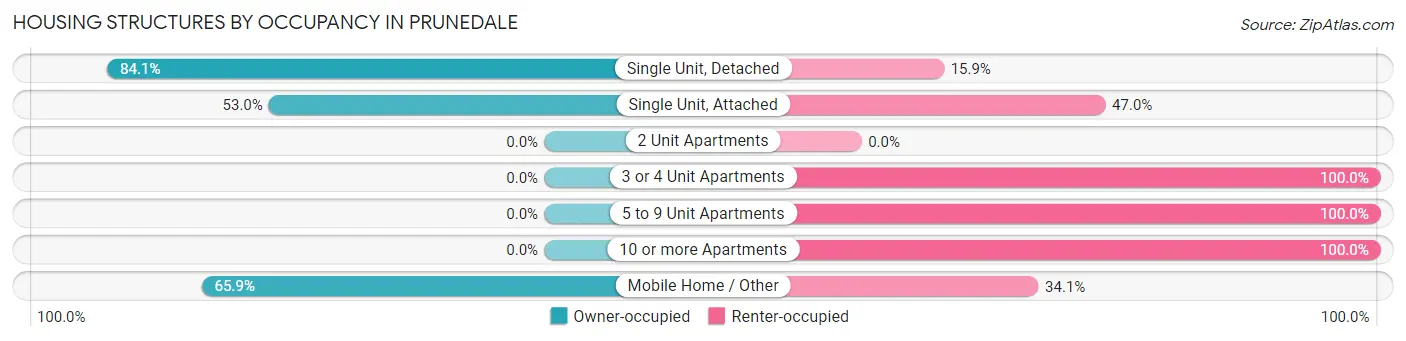
| Structure Type | Owner-occupied | Renter-occupied |
| Single Unit, Detached | 3,847 (84.1%) | 727 (15.9%) |
| Single Unit, Attached | 79 (53.0%) | 70 (47.0%) |
| 2 Unit Apartments | 0 (0.0%) | 0 (0.0%) |
| 3 or 4 Unit Apartments | 0 (0.0%) | 42 (100.0%) |
| 5 to 9 Unit Apartments | 0 (0.0%) | 5 (100.0%) |
| 10 or more Apartments | 0 (0.0%) | 19 (100.0%) |
| Mobile Home / Other | 530 (65.9%) | 274 (34.1%) |
| Total | 4,456 (79.7%) | 1,137 (20.3%) |
Housing Structures by Number of Rooms in Prunedale
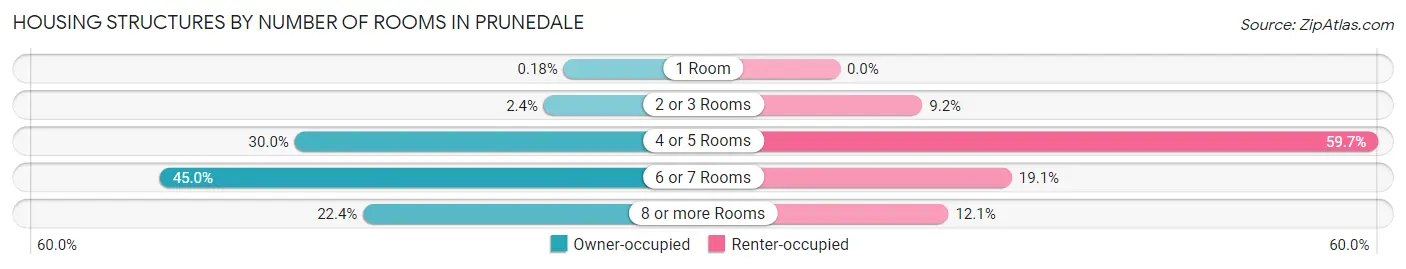
| Number of Rooms | Owner-occupied | Renter-occupied |
| 1 Room | 8 (0.2%) | 0 (0.0%) |
| 2 or 3 Rooms | 106 (2.4%) | 104 (9.1%) |
| 4 or 5 Rooms | 1,338 (30.0%) | 679 (59.7%) |
| 6 or 7 Rooms | 2,005 (45.0%) | 217 (19.1%) |
| 8 or more Rooms | 999 (22.4%) | 137 (12.0%) |
| Total | 4,456 (100.0%) | 1,137 (100.0%) |
Housing Structure by Heating Type in Prunedale
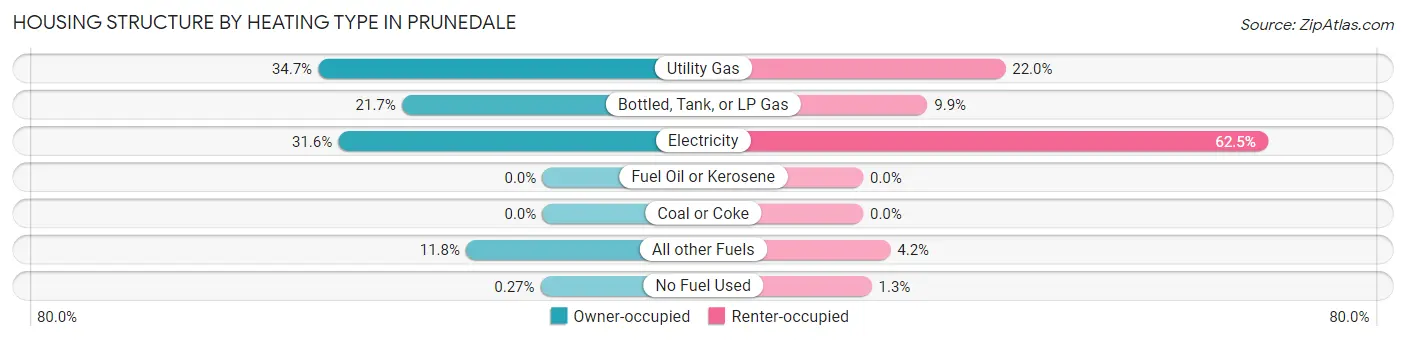
| Heating Type | Owner-occupied | Renter-occupied |
| Utility Gas | 1,544 (34.6%) | 250 (22.0%) |
| Bottled, Tank, or LP Gas | 968 (21.7%) | 113 (9.9%) |
| Electricity | 1,406 (31.6%) | 711 (62.5%) |
| Fuel Oil or Kerosene | 0 (0.0%) | 0 (0.0%) |
| Coal or Coke | 0 (0.0%) | 0 (0.0%) |
| All other Fuels | 526 (11.8%) | 48 (4.2%) |
| No Fuel Used | 12 (0.3%) | 15 (1.3%) |
| Total | 4,456 (100.0%) | 1,137 (100.0%) |
Household Vehicle Usage in Prunedale
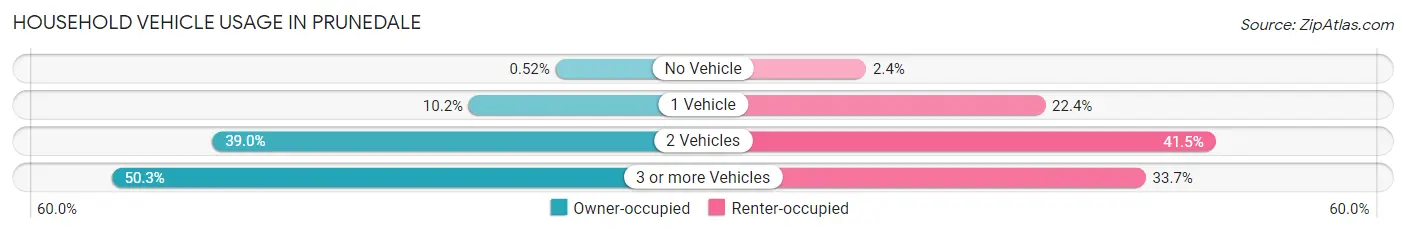
| Vehicles per Household | Owner-occupied | Renter-occupied |
| No Vehicle | 23 (0.5%) | 27 (2.4%) |
| 1 Vehicle | 456 (10.2%) | 255 (22.4%) |
| 2 Vehicles | 1,737 (39.0%) | 472 (41.5%) |
| 3 or more Vehicles | 2,240 (50.3%) | 383 (33.7%) |
| Total | 4,456 (100.0%) | 1,137 (100.0%) |
Real Estate & Mortgages in Prunedale
Real Estate and Mortgage Overview in Prunedale
| Characteristic | Without Mortgage | With Mortgage |
| Housing Units | 1,757 | 2,699 |
| Median Property Value | $636,800 | $727,700 |
| Median Household Income | $89,526 | $1,122 |
| Monthly Housing Costs | $659 | $1,262 |
| Real Estate Taxes | $3,479 | $135 |
Property Value by Mortgage Status in Prunedale
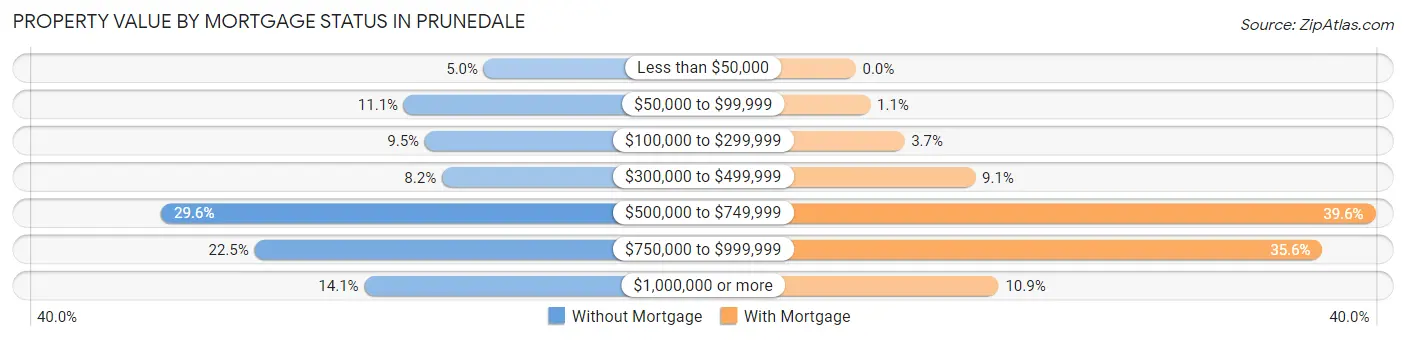
| Property Value | Without Mortgage | With Mortgage |
| Less than $50,000 | 88 (5.0%) | 0 (0.0%) |
| $50,000 to $99,999 | 195 (11.1%) | 30 (1.1%) |
| $100,000 to $299,999 | 167 (9.5%) | 100 (3.7%) |
| $300,000 to $499,999 | 144 (8.2%) | 246 (9.1%) |
| $500,000 to $749,999 | 520 (29.6%) | 1,069 (39.6%) |
| $750,000 to $999,999 | 395 (22.5%) | 960 (35.6%) |
| $1,000,000 or more | 248 (14.1%) | 294 (10.9%) |
| Total | 1,757 (100.0%) | 2,699 (100.0%) |
Household Income by Mortgage Status in Prunedale
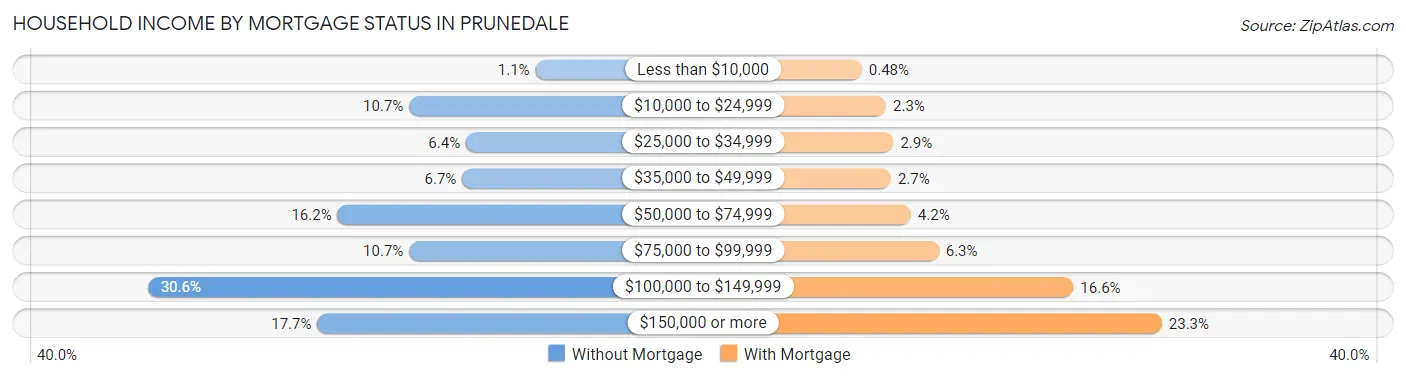
| Household Income | Without Mortgage | With Mortgage |
| Less than $10,000 | 19 (1.1%) | 13 (0.5%) |
| $10,000 to $24,999 | 188 (10.7%) | 63 (2.3%) |
| $25,000 to $34,999 | 112 (6.4%) | 78 (2.9%) |
| $35,000 to $49,999 | 117 (6.7%) | 73 (2.7%) |
| $50,000 to $74,999 | 284 (16.2%) | 114 (4.2%) |
| $75,000 to $99,999 | 188 (10.7%) | 171 (6.3%) |
| $100,000 to $149,999 | 538 (30.6%) | 448 (16.6%) |
| $150,000 or more | 311 (17.7%) | 630 (23.3%) |
| Total | 1,757 (100.0%) | 2,699 (100.0%) |
Property Value to Household Income Ratio in Prunedale
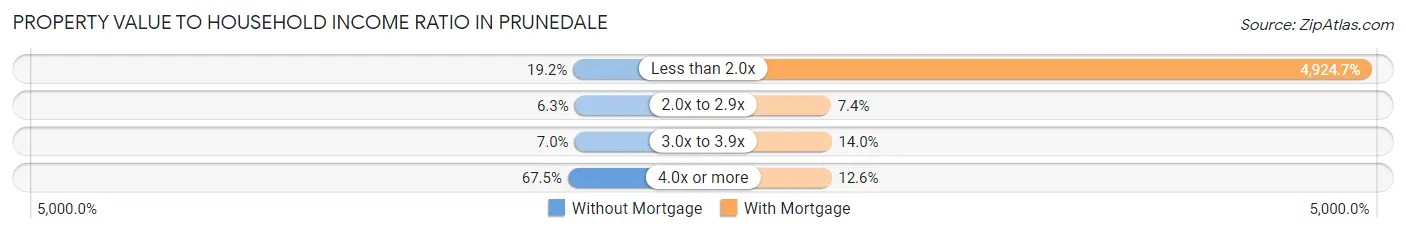
| Value-to-Income Ratio | Without Mortgage | With Mortgage |
| Less than 2.0x | 337 (19.2%) | 132,917 (4,924.7%) |
| 2.0x to 2.9x | 111 (6.3%) | 199 (7.4%) |
| 3.0x to 3.9x | 123 (7.0%) | 377 (14.0%) |
| 4.0x or more | 1,186 (67.5%) | 341 (12.6%) |
| Total | 1,757 (100.0%) | 2,699 (100.0%) |
Real Estate Taxes by Mortgage Status in Prunedale
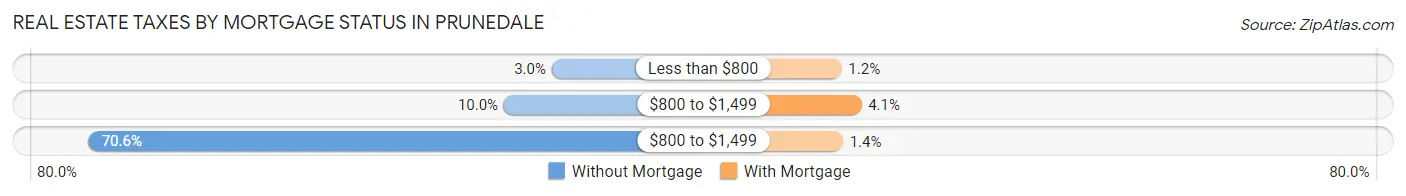
| Property Taxes | Without Mortgage | With Mortgage |
| Less than $800 | 52 (3.0%) | 33 (1.2%) |
| $800 to $1,499 | 175 (10.0%) | 111 (4.1%) |
| $800 to $1,499 | 1,241 (70.6%) | 38 (1.4%) |
| Total | 1,757 (100.0%) | 2,699 (100.0%) |
Health & Disability in Prunedale
Health Insurance Coverage by Age in Prunedale
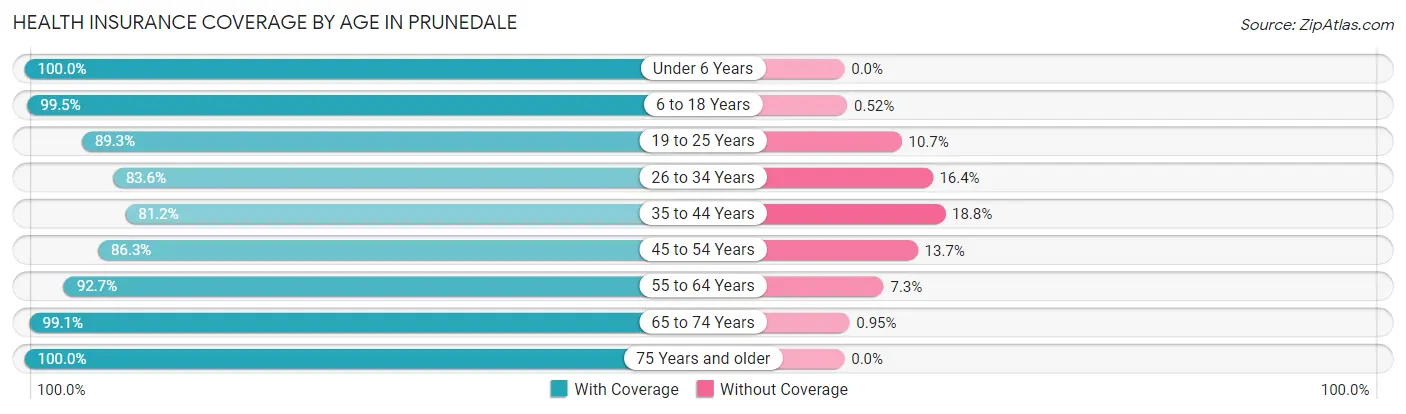
| Age Bracket | With Coverage | Without Coverage |
| Under 6 Years | 1,386 (100.0%) | 0 (0.0%) |
| 6 to 18 Years | 4,171 (99.5%) | 22 (0.5%) |
| 19 to 25 Years | 1,264 (89.3%) | 151 (10.7%) |
| 26 to 34 Years | 1,484 (83.6%) | 292 (16.4%) |
| 35 to 44 Years | 1,933 (81.2%) | 447 (18.8%) |
| 45 to 54 Years | 1,918 (86.3%) | 304 (13.7%) |
| 55 to 64 Years | 2,354 (92.7%) | 186 (7.3%) |
| 65 to 74 Years | 2,398 (99.1%) | 23 (0.9%) |
| 75 Years and older | 1,030 (100.0%) | 0 (0.0%) |
| Total | 17,938 (92.6%) | 1,425 (7.4%) |
Health Insurance Coverage by Citizenship Status in Prunedale
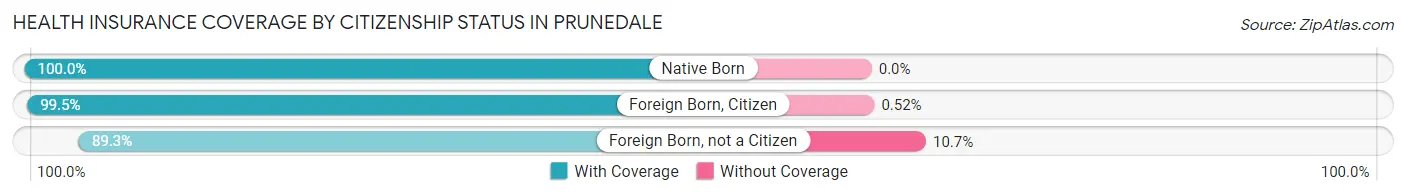
| Citizenship Status | With Coverage | Without Coverage |
| Native Born | 1,386 (100.0%) | 0 (0.0%) |
| Foreign Born, Citizen | 4,171 (99.5%) | 22 (0.5%) |
| Foreign Born, not a Citizen | 1,264 (89.3%) | 151 (10.7%) |
Health Insurance Coverage by Household Income in Prunedale
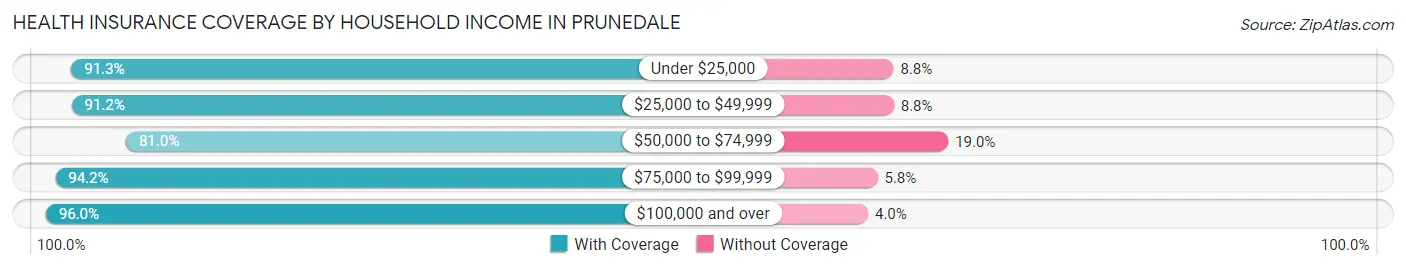
| Household Income | With Coverage | Without Coverage |
| Under $25,000 | 730 (91.2%) | 70 (8.7%) |
| $25,000 to $49,999 | 1,576 (91.2%) | 152 (8.8%) |
| $50,000 to $74,999 | 2,621 (81.0%) | 615 (19.0%) |
| $75,000 to $99,999 | 2,178 (94.2%) | 133 (5.8%) |
| $100,000 and over | 10,819 (96.0%) | 448 (4.0%) |
Public vs Private Health Insurance Coverage by Age in Prunedale
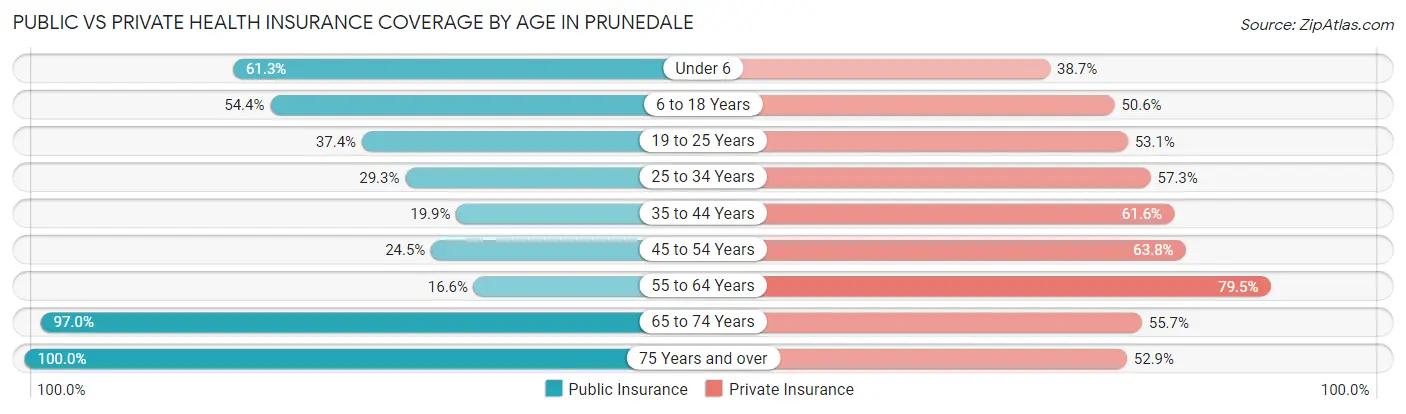
| Age Bracket | Public Insurance | Private Insurance |
| Under 6 | 850 (61.3%) | 536 (38.7%) |
| 6 to 18 Years | 2,281 (54.4%) | 2,122 (50.6%) |
| 19 to 25 Years | 529 (37.4%) | 751 (53.1%) |
| 25 to 34 Years | 521 (29.3%) | 1,018 (57.3%) |
| 35 to 44 Years | 473 (19.9%) | 1,467 (61.6%) |
| 45 to 54 Years | 545 (24.5%) | 1,417 (63.8%) |
| 55 to 64 Years | 422 (16.6%) | 2,020 (79.5%) |
| 65 to 74 Years | 2,349 (97.0%) | 1,348 (55.7%) |
| 75 Years and over | 1,030 (100.0%) | 545 (52.9%) |
| Total | 9,000 (46.5%) | 11,224 (58.0%) |
Disability Status by Sex by Age in Prunedale
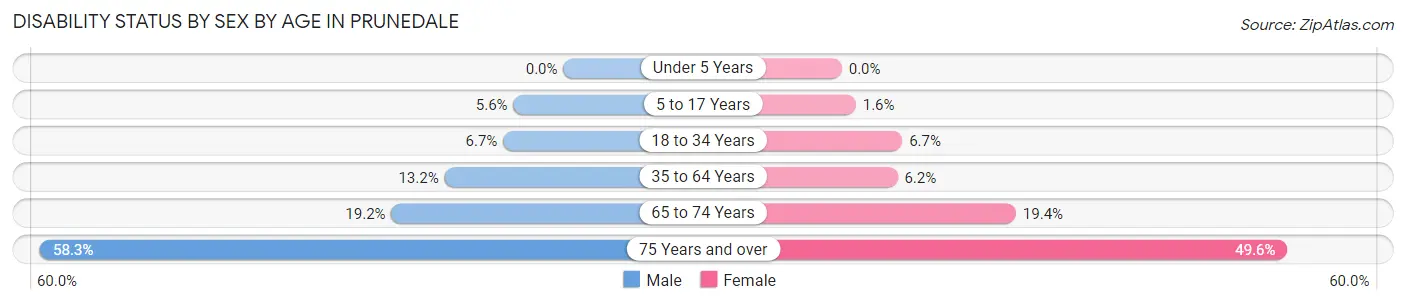
| Age Bracket | Male | Female |
| Under 5 Years | 0 (0.0%) | 0 (0.0%) |
| 5 to 17 Years | 101 (5.6%) | 36 (1.6%) |
| 18 to 34 Years | 103 (6.7%) | 135 (6.7%) |
| 35 to 64 Years | 508 (13.2%) | 205 (6.2%) |
| 65 to 74 Years | 189 (19.2%) | 278 (19.4%) |
| 75 Years and over | 296 (58.3%) | 259 (49.6%) |
Disability Class by Sex by Age in Prunedale
Disability Class: Hearing Difficulty
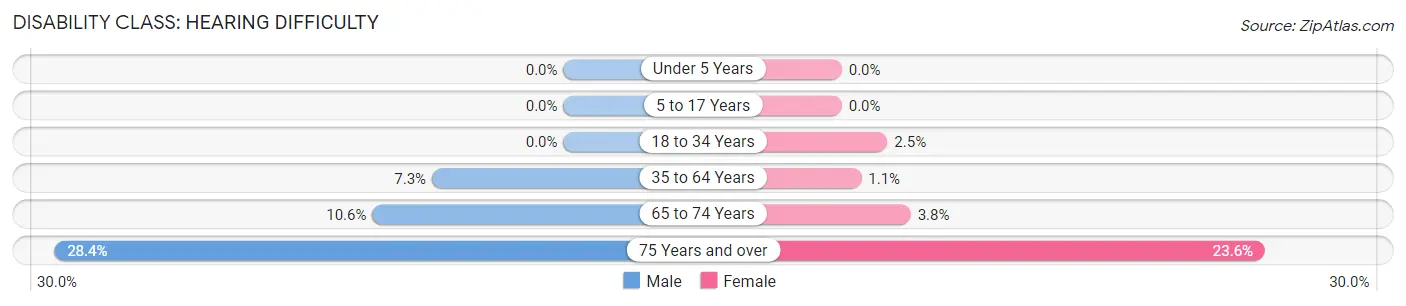
| Age Bracket | Male | Female |
| Under 5 Years | 0 (0.0%) | 0 (0.0%) |
| 5 to 17 Years | 0 (0.0%) | 0 (0.0%) |
| 18 to 34 Years | 0 (0.0%) | 51 (2.5%) |
| 35 to 64 Years | 281 (7.3%) | 36 (1.1%) |
| 65 to 74 Years | 105 (10.6%) | 55 (3.8%) |
| 75 Years and over | 144 (28.3%) | 123 (23.6%) |
Disability Class: Vision Difficulty
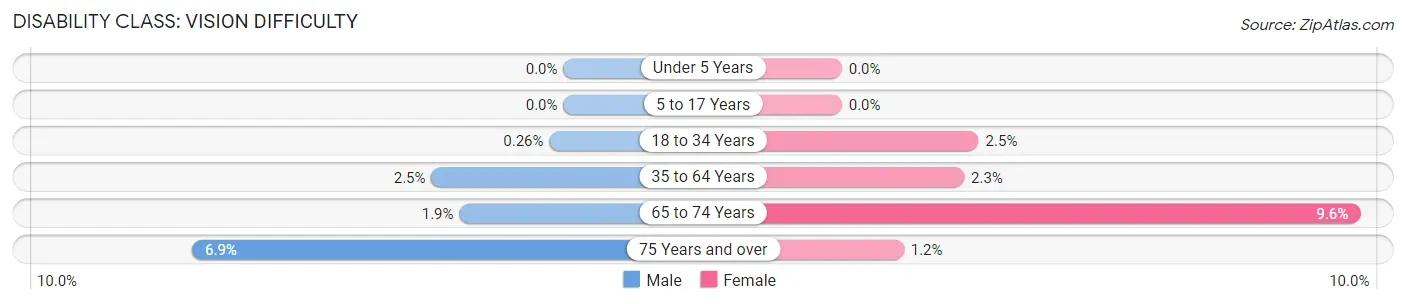
| Age Bracket | Male | Female |
| Under 5 Years | 0 (0.0%) | 0 (0.0%) |
| 5 to 17 Years | 0 (0.0%) | 0 (0.0%) |
| 18 to 34 Years | 4 (0.3%) | 51 (2.5%) |
| 35 to 64 Years | 94 (2.5%) | 75 (2.3%) |
| 65 to 74 Years | 19 (1.9%) | 138 (9.6%) |
| 75 Years and over | 35 (6.9%) | 6 (1.1%) |
Disability Class: Cognitive Difficulty
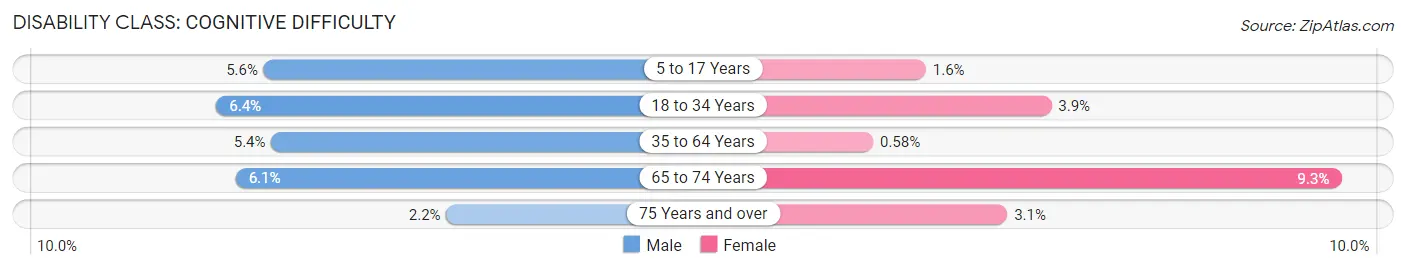
| Age Bracket | Male | Female |
| 5 to 17 Years | 101 (5.6%) | 36 (1.6%) |
| 18 to 34 Years | 99 (6.4%) | 78 (3.9%) |
| 35 to 64 Years | 208 (5.4%) | 19 (0.6%) |
| 65 to 74 Years | 60 (6.1%) | 133 (9.3%) |
| 75 Years and over | 11 (2.2%) | 16 (3.1%) |
Disability Class: Ambulatory Difficulty
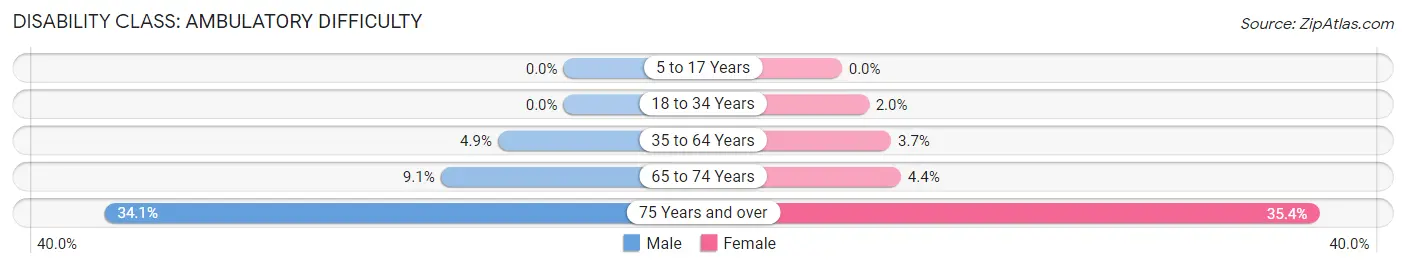
| Age Bracket | Male | Female |
| 5 to 17 Years | 0 (0.0%) | 0 (0.0%) |
| 18 to 34 Years | 0 (0.0%) | 40 (2.0%) |
| 35 to 64 Years | 187 (4.9%) | 121 (3.7%) |
| 65 to 74 Years | 90 (9.1%) | 63 (4.4%) |
| 75 Years and over | 173 (34.1%) | 185 (35.4%) |
Disability Class: Self-Care Difficulty
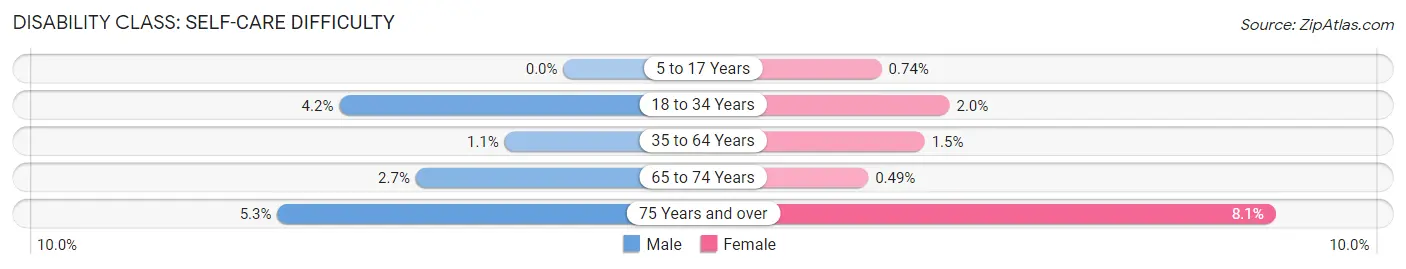
| Age Bracket | Male | Female |
| 5 to 17 Years | 0 (0.0%) | 17 (0.7%) |
| 18 to 34 Years | 64 (4.2%) | 40 (2.0%) |
| 35 to 64 Years | 42 (1.1%) | 51 (1.5%) |
| 65 to 74 Years | 27 (2.7%) | 7 (0.5%) |
| 75 Years and over | 27 (5.3%) | 42 (8.1%) |
Technology Access in Prunedale
Computing Device Access in Prunedale
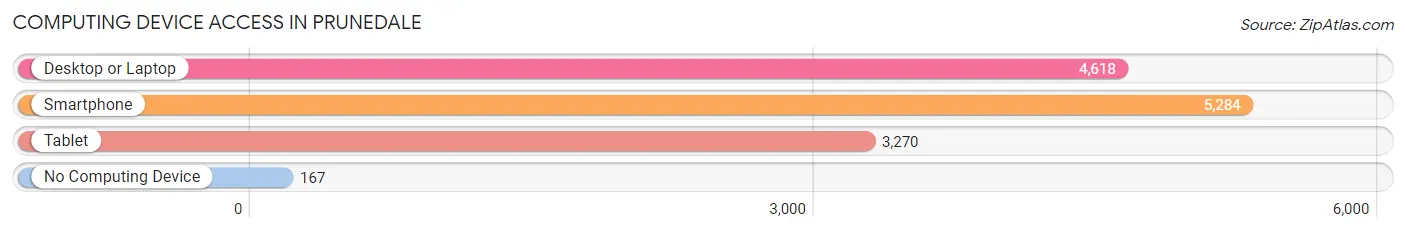
| Device Type | # Households | % Households |
| Desktop or Laptop | 4,618 | 82.6% |
| Smartphone | 5,284 | 94.5% |
| Tablet | 3,270 | 58.5% |
| No Computing Device | 167 | 3.0% |
| Total | 5,593 | 100.0% |
Internet Access in Prunedale
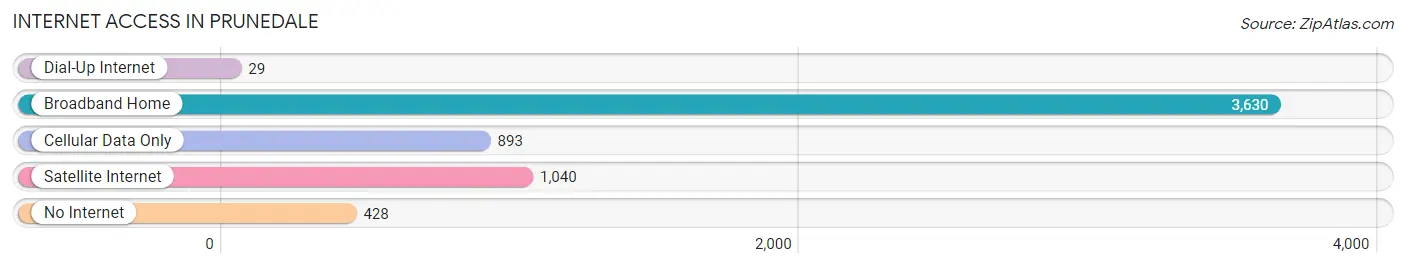
| Internet Type | # Households | % Households |
| Dial-Up Internet | 29 | 0.5% |
| Broadband Home | 3,630 | 64.9% |
| Cellular Data Only | 893 | 16.0% |
| Satellite Internet | 1,040 | 18.6% |
| No Internet | 428 | 7.6% |
| Total | 5,593 | 100.0% |
Prunedale Summary
Prunedale is an unincorporated community located in Monterey County, California, United States. It is situated in the Salinas Valley, approximately 8 miles north of Salinas and 8 miles south of Castroville. Prunedale is a rural community with a population of approximately 8,000 people.
History
Prunedale was originally inhabited by the Ohlone Indians, who lived in the area for thousands of years before the arrival of Europeans. The first Europeans to settle in the area were Spanish missionaries, who established the Mission San Antonio de Padua in 1771. The mission was abandoned in 1835, and the land was divided into large ranchos. In the late 19th century, the area was settled by farmers and ranchers, who grew crops such as wheat, barley, and oats.
In the early 20th century, the area was known as Prunedale, named after the prune orchards that were planted in the area. The first post office was established in Prunedale in 1915. In the 1950s, the area began to experience rapid growth as the population increased and new businesses were established.
Geography
Prunedale is located in the Salinas Valley, approximately 8 miles north of Salinas and 8 miles south of Castroville. The area is characterized by rolling hills and valleys, with the Santa Lucia Mountains to the west and the Gabilan Mountains to the east. Prunedale is located at an elevation of approximately 500 feet above sea level.
The climate in Prunedale is mild and temperate, with warm summers and cool winters. The average annual temperature is approximately 60°F, and the average annual precipitation is approximately 15 inches.
Economy
Prunedale is primarily a rural community, and the economy is largely based on agriculture. The area is known for its production of prunes, grapes, lettuce, and other crops. In addition, there are several small businesses in the area, including restaurants, gas stations, and convenience stores.
Demographics
As of the 2010 census, Prunedale had a population of 8,000 people. The racial makeup of the community was 75.3% White, 0.7% African American, 0.7% Native American, 0.7% Asian, 0.3% Pacific Islander, and 21.7% from other races. The median household income was $50,000, and the median family income was $54,000. The per capita income was $20,000.
Common Questions
What is Per Capita Income in Prunedale?
Per Capita income in Prunedale is $42,666.
What is the Median Family Income in Prunedale?
Median Family Income in Prunedale is $115,665.
What is the Median Household income in Prunedale?
Median Household Income in Prunedale is $106,150.
What is Income or Wage Gap in Prunedale?
Income or Wage Gap in Prunedale is 24.6%.
Women in Prunedale earn 75.4 cents for every dollar earned by a man.
What is Inequality or Gini Index in Prunedale?
Inequality or Gini Index in Prunedale is 0.47.
What is the Total Population of Prunedale?
Total Population of Prunedale is 19,372.
What is the Total Male Population of Prunedale?
Total Male Population of Prunedale is 9,303.
What is the Total Female Population of Prunedale?
Total Female Population of Prunedale is 10,069.
What is the Ratio of Males per 100 Females in Prunedale?
There are 92.39 Males per 100 Females in Prunedale.
What is the Ratio of Females per 100 Males in Prunedale?
There are 108.23 Females per 100 Males in Prunedale.
What is the Median Population Age in Prunedale?
Median Population Age in Prunedale is 39.1 Years.
What is the Average Family Size in Prunedale
Average Family Size in Prunedale is 3.7 People.
What is the Average Household Size in Prunedale
Average Household Size in Prunedale is 3.5 People.
How Large is the Labor Force in Prunedale?
There are 8,318 People in the Labor Forcein in Prunedale.
What is the Percentage of People in the Labor Force in Prunedale?
56.7% of People are in the Labor Force in Prunedale.
What is the Unemployment Rate in Prunedale?
Unemployment Rate in Prunedale is 6.6%.