Cities with the Highest Percentage of Hawaiian / Pacific Population in Illinois
RELATED REPORTS & OPTIONS
Hawaiian / Pacific
Illinois
Compare Cities
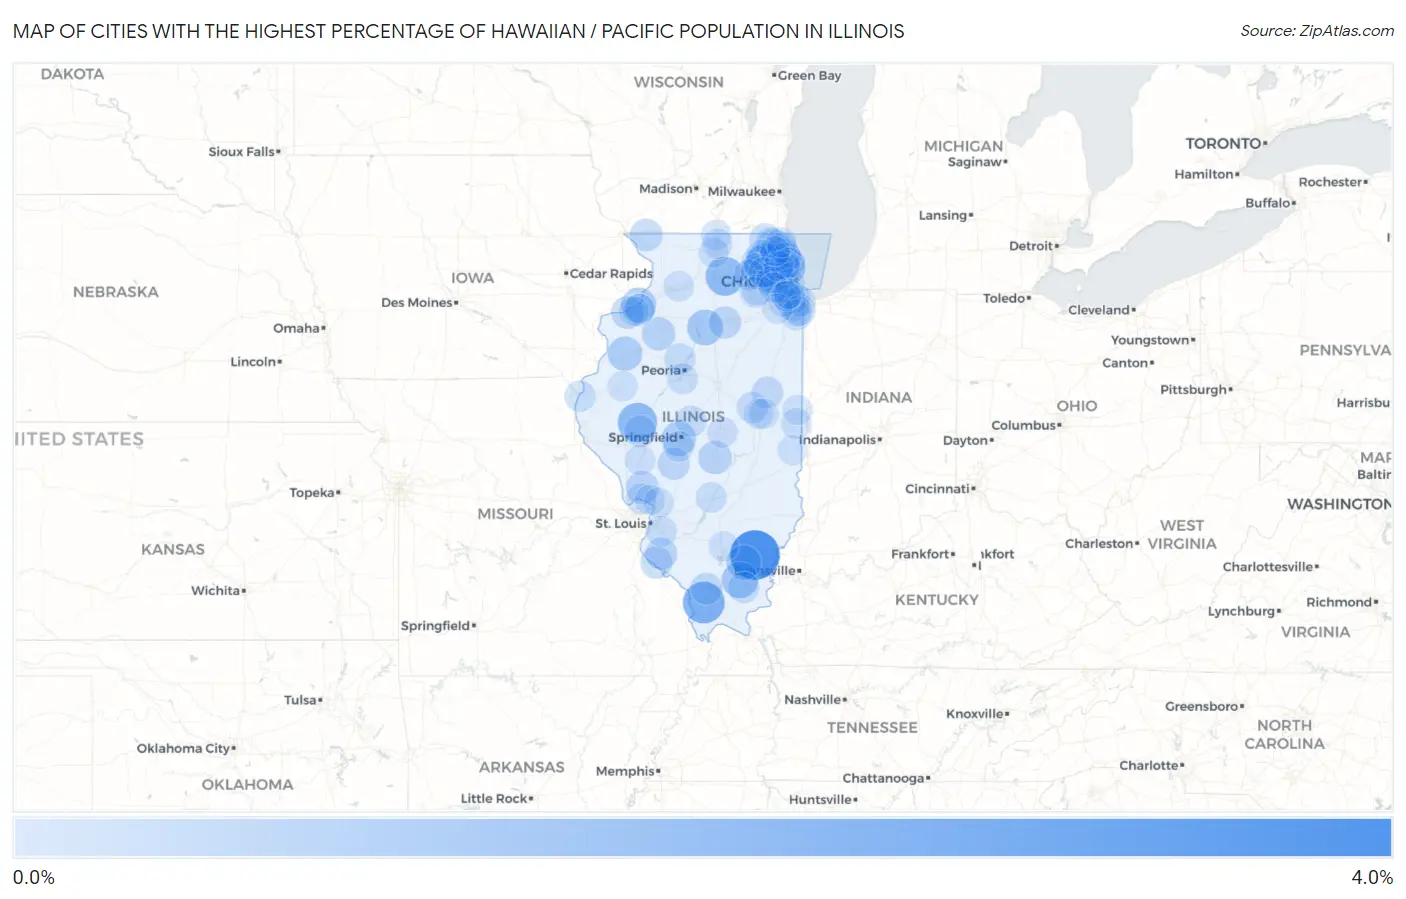
Map of Cities with the Highest Percentage of Hawaiian / Pacific Population in Illinois
0.0%
4.0%
Cities with the Highest Percentage of Hawaiian / Pacific Population in Illinois
| City | Hawaiian / Pacific | vs State | vs National | |
| 1. | Springerton | 3.6% | 0.043%(+3.57)#1 | 0.19%(+3.43)#257 |
| 2. | South Barrington | 2.3% | 0.043%(+2.28)#2 | 0.19%(+2.13)#381 |
| 3. | Cobden | 2.2% | 0.043%(+2.11)#3 | 0.19%(+1.96)#401 |
| 4. | Beardstown | 1.7% | 0.043%(+1.66)#4 | 0.19%(+1.51)#504 |
| 5. | Malta | 1.6% | 0.043%(+1.59)#5 | 0.19%(+1.44)#522 |
| 6. | Galatia | 1.1% | 0.043%(+1.10)#6 | 0.19%(+0.952)#677 |
| 7. | Golf | 1.1% | 0.043%(+1.06)#7 | 0.19%(+0.910)#695 |
| 8. | Bannockburn | 1.0% | 0.043%(+0.990)#8 | 0.19%(+0.844)#723 |
| 9. | Granville | 1.0% | 0.043%(+0.975)#9 | 0.19%(+0.829)#727 |
| 10. | Hampton | 0.87% | 0.043%(+0.830)#10 | 0.19%(+0.684)#832 |
| 11. | Mcleansboro | 0.86% | 0.043%(+0.816)#11 | 0.19%(+0.670)#842 |
| 12. | Leland Grove | 0.81% | 0.043%(+0.769)#12 | 0.19%(+0.623)#879 |
| 13. | Monmouth | 0.81% | 0.043%(+0.767)#13 | 0.19%(+0.621)#883 |
| 14. | Wood Dale | 0.68% | 0.043%(+0.633)#14 | 0.19%(+0.487)#1,034 |
| 15. | South Elgin | 0.60% | 0.043%(+0.553)#15 | 0.19%(+0.407)#1,123 |
| 16. | Assumption | 0.59% | 0.043%(+0.543)#16 | 0.19%(+0.397)#1,135 |
| 17. | Galva | 0.57% | 0.043%(+0.523)#17 | 0.19%(+0.377)#1,155 |
| 18. | Palatine | 0.49% | 0.043%(+0.445)#18 | 0.19%(+0.299)#1,275 |
| 19. | Jerseyville | 0.49% | 0.043%(+0.442)#19 | 0.19%(+0.297)#1,280 |
| 20. | Rock Island | 0.47% | 0.043%(+0.424)#20 | 0.19%(+0.278)#1,313 |
| 21. | Scales Mound | 0.46% | 0.043%(+0.418)#21 | 0.19%(+0.272)#1,321 |
| 22. | Grayslake | 0.46% | 0.043%(+0.414)#22 | 0.19%(+0.268)#1,327 |
| 23. | Naplate | 0.42% | 0.043%(+0.376)#23 | 0.19%(+0.231)#1,393 |
| 24. | Prairie Du Rocher | 0.40% | 0.043%(+0.362)#24 | 0.19%(+0.216)#1,428 |
| 25. | Girard | 0.40% | 0.043%(+0.359)#25 | 0.19%(+0.213)#1,438 |
| 26. | Red Bud | 0.39% | 0.043%(+0.352)#26 | 0.19%(+0.206)#1,454 |
| 27. | Silvis | 0.33% | 0.043%(+0.285)#27 | 0.19%(+0.139)#1,641 |
| 28. | Libertyville | 0.32% | 0.043%(+0.278)#28 | 0.19%(+0.132)#1,658 |
| 29. | Carbondale | 0.32% | 0.043%(+0.275)#29 | 0.19%(+0.129)#1,668 |
| 30. | Arenzville | 0.31% | 0.043%(+0.264)#30 | 0.19%(+0.118)#1,706 |
| 31. | Ludlow | 0.30% | 0.043%(+0.253)#31 | 0.19%(+0.107)#1,742 |
| 32. | Homewood | 0.29% | 0.043%(+0.249)#32 | 0.19%(+0.103)#1,756 |
| 33. | Blue Island | 0.28% | 0.043%(+0.240)#33 | 0.19%(+0.095)#1,791 |
| 34. | Bensenville | 0.27% | 0.043%(+0.230)#34 | 0.19%(+0.084)#1,836 |
| 35. | Lyons | 0.27% | 0.043%(+0.228)#35 | 0.19%(+0.083)#1,845 |
| 36. | Harrisburg | 0.25% | 0.043%(+0.208)#36 | 0.19%(+0.062)#1,929 |
| 37. | Mahomet | 0.24% | 0.043%(+0.198)#37 | 0.19%(+0.052)#1,964 |
| 38. | Carpentersville | 0.22% | 0.043%(+0.182)#38 | 0.19%(+0.036)#2,022 |
| 39. | Crestwood | 0.22% | 0.043%(+0.181)#39 | 0.19%(+0.035)#2,024 |
| 40. | Sauk Village | 0.22% | 0.043%(+0.180)#40 | 0.19%(+0.034)#2,026 |
| 41. | Dunlap | 0.21% | 0.043%(+0.169)#41 | 0.19%(+0.023)#2,082 |
| 42. | Elkhart | 0.20% | 0.043%(+0.162)#42 | 0.19%(+0.016)#2,105 |
| 43. | Fox Lake | 0.20% | 0.043%(+0.161)#43 | 0.19%(+0.015)#2,113 |
| 44. | Buffalo Grove | 0.20% | 0.043%(+0.160)#44 | 0.19%(+0.014)#2,117 |
| 45. | Warsaw | 0.20% | 0.043%(+0.152)#45 | 0.19%(+0.006)#2,155 |
| 46. | Pekin | 0.17% | 0.043%(+0.122)#46 | 0.19%(-0.023)#2,313 |
| 47. | Vandalia | 0.17% | 0.043%(+0.122)#47 | 0.19%(-0.024)#2,314 |
| 48. | Broadview | 0.16% | 0.043%(+0.120)#48 | 0.19%(-0.025)#2,325 |
| 49. | Elsah | 0.16% | 0.043%(+0.116)#49 | 0.19%(-0.030)#2,349 |
| 50. | Long Grove | 0.16% | 0.043%(+0.114)#50 | 0.19%(-0.032)#2,360 |
| 51. | Hinsdale | 0.15% | 0.043%(+0.109)#51 | 0.19%(-0.037)#2,394 |
| 52. | Belleville | 0.15% | 0.043%(+0.107)#52 | 0.19%(-0.039)#2,406 |
| 53. | Elgin | 0.15% | 0.043%(+0.103)#53 | 0.19%(-0.042)#2,423 |
| 54. | Lily Lake | 0.14% | 0.043%(+0.101)#54 | 0.19%(-0.045)#2,438 |
| 55. | Carol Stream | 0.14% | 0.043%(+0.101)#55 | 0.19%(-0.045)#2,439 |
| 56. | Calumet City | 0.14% | 0.043%(+0.100)#56 | 0.19%(-0.046)#2,445 |
| 57. | Chatham | 0.14% | 0.043%(+0.096)#57 | 0.19%(-0.050)#2,476 |
| 58. | Crete | 0.13% | 0.043%(+0.088)#58 | 0.19%(-0.058)#2,519 |
| 59. | Georgetown | 0.13% | 0.043%(+0.084)#59 | 0.19%(-0.061)#2,546 |
| 60. | Aurora | 0.12% | 0.043%(+0.074)#60 | 0.19%(-0.071)#2,617 |
| 61. | Orland Park | 0.12% | 0.043%(+0.074)#61 | 0.19%(-0.072)#2,624 |
| 62. | Montgomery | 0.12% | 0.043%(+0.073)#62 | 0.19%(-0.072)#2,627 |
| 63. | Glendale Heights | 0.11% | 0.043%(+0.063)#63 | 0.19%(-0.083)#2,695 |
| 64. | Urbana | 0.10% | 0.043%(+0.058)#64 | 0.19%(-0.088)#2,732 |
| 65. | Decatur | 0.097% | 0.043%(+0.054)#65 | 0.19%(-0.092)#2,757 |
| 66. | Sterling | 0.094% | 0.043%(+0.051)#66 | 0.19%(-0.094)#2,790 |
| 67. | Round Lake Beach | 0.092% | 0.043%(+0.049)#67 | 0.19%(-0.097)#2,806 |
| 68. | Skokie | 0.089% | 0.043%(+0.047)#68 | 0.19%(-0.099)#2,819 |
| 69. | Highland Park | 0.089% | 0.043%(+0.046)#69 | 0.19%(-0.099)#2,822 |
| 70. | South Beloit | 0.088% | 0.043%(+0.045)#70 | 0.19%(-0.101)#2,833 |
| 71. | Cary | 0.067% | 0.043%(+0.024)#71 | 0.19%(-0.122)#3,028 |
| 72. | Niles | 0.065% | 0.043%(+0.022)#72 | 0.19%(-0.123)#3,041 |
| 73. | Bartlett | 0.064% | 0.043%(+0.021)#73 | 0.19%(-0.125)#3,059 |
| 74. | North Chicago | 0.062% | 0.043%(+0.019)#74 | 0.19%(-0.127)#3,083 |
| 75. | Roodhouse | 0.061% | 0.043%(+0.018)#75 | 0.19%(-0.128)#3,086 |
| 76. | Rockford | 0.057% | 0.043%(+0.014)#76 | 0.19%(-0.132)#3,137 |
| 77. | Worth | 0.055% | 0.043%(+0.012)#77 | 0.19%(-0.133)#3,154 |
| 78. | Chicago | 0.052% | 0.043%(+0.009)#78 | 0.19%(-0.137)#3,184 |
| 79. | Cahokia Heights | 0.051% | 0.043%(+0.008)#79 | 0.19%(-0.138)#3,194 |
| 80. | Godfrey | 0.051% | 0.043%(+0.008)#80 | 0.19%(-0.138)#3,196 |
| 81. | Glen Ellyn | 0.049% | 0.043%(+0.007)#81 | 0.19%(-0.139)#3,211 |
| 82. | Machesney Park | 0.048% | 0.043%(+0.005)#82 | 0.19%(-0.141)#3,227 |
| 83. | Macomb | 0.046% | 0.043%(+0.003)#83 | 0.19%(-0.143)#3,249 |
| 84. | Bethalto | 0.043% | 0.043%(+0.000)#84 | 0.19%(-0.146)#3,284 |
| 85. | Steger | 0.042% | 0.043%(-0.001)#85 | 0.19%(-0.147)#3,302 |
| 86. | Mount Vernon | 0.041% | 0.043%(-0.002)#86 | 0.19%(-0.148)#3,315 |
| 87. | Winnetka | 0.040% | 0.043%(-0.003)#87 | 0.19%(-0.149)#3,325 |
| 88. | East Moline | 0.038% | 0.043%(-0.005)#88 | 0.19%(-0.151)#3,337 |
| 89. | Glenview | 0.031% | 0.043%(-0.012)#89 | 0.19%(-0.157)#3,422 |
| 90. | Danville | 0.031% | 0.043%(-0.012)#90 | 0.19%(-0.158)#3,429 |
| 91. | Mount Prospect | 0.030% | 0.043%(-0.013)#91 | 0.19%(-0.158)#3,442 |
| 92. | Champaign | 0.028% | 0.043%(-0.015)#92 | 0.19%(-0.161)#3,468 |
| 93. | Downers Grove | 0.028% | 0.043%(-0.015)#93 | 0.19%(-0.161)#3,475 |
| 94. | Waukegan | 0.027% | 0.043%(-0.016)#94 | 0.19%(-0.162)#3,492 |
| 95. | Moline | 0.026% | 0.043%(-0.017)#95 | 0.19%(-0.163)#3,506 |
| 96. | New Lenox | 0.026% | 0.043%(-0.017)#96 | 0.19%(-0.163)#3,509 |
| 97. | Mundelein | 0.025% | 0.043%(-0.018)#97 | 0.19%(-0.163)#3,515 |
| 98. | Palos Heights | 0.025% | 0.043%(-0.018)#98 | 0.19%(-0.164)#3,518 |
| 99. | Oak Lawn | 0.024% | 0.043%(-0.019)#99 | 0.19%(-0.164)#3,529 |
| 100. | Paris | 0.024% | 0.043%(-0.019)#100 | 0.19%(-0.165)#3,537 |
Common Questions
What are the Top 10 Cities with the Highest Percentage of Hawaiian / Pacific Population in Illinois?
Top 10 Cities with the Highest Percentage of Hawaiian / Pacific Population in Illinois are:
#1
3.6%
#2
2.3%
#3
2.2%
#4
1.7%
#5
1.6%
#6
1.1%
#7
1.1%
#8
1.0%
#9
1.0%
#10
0.87%
What city has the Highest Percentage of Hawaiian / Pacific Population in Illinois?
Springerton has the Highest Percentage of Hawaiian / Pacific Population in Illinois with 3.6%.
What is the Percentage of Hawaiian / Pacific Population in the State of Illinois?
Percentage of Hawaiian / Pacific Population in Illinois is 0.043%.
What is the Percentage of Hawaiian / Pacific Population in the United States?
Percentage of Hawaiian / Pacific Population in the United States is 0.19%.