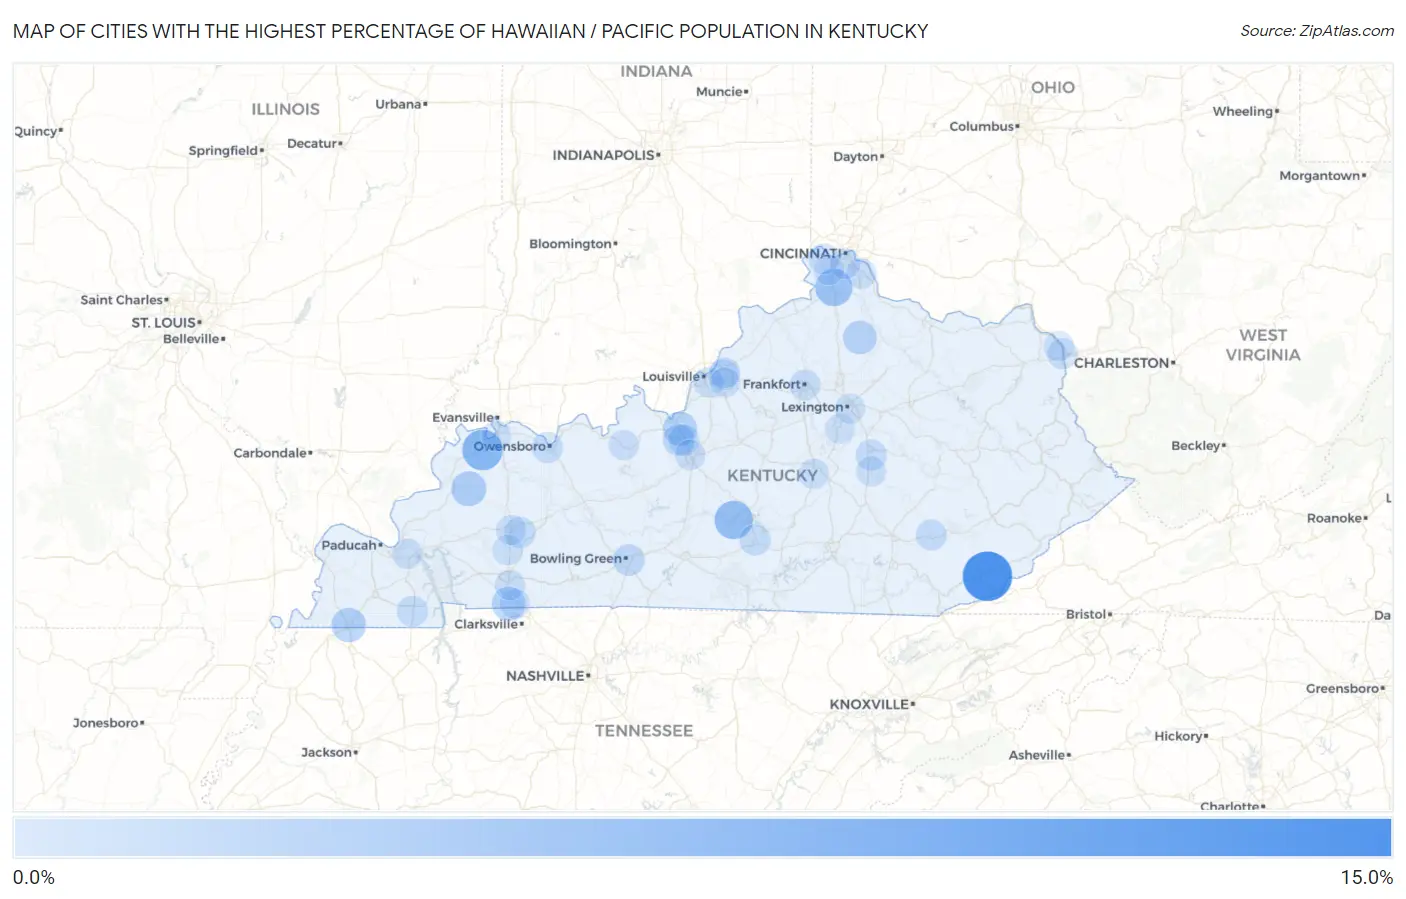
Cities with the Highest Percentage of Hawaiian / Pacific Population in Kentucky
RELATED REPORTS & OPTIONS
Hawaiian / Pacific
Kentucky
Compare Cities
Map of Cities with the Highest Percentage of Hawaiian / Pacific Population in Kentucky
0.0%
15.0%

Cities with the Highest Percentage of Hawaiian / Pacific Population in Kentucky
| City | Hawaiian / Pacific | vs State | vs National | |
| 1. | Coxton | 10.5% | 0.085%(+10.4)#1 | 0.19%(+10.3)#87 |
| 2. | Corydon | 5.4% | 0.085%(+5.34)#2 | 0.19%(+5.24)#176 |
| 3. | Greensburg | 4.3% | 0.085%(+4.21)#3 | 0.19%(+4.10)#221 |
| 4. | Walton | 3.7% | 0.085%(+3.61)#4 | 0.19%(+3.51)#254 |
| 5. | Clay | 2.5% | 0.085%(+2.42)#5 | 0.19%(+2.31)#353 |
| 6. | Fulton | 2.2% | 0.085%(+2.14)#6 | 0.19%(+2.04)#393 |
| 7. | Fort Knox | 2.0% | 0.085%(+1.91)#7 | 0.19%(+1.81)#430 |
| 8. | Fort Campbell North | 1.9% | 0.085%(+1.85)#8 | 0.19%(+1.74)#446 |
| 9. | Berry | 1.8% | 0.085%(+1.74)#9 | 0.19%(+1.64)#468 |
| 10. | Bowling Green | 0.88% | 0.085%(+0.800)#10 | 0.19%(+0.695)#822 |
| 11. | Vine Grove | 0.83% | 0.085%(+0.747)#11 | 0.19%(+0.643)#858 |
| 12. | White Plains | 0.59% | 0.085%(+0.510)#12 | 0.19%(+0.406)#1,125 |
| 13. | Richmond | 0.57% | 0.085%(+0.489)#13 | 0.19%(+0.385)#1,145 |
| 14. | Murray | 0.54% | 0.085%(+0.455)#14 | 0.19%(+0.351)#1,190 |
| 15. | Radcliff | 0.53% | 0.085%(+0.442)#15 | 0.19%(+0.338)#1,213 |
| 16. | Owensboro | 0.50% | 0.085%(+0.415)#16 | 0.19%(+0.311)#1,250 |
| 17. | Columbia | 0.50% | 0.085%(+0.414)#17 | 0.19%(+0.310)#1,252 |
| 18. | Manchester | 0.46% | 0.085%(+0.371)#18 | 0.19%(+0.267)#1,328 |
| 19. | Frankfort | 0.40% | 0.085%(+0.320)#19 | 0.19%(+0.215)#1,429 |
| 20. | Catlettsburg | 0.28% | 0.085%(+0.196)#20 | 0.19%(+0.092)#1,800 |
| 21. | Lyndon | 0.25% | 0.085%(+0.161)#21 | 0.19%(+0.057)#1,943 |
| 22. | Hebron | 0.20% | 0.085%(+0.112)#22 | 0.19%(+0.008)#2,148 |
| 23. | Oak Grove | 0.19% | 0.085%(+0.105)#23 | 0.19%(+0.001)#2,179 |
| 24. | Crofton | 0.19% | 0.085%(+0.105)#24 | 0.19%(+0.000)#2,181 |
| 25. | Hardinsburg | 0.16% | 0.085%(+0.077)#25 | 0.19%(-0.027)#2,337 |
| 26. | Alexandria | 0.16% | 0.085%(+0.071)#26 | 0.19%(-0.034)#2,373 |
| 27. | Elizabethtown | 0.14% | 0.085%(+0.059)#27 | 0.19%(-0.046)#2,443 |
| 28. | Junction City | 0.14% | 0.085%(+0.054)#28 | 0.19%(-0.050)#2,477 |
| 29. | Covington | 0.13% | 0.085%(+0.050)#29 | 0.19%(-0.054)#2,495 |
| 30. | Calvert City | 0.12% | 0.085%(+0.034)#30 | 0.19%(-0.070)#2,601 |
| 31. | Nortonville | 0.11% | 0.085%(+0.029)#31 | 0.19%(-0.075)#2,643 |
| 32. | Meadow Vale | 0.11% | 0.085%(+0.024)#32 | 0.19%(-0.080)#2,681 |
| 33. | Hopkinsville | 0.093% | 0.085%(+0.009)#33 | 0.19%(-0.095)#2,793 |
| 34. | Berea | 0.078% | 0.085%(-0.007)#34 | 0.19%(-0.111)#2,917 |
| 35. | Louisville | 0.054% | 0.085%(-0.030)#35 | 0.19%(-0.135)#3,165 |
| 36. | Jeffersontown | 0.021% | 0.085%(-0.064)#36 | 0.19%(-0.168)#3,579 |
| 37. | Nicholasville | 0.019% | 0.085%(-0.065)#37 | 0.19%(-0.170)#3,603 |
| 38. | Lexington | 0.015% | 0.085%(-0.069)#38 | 0.19%(-0.173)#3,653 |
| 39. | Henderson | 0.014% | 0.085%(-0.070)#39 | 0.19%(-0.175)#3,666 |
| 40. | Ashland | 0.014% | 0.085%(-0.071)#40 | 0.19%(-0.175)#3,669 |
| 41. | Florence | 0.0031% | 0.085%(-0.081)#41 | 0.19%(-0.186)#3,793 |
Common Questions
What are the Top 10 Cities with the Highest Percentage of Hawaiian / Pacific Population in Kentucky?
Top 10 Cities with the Highest Percentage of Hawaiian / Pacific Population in Kentucky are:
#1
10.5%
#2
5.4%
#3
4.3%
#4
3.7%
#5
2.5%
#6
2.2%
#7
2.0%
#8
1.9%
#9
1.8%
#10
0.88%
What city has the Highest Percentage of Hawaiian / Pacific Population in Kentucky?
Coxton has the Highest Percentage of Hawaiian / Pacific Population in Kentucky with 10.5%.
What is the Percentage of Hawaiian / Pacific Population in the State of Kentucky?
Percentage of Hawaiian / Pacific Population in Kentucky is 0.085%.
What is the Percentage of Hawaiian / Pacific Population in the United States?
Percentage of Hawaiian / Pacific Population in the United States is 0.19%.