Cities with the Highest Percentage of Hawaiian / Pacific Population in Michigan
RELATED REPORTS & OPTIONS
Hawaiian / Pacific
Michigan
Compare Cities
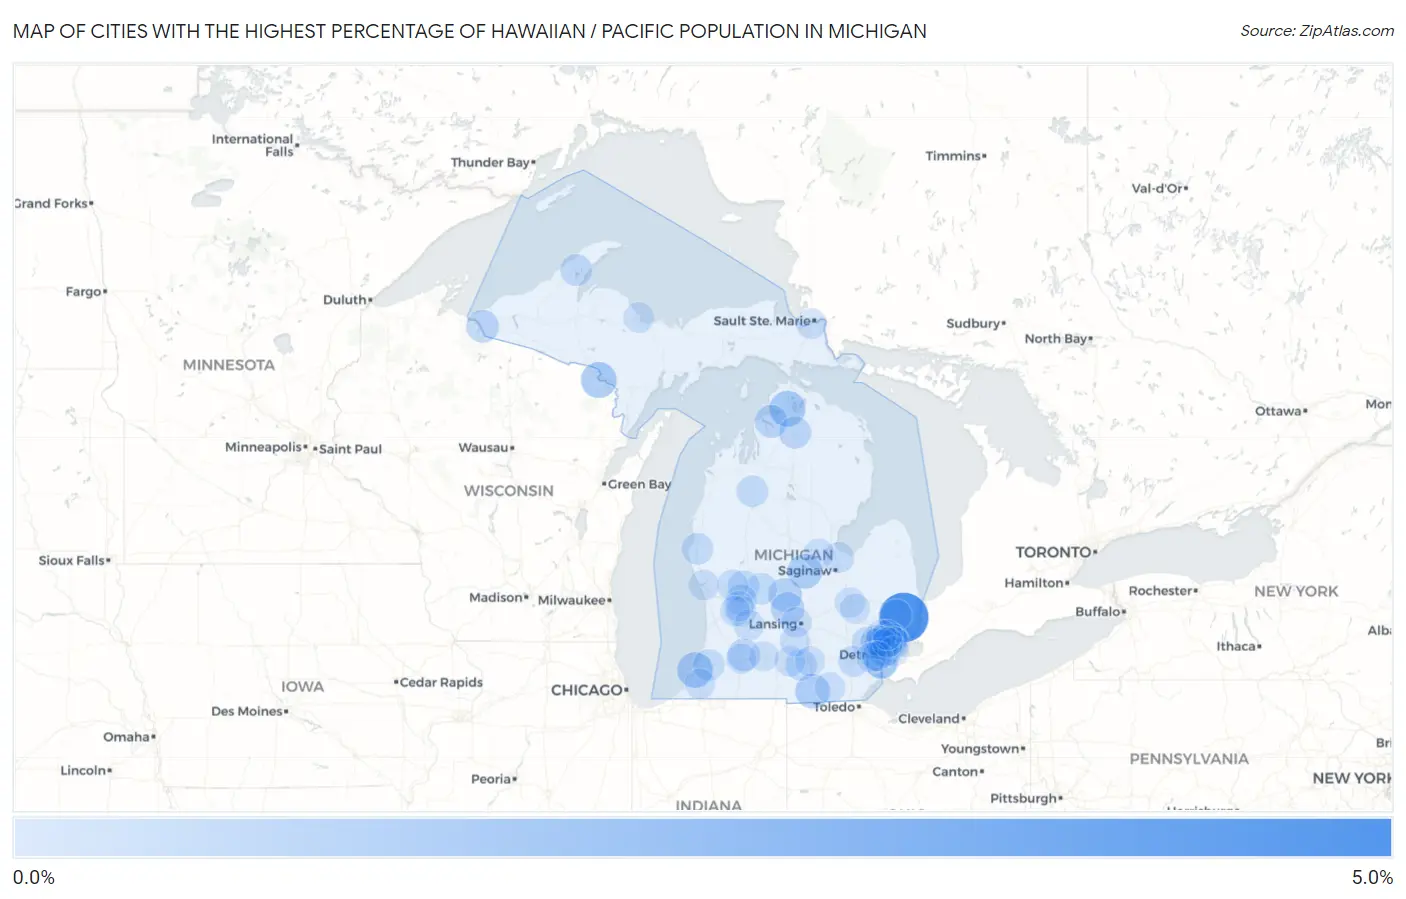
Map of Cities with the Highest Percentage of Hawaiian / Pacific Population in Michigan
0.0%
5.0%
Cities with the Highest Percentage of Hawaiian / Pacific Population in Michigan
| City | Hawaiian / Pacific | vs State | vs National | |
| 1. | Richmond | 4.2% | 0.028%(+4.12)#1 | 0.19%(+3.96)#231 |
| 2. | Alanson | 1.2% | 0.028%(+1.13)#2 | 0.19%(+0.971)#667 |
| 3. | Kingsford | 1.2% | 0.028%(+1.12)#3 | 0.19%(+0.962)#669 |
| 4. | Benton Heights | 1.1% | 0.028%(+1.06)#4 | 0.19%(+0.901)#701 |
| 5. | Breckenridge | 0.92% | 0.028%(+0.892)#5 | 0.19%(+0.731)#794 |
| 6. | Hudson | 0.89% | 0.028%(+0.859)#6 | 0.19%(+0.698)#818 |
| 7. | Ecorse | 0.79% | 0.028%(+0.758)#7 | 0.19%(+0.597)#907 |
| 8. | Hubbardston | 0.72% | 0.028%(+0.688)#8 | 0.19%(+0.527)#979 |
| 9. | Westphalia | 0.63% | 0.028%(+0.603)#9 | 0.19%(+0.442)#1,079 |
| 10. | Ironwood | 0.53% | 0.028%(+0.503)#10 | 0.19%(+0.342)#1,205 |
| 11. | Horton Bay | 0.53% | 0.028%(+0.500)#11 | 0.19%(+0.339)#1,211 |
| 12. | Parchment | 0.49% | 0.028%(+0.462)#12 | 0.19%(+0.301)#1,269 |
| 13. | Vanderbilt | 0.40% | 0.028%(+0.376)#13 | 0.19%(+0.215)#1,430 |
| 14. | Dollar Bay | 0.34% | 0.028%(+0.310)#14 | 0.19%(+0.149)#1,621 |
| 15. | Hamtramck | 0.33% | 0.028%(+0.306)#15 | 0.19%(+0.145)#1,632 |
| 16. | Manton | 0.30% | 0.028%(+0.275)#16 | 0.19%(+0.114)#1,719 |
| 17. | Farmington Hills | 0.30% | 0.028%(+0.268)#17 | 0.19%(+0.107)#1,744 |
| 18. | Armada | 0.29% | 0.028%(+0.267)#18 | 0.19%(+0.106)#1,748 |
| 19. | Greenville | 0.29% | 0.028%(+0.266)#19 | 0.19%(+0.105)#1,750 |
| 20. | Hart | 0.28% | 0.028%(+0.248)#20 | 0.19%(+0.087)#1,829 |
| 21. | Cedar Springs | 0.27% | 0.028%(+0.247)#21 | 0.19%(+0.086)#1,834 |
| 22. | Hartford | 0.27% | 0.028%(+0.245)#22 | 0.19%(+0.084)#1,840 |
| 23. | Spring Arbor | 0.25% | 0.028%(+0.221)#23 | 0.19%(+0.060)#1,932 |
| 24. | Ypsilanti | 0.23% | 0.028%(+0.200)#24 | 0.19%(+0.039)#2,011 |
| 25. | Northview | 0.19% | 0.028%(+0.167)#25 | 0.19%(+0.006)#2,159 |
| 26. | Bay City | 0.17% | 0.028%(+0.141)#26 | 0.19%(-0.020)#2,289 |
| 27. | Kent City | 0.15% | 0.028%(+0.117)#27 | 0.19%(-0.044)#2,431 |
| 28. | Ferndale | 0.12% | 0.028%(+0.097)#28 | 0.19%(-0.064)#2,559 |
| 29. | Pleasant Ridge | 0.11% | 0.028%(+0.087)#29 | 0.19%(-0.074)#2,635 |
| 30. | Center Line | 0.11% | 0.028%(+0.078)#30 | 0.19%(-0.083)#2,691 |
| 31. | Albion | 0.10% | 0.028%(+0.076)#31 | 0.19%(-0.085)#2,712 |
| 32. | Oak Park | 0.10% | 0.028%(+0.074)#32 | 0.19%(-0.087)#2,727 |
| 33. | Kentwood | 0.089% | 0.028%(+0.061)#33 | 0.19%(-0.100)#2,827 |
| 34. | Muskegon | 0.089% | 0.028%(+0.061)#34 | 0.19%(-0.100)#2,828 |
| 35. | Marquette | 0.087% | 0.028%(+0.059)#35 | 0.19%(-0.102)#2,842 |
| 36. | Sault Ste Marie | 0.082% | 0.028%(+0.054)#36 | 0.19%(-0.107)#2,881 |
| 37. | Eaton Rapids | 0.077% | 0.028%(+0.049)#37 | 0.19%(-0.112)#2,926 |
| 38. | Middleville | 0.070% | 0.028%(+0.043)#38 | 0.19%(-0.118)#2,983 |
| 39. | Madison Heights | 0.070% | 0.028%(+0.042)#39 | 0.19%(-0.119)#2,989 |
| 40. | Waverly | 0.067% | 0.028%(+0.040)#40 | 0.19%(-0.121)#3,022 |
| 41. | Wyandotte | 0.064% | 0.028%(+0.037)#41 | 0.19%(-0.124)#3,053 |
| 42. | Adrian | 0.058% | 0.028%(+0.031)#42 | 0.19%(-0.130)#3,121 |
| 43. | Midland | 0.057% | 0.028%(+0.029)#43 | 0.19%(-0.132)#3,138 |
| 44. | Roseville | 0.051% | 0.028%(+0.023)#44 | 0.19%(-0.138)#3,197 |
| 45. | Berrien Springs | 0.049% | 0.028%(+0.022)#45 | 0.19%(-0.139)#3,212 |
| 46. | Fraser | 0.048% | 0.028%(+0.020)#46 | 0.19%(-0.141)#3,231 |
| 47. | Beverly Hills | 0.047% | 0.028%(+0.020)#47 | 0.19%(-0.141)#3,234 |
| 48. | Hazel Park | 0.046% | 0.028%(+0.019)#48 | 0.19%(-0.142)#3,244 |
| 49. | Southfield | 0.045% | 0.028%(+0.017)#49 | 0.19%(-0.144)#3,269 |
| 50. | Flint | 0.043% | 0.028%(+0.015)#50 | 0.19%(-0.146)#3,290 |
| 51. | Kalamazoo | 0.038% | 0.028%(+0.011)#51 | 0.19%(-0.151)#3,338 |
| 52. | Grand Rapids | 0.033% | 0.028%(+0.005)#52 | 0.19%(-0.156)#3,405 |
| 53. | St Clair Shores | 0.032% | 0.028%(+0.005)#53 | 0.19%(-0.156)#3,412 |
| 54. | Jackson | 0.022% | 0.028%(-0.005)#54 | 0.19%(-0.166)#3,559 |
| 55. | Royal Oak | 0.021% | 0.028%(-0.007)#55 | 0.19%(-0.168)#3,581 |
| 56. | Wyoming | 0.020% | 0.028%(-0.008)#56 | 0.19%(-0.169)#3,599 |
| 57. | Dearborn Heights | 0.018% | 0.028%(-0.010)#57 | 0.19%(-0.171)#3,626 |
| 58. | Detroit | 0.015% | 0.028%(-0.013)#58 | 0.19%(-0.174)#3,660 |
| 59. | Grand Blanc | 0.012% | 0.028%(-0.015)#59 | 0.19%(-0.176)#3,685 |
| 60. | Troy | 0.011% | 0.028%(-0.016)#60 | 0.19%(-0.177)#3,701 |
| 61. | Grosse Pointe Park | 0.0087% | 0.028%(-0.019)#61 | 0.19%(-0.180)#3,726 |
| 62. | Warren | 0.0087% | 0.028%(-0.019)#62 | 0.19%(-0.180)#3,727 |
| 63. | Inkster | 0.0077% | 0.028%(-0.020)#63 | 0.19%(-0.181)#3,742 |
| 64. | Sterling Heights | 0.0067% | 0.028%(-0.021)#64 | 0.19%(-0.182)#3,753 |
| 65. | Dearborn | 0.0046% | 0.028%(-0.023)#65 | 0.19%(-0.184)#3,774 |
| 66. | Battle Creek | 0.0019% | 0.028%(-0.026)#66 | 0.19%(-0.187)#3,800 |
Common Questions
What are the Top 10 Cities with the Highest Percentage of Hawaiian / Pacific Population in Michigan?
Top 10 Cities with the Highest Percentage of Hawaiian / Pacific Population in Michigan are:
#1
4.2%
#2
1.2%
#3
1.2%
#4
1.1%
#5
0.92%
#6
0.89%
#7
0.79%
#8
0.72%
#9
0.63%
#10
0.53%
What city has the Highest Percentage of Hawaiian / Pacific Population in Michigan?
Richmond has the Highest Percentage of Hawaiian / Pacific Population in Michigan with 4.2%.
What is the Percentage of Hawaiian / Pacific Population in the State of Michigan?
Percentage of Hawaiian / Pacific Population in Michigan is 0.028%.
What is the Percentage of Hawaiian / Pacific Population in the United States?
Percentage of Hawaiian / Pacific Population in the United States is 0.19%.