Cities with the Highest Percentage of Hawaiian / Pacific Population in New Mexico
RELATED REPORTS & OPTIONS
Hawaiian / Pacific
New Mexico
Compare Cities
Map of Cities with the Highest Percentage of Hawaiian / Pacific Population in New Mexico
0.0%
20.0%
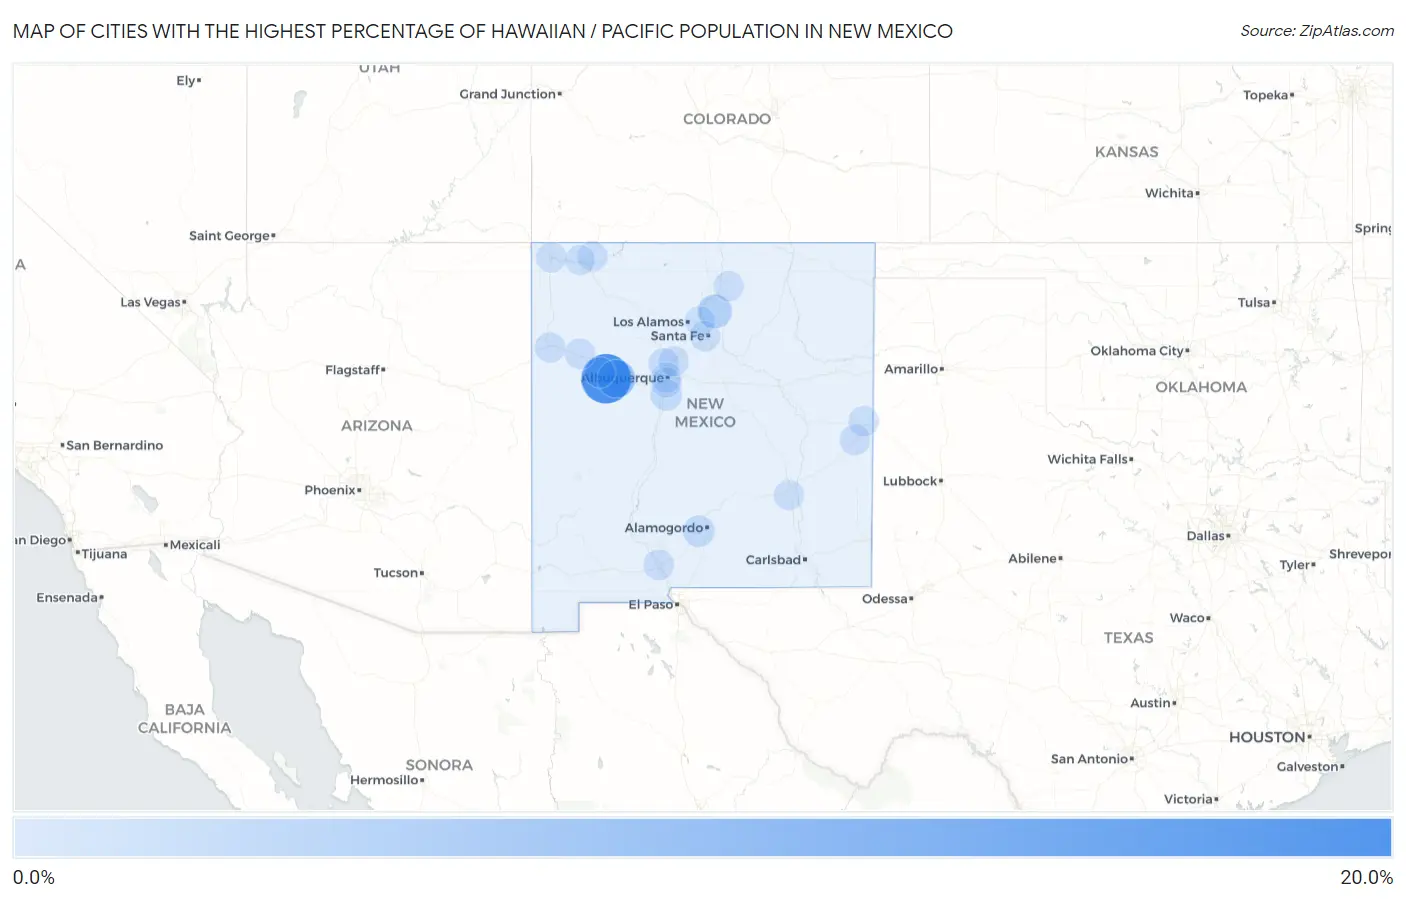
Cities with the Highest Percentage of Hawaiian / Pacific Population in New Mexico
| City | Hawaiian / Pacific | vs State | vs National | |
| 1. | Anzac Village | 15.8% | 0.088%(+15.7)#1 | 0.19%(+15.6)#52 |
| 2. | North Acomita Village | 6.1% | 0.088%(+6.03)#2 | 0.19%(+5.92)#159 |
| 3. | Truchas | 2.8% | 0.088%(+2.72)#3 | 0.19%(+2.62)#328 |
| 4. | Becenti | 1.1% | 0.088%(+1.00)#4 | 0.19%(+0.902)#700 |
| 5. | Holloman Afb | 1.1% | 0.088%(+0.989)#5 | 0.19%(+0.887)#704 |
| 6. | Peralta | 0.89% | 0.088%(+0.800)#6 | 0.19%(+0.699)#816 |
| 7. | Las Campanas | 0.72% | 0.088%(+0.636)#7 | 0.19%(+0.534)#967 |
| 8. | Rio Rancho | 0.34% | 0.088%(+0.249)#8 | 0.19%(+0.148)#1,625 |
| 9. | Las Cruces | 0.27% | 0.088%(+0.180)#9 | 0.19%(+0.079)#1,856 |
| 10. | Portales | 0.26% | 0.088%(+0.177)#10 | 0.19%(+0.076)#1,868 |
| 11. | Thoreau | 0.25% | 0.088%(+0.167)#11 | 0.19%(+0.065)#1,909 |
| 12. | Clovis | 0.19% | 0.088%(+0.105)#12 | 0.19%(+0.004)#2,166 |
| 13. | Gallup | 0.19% | 0.088%(+0.102)#13 | 0.19%(+0.000)#2,180 |
| 14. | Kirtland Afb | 0.18% | 0.088%(+0.095)#14 | 0.19%(-0.006)#2,216 |
| 15. | Santa Fe | 0.13% | 0.088%(+0.041)#15 | 0.19%(-0.060)#2,532 |
| 16. | Shiprock | 0.11% | 0.088%(+0.021)#16 | 0.19%(-0.080)#2,678 |
| 17. | Albuquerque | 0.10% | 0.088%(+0.013)#17 | 0.19%(-0.088)#2,735 |
| 18. | South Valley | 0.069% | 0.088%(-0.018)#18 | 0.19%(-0.120)#3,001 |
| 19. | El Rancho | 0.066% | 0.088%(-0.021)#19 | 0.19%(-0.123)#3,035 |
| 20. | Grants | 0.065% | 0.088%(-0.022)#20 | 0.19%(-0.123)#3,040 |
| 21. | Bernalillo | 0.065% | 0.088%(-0.023)#21 | 0.19%(-0.124)#3,049 |
| 22. | Roswell | 0.058% | 0.088%(-0.029)#22 | 0.19%(-0.130)#3,119 |
| 23. | Aztec | 0.048% | 0.088%(-0.039)#23 | 0.19%(-0.140)#3,225 |
| 24. | Taos | 0.046% | 0.088%(-0.041)#24 | 0.19%(-0.142)#3,245 |
| 25. | Farmington | 0.034% | 0.088%(-0.053)#25 | 0.19%(-0.154)#3,385 |
Common Questions
What are the Top 10 Cities with the Highest Percentage of Hawaiian / Pacific Population in New Mexico?
Top 10 Cities with the Highest Percentage of Hawaiian / Pacific Population in New Mexico are:
#1
15.8%
#2
6.1%
#3
2.8%
#4
1.1%
#5
0.89%
#6
0.34%
#7
0.27%
#8
0.26%
#9
0.25%
#10
0.19%
What city has the Highest Percentage of Hawaiian / Pacific Population in New Mexico?
Anzac Village has the Highest Percentage of Hawaiian / Pacific Population in New Mexico with 15.8%.
What is the Percentage of Hawaiian / Pacific Population in the State of New Mexico?
Percentage of Hawaiian / Pacific Population in New Mexico is 0.088%.
What is the Percentage of Hawaiian / Pacific Population in the United States?
Percentage of Hawaiian / Pacific Population in the United States is 0.19%.