Cities with the Highest Percentage of Hawaiian / Pacific Population in Minnesota
RELATED REPORTS & OPTIONS
Hawaiian / Pacific
Minnesota
Compare Cities
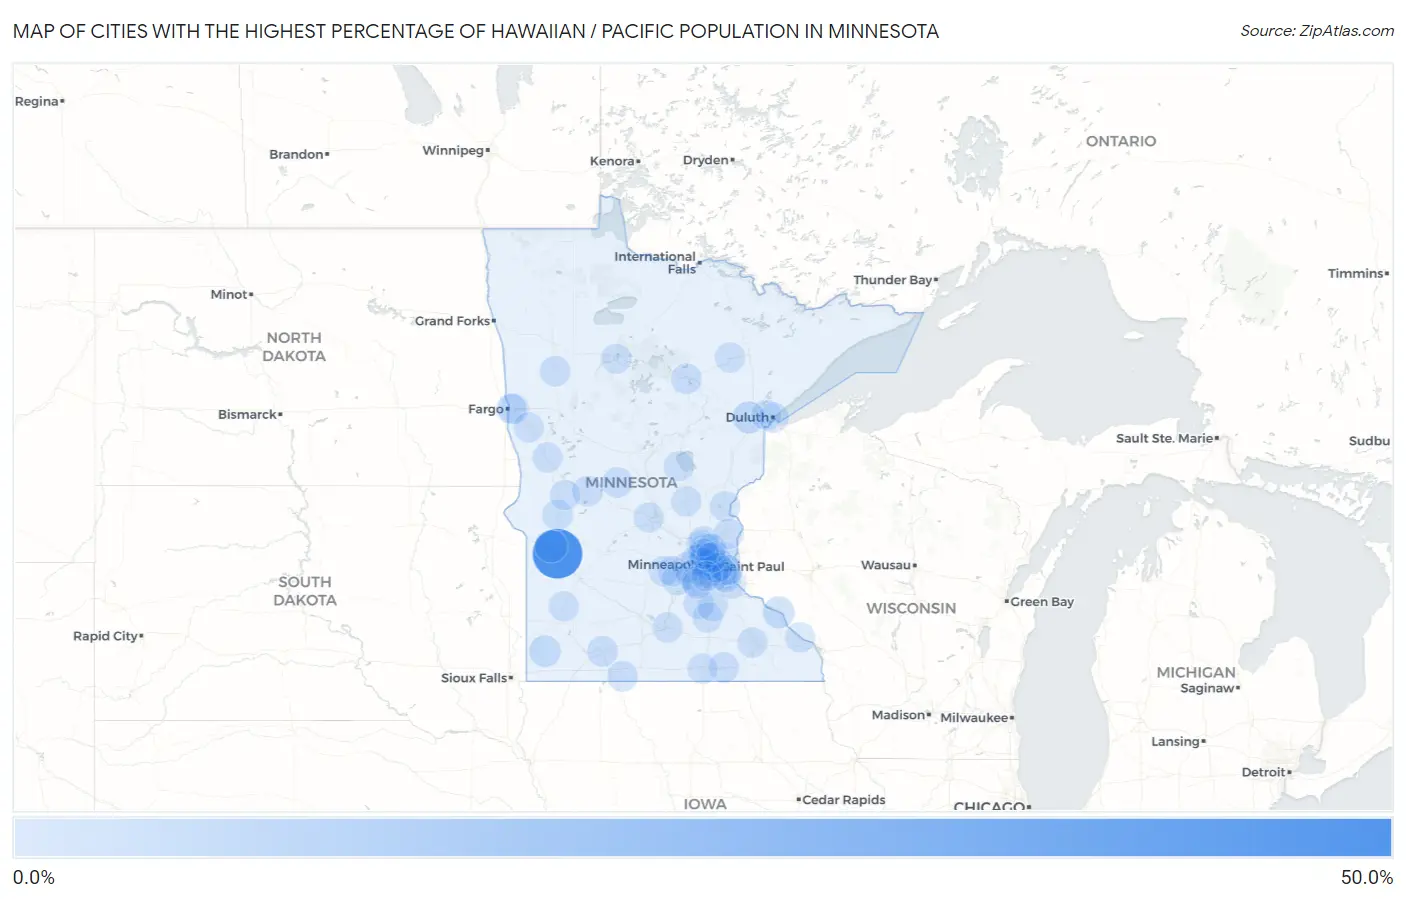
Map of Cities with the Highest Percentage of Hawaiian / Pacific Population in Minnesota
0.0%
50.0%
Cities with the Highest Percentage of Hawaiian / Pacific Population in Minnesota
| City | Hawaiian / Pacific | vs State | vs National | |
| 1. | Milan | 48.0% | 0.041%(+47.9)#1 | 0.19%(+47.8)#9 |
| 2. | Appleton | 5.8% | 0.041%(+5.75)#2 | 0.19%(+5.61)#165 |
| 3. | Mahnomen | 4.2% | 0.041%(+4.17)#3 | 0.19%(+4.02)#226 |
| 4. | Wabasha | 3.6% | 0.041%(+3.55)#4 | 0.19%(+3.41)#258 |
| 5. | Edgerton | 2.9% | 0.041%(+2.83)#5 | 0.19%(+2.68)#322 |
| 6. | Long Prairie | 1.1% | 0.041%(+1.02)#6 | 0.19%(+0.877)#708 |
| 7. | Riverland | 1.0% | 0.041%(+0.963)#7 | 0.19%(+0.815)#739 |
| 8. | Cologne | 0.96% | 0.041%(+0.918)#8 | 0.19%(+0.770)#764 |
| 9. | Alexandria | 0.83% | 0.041%(+0.793)#9 | 0.19%(+0.645)#854 |
| 10. | Windom | 0.82% | 0.041%(+0.777)#10 | 0.19%(+0.629)#874 |
| 11. | Cohasset | 0.78% | 0.041%(+0.742)#11 | 0.19%(+0.594)#910 |
| 12. | Morris | 0.77% | 0.041%(+0.725)#12 | 0.19%(+0.577)#928 |
| 13. | Dunnell | 0.74% | 0.041%(+0.700)#13 | 0.19%(+0.552)#947 |
| 14. | Austin | 0.73% | 0.041%(+0.686)#14 | 0.19%(+0.538)#964 |
| 15. | Lonsdale | 0.68% | 0.041%(+0.636)#15 | 0.19%(+0.488)#1,033 |
| 16. | St Paul Park | 0.42% | 0.041%(+0.378)#16 | 0.19%(+0.230)#1,398 |
| 17. | Spring Park | 0.42% | 0.041%(+0.376)#17 | 0.19%(+0.228)#1,399 |
| 18. | Milaca | 0.40% | 0.041%(+0.355)#18 | 0.19%(+0.207)#1,451 |
| 19. | Vineland | 0.38% | 0.041%(+0.338)#19 | 0.19%(+0.190)#1,498 |
| 20. | Dilworth | 0.37% | 0.041%(+0.327)#20 | 0.19%(+0.179)#1,531 |
| 21. | St Joseph | 0.33% | 0.041%(+0.285)#21 | 0.19%(+0.137)#1,649 |
| 22. | Rush City | 0.31% | 0.041%(+0.268)#22 | 0.19%(+0.120)#1,697 |
| 23. | Lester Prairie | 0.26% | 0.041%(+0.220)#23 | 0.19%(+0.072)#1,885 |
| 24. | Moorhead | 0.25% | 0.041%(+0.207)#24 | 0.19%(+0.059)#1,936 |
| 25. | Barnesville | 0.22% | 0.041%(+0.176)#25 | 0.19%(+0.028)#2,058 |
| 26. | Falcon Heights | 0.21% | 0.041%(+0.169)#26 | 0.19%(+0.022)#2,086 |
| 27. | Faribault | 0.20% | 0.041%(+0.160)#27 | 0.19%(+0.012)#2,126 |
| 28. | Mahtomedi | 0.19% | 0.041%(+0.145)#28 | 0.19%(-0.003)#2,197 |
| 29. | Hastings | 0.15% | 0.041%(+0.113)#29 | 0.19%(-0.035)#2,385 |
| 30. | New Hope | 0.15% | 0.041%(+0.112)#30 | 0.19%(-0.036)#2,392 |
| 31. | Anoka | 0.15% | 0.041%(+0.110)#31 | 0.19%(-0.038)#2,397 |
| 32. | Bemidji | 0.15% | 0.041%(+0.108)#32 | 0.19%(-0.040)#2,409 |
| 33. | Hermantown | 0.15% | 0.041%(+0.107)#33 | 0.19%(-0.041)#2,414 |
| 34. | Chisholm | 0.15% | 0.041%(+0.106)#34 | 0.19%(-0.042)#2,419 |
| 35. | Hoffman | 0.15% | 0.041%(+0.106)#35 | 0.19%(-0.042)#2,420 |
| 36. | Cottage Grove | 0.14% | 0.041%(+0.099)#36 | 0.19%(-0.049)#2,464 |
| 37. | Chisago City | 0.13% | 0.041%(+0.085)#37 | 0.19%(-0.063)#2,553 |
| 38. | Maplewood | 0.12% | 0.041%(+0.082)#38 | 0.19%(-0.066)#2,574 |
| 39. | Fergus Falls | 0.11% | 0.041%(+0.073)#39 | 0.19%(-0.075)#2,642 |
| 40. | South St Paul | 0.11% | 0.041%(+0.066)#40 | 0.19%(-0.082)#2,686 |
| 41. | Rochester | 0.088% | 0.041%(+0.047)#41 | 0.19%(-0.101)#2,837 |
| 42. | Mayer | 0.081% | 0.041%(+0.040)#42 | 0.19%(-0.107)#2,889 |
| 43. | Albert Lea | 0.076% | 0.041%(+0.035)#43 | 0.19%(-0.113)#2,935 |
| 44. | Mankato | 0.074% | 0.041%(+0.033)#44 | 0.19%(-0.114)#2,949 |
| 45. | Brooklyn Center | 0.072% | 0.041%(+0.032)#45 | 0.19%(-0.116)#2,965 |
| 46. | Plymouth | 0.060% | 0.041%(+0.019)#46 | 0.19%(-0.129)#3,099 |
| 47. | Shoreview | 0.056% | 0.041%(+0.015)#47 | 0.19%(-0.133)#3,146 |
| 48. | Coon Rapids | 0.043% | 0.041%(+0.002)#48 | 0.19%(-0.146)#3,294 |
| 49. | Richfield | 0.041% | 0.041%(-0.000)#49 | 0.19%(-0.148)#3,314 |
| 50. | Minneapolis | 0.038% | 0.041%(-0.003)#50 | 0.19%(-0.151)#3,345 |
| 51. | Golden Valley | 0.032% | 0.041%(-0.009)#51 | 0.19%(-0.157)#3,420 |
| 52. | Chanhassen | 0.031% | 0.041%(-0.010)#52 | 0.19%(-0.158)#3,430 |
| 53. | Eagan | 0.031% | 0.041%(-0.010)#53 | 0.19%(-0.158)#3,433 |
| 54. | Woodbury | 0.028% | 0.041%(-0.013)#54 | 0.19%(-0.161)#3,478 |
| 55. | Shakopee | 0.027% | 0.041%(-0.014)#55 | 0.19%(-0.162)#3,484 |
| 56. | St Paul | 0.024% | 0.041%(-0.017)#56 | 0.19%(-0.165)#3,539 |
| 57. | Winona | 0.015% | 0.041%(-0.025)#57 | 0.19%(-0.173)#3,651 |
| 58. | Andover | 0.015% | 0.041%(-0.025)#58 | 0.19%(-0.173)#3,652 |
| 59. | Marshall | 0.015% | 0.041%(-0.026)#59 | 0.19%(-0.174)#3,661 |
| 60. | Northfield | 0.015% | 0.041%(-0.026)#60 | 0.19%(-0.174)#3,662 |
| 61. | Brooklyn Park | 0.0082% | 0.041%(-0.033)#61 | 0.19%(-0.180)#3,735 |
| 62. | Prior Lake | 0.0072% | 0.041%(-0.034)#62 | 0.19%(-0.181)#3,747 |
| 63. | Blaine | 0.0071% | 0.041%(-0.034)#63 | 0.19%(-0.182)#3,749 |
| 64. | New Brighton | 0.0043% | 0.041%(-0.036)#64 | 0.19%(-0.184)#3,775 |
| 65. | Duluth | 0.0035% | 0.041%(-0.037)#65 | 0.19%(-0.185)#3,785 |
| 66. | Bloomington | 0.0011% | 0.041%(-0.040)#66 | 0.19%(-0.188)#3,802 |
Common Questions
What are the Top 10 Cities with the Highest Percentage of Hawaiian / Pacific Population in Minnesota?
Top 10 Cities with the Highest Percentage of Hawaiian / Pacific Population in Minnesota are:
#1
48.0%
#2
5.8%
#3
4.2%
#4
3.6%
#5
2.9%
#6
1.1%
#7
1.0%
#8
0.96%
#9
0.83%
#10
0.82%
What city has the Highest Percentage of Hawaiian / Pacific Population in Minnesota?
Milan has the Highest Percentage of Hawaiian / Pacific Population in Minnesota with 48.0%.
What is the Percentage of Hawaiian / Pacific Population in the State of Minnesota?
Percentage of Hawaiian / Pacific Population in Minnesota is 0.041%.
What is the Percentage of Hawaiian / Pacific Population in the United States?
Percentage of Hawaiian / Pacific Population in the United States is 0.19%.