Cities with the Highest Percentage of Hawaiian / Pacific Population in Montana
RELATED REPORTS & OPTIONS
Hawaiian / Pacific
Montana
Compare Cities
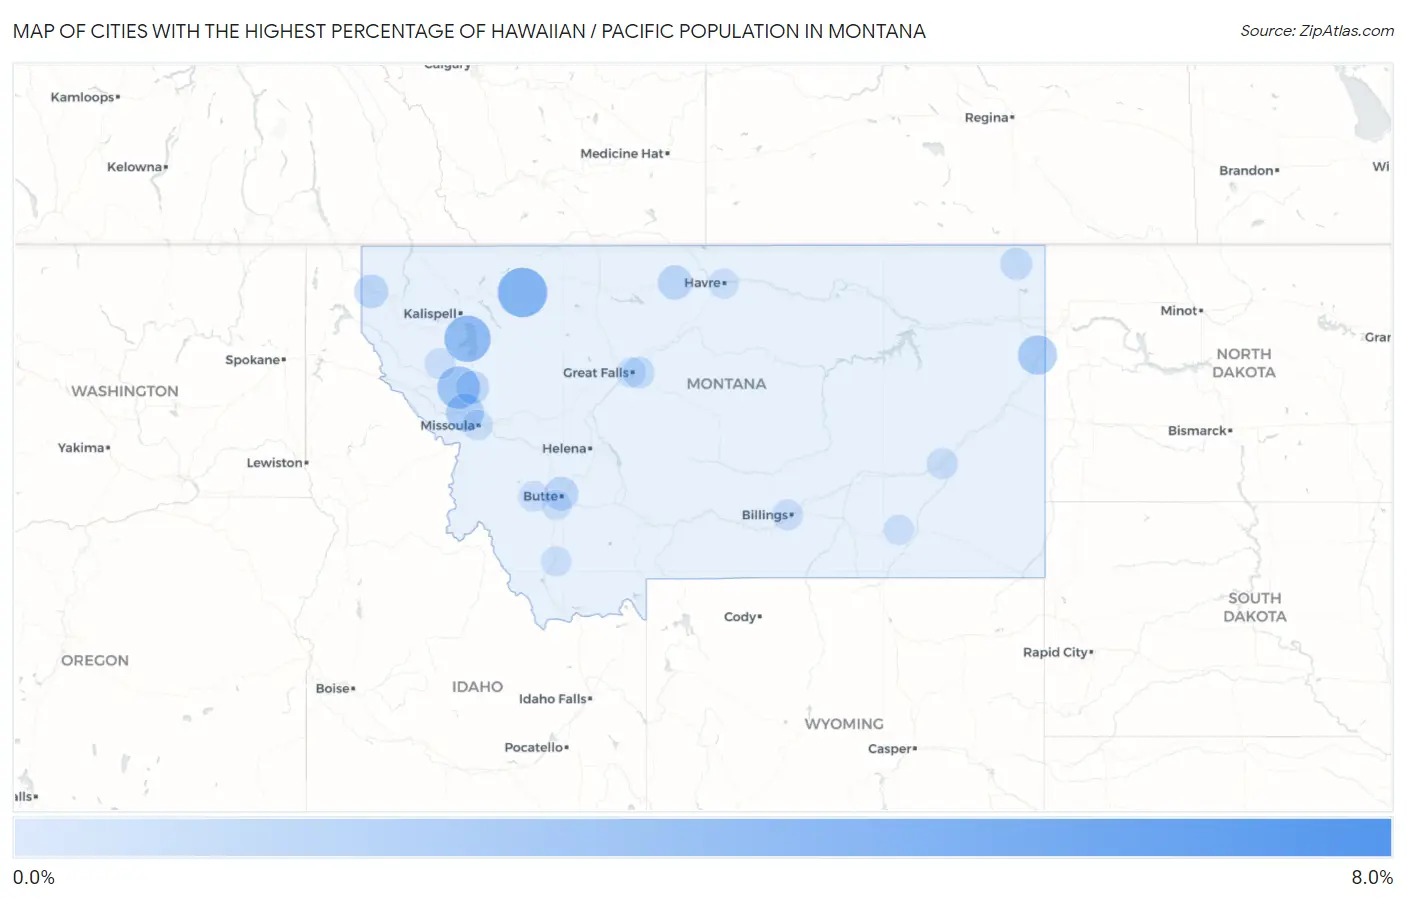
Map of Cities with the Highest Percentage of Hawaiian / Pacific Population in Montana
0.0%
8.0%
Cities with the Highest Percentage of Hawaiian / Pacific Population in Montana
| City | Hawaiian / Pacific | vs State | vs National | |
| 1. | St. Mary | 7.0% | 0.062%(+6.96)#1 | 0.19%(+6.84)#140 |
| 2. | East Glacier Park Village | 3.8% | 0.062%(+3.75)#2 | 0.19%(+3.63)#245 |
| 3. | Rollins | 3.2% | 0.062%(+3.11)#3 | 0.19%(+2.99)#292 |
| 4. | Hall | 2.9% | 0.062%(+2.88)#4 | 0.19%(+2.75)#313 |
| 5. | Dixon | 2.4% | 0.062%(+2.37)#5 | 0.19%(+2.24)#365 |
| 6. | Sidney | 1.7% | 0.062%(+1.68)#6 | 0.19%(+1.55)#493 |
| 7. | Frenchtown | 1.5% | 0.062%(+1.47)#7 | 0.19%(+1.34)#551 |
| 8. | Rudyard | 0.80% | 0.062%(+0.742)#8 | 0.19%(+0.616)#888 |
| 9. | Walkerville | 0.75% | 0.062%(+0.686)#9 | 0.19%(+0.560)#941 |
| 10. | Troy | 0.68% | 0.062%(+0.616)#10 | 0.19%(+0.490)#1,030 |
| 11. | St Ignatius | 0.59% | 0.062%(+0.526)#11 | 0.19%(+0.400)#1,132 |
| 12. | Plentywood | 0.39% | 0.062%(+0.331)#12 | 0.19%(+0.204)#1,459 |
| 13. | Malmstrom Afb | 0.30% | 0.062%(+0.241)#13 | 0.19%(+0.115)#1,714 |
| 14. | Miles City | 0.20% | 0.062%(+0.139)#14 | 0.19%(+0.013)#2,120 |
| 15. | Billings | 0.18% | 0.062%(+0.116)#15 | 0.19%(-0.010)#2,234 |
| 16. | Hot Springs | 0.16% | 0.062%(+0.101)#16 | 0.19%(-0.026)#2,326 |
| 17. | Missoula | 0.12% | 0.062%(+0.057)#17 | 0.19%(-0.069)#2,596 |
| 18. | Anaconda Deer Lodge County | 0.074% | 0.062%(+0.012)#18 | 0.19%(-0.115)#2,950 |
| 19. | Lame Deer | 0.048% | 0.062%(-0.014)#19 | 0.19%(-0.140)#3,222 |
| 20. | Havre | 0.032% | 0.062%(-0.030)#20 | 0.19%(-0.157)#3,418 |
| 21. | Dillon | 0.025% | 0.062%(-0.037)#21 | 0.19%(-0.163)#3,516 |
| 22. | Butte Silver Bow Balance | 0.012% | 0.062%(-0.051)#22 | 0.19%(-0.177)#3,698 |
| 23. | Great Falls | 0.0033% | 0.062%(-0.059)#23 | 0.19%(-0.185)#3,788 |
Common Questions
What are the Top 10 Cities with the Highest Percentage of Hawaiian / Pacific Population in Montana?
Top 10 Cities with the Highest Percentage of Hawaiian / Pacific Population in Montana are:
#1
3.8%
#2
3.2%
#3
2.4%
#4
1.7%
#5
1.5%
#6
0.80%
#7
0.75%
#8
0.68%
#9
0.59%
#10
0.39%
What city has the Highest Percentage of Hawaiian / Pacific Population in Montana?
East Glacier Park Village has the Highest Percentage of Hawaiian / Pacific Population in Montana with 3.8%.
What is the Percentage of Hawaiian / Pacific Population in the State of Montana?
Percentage of Hawaiian / Pacific Population in Montana is 0.062%.
What is the Percentage of Hawaiian / Pacific Population in the United States?
Percentage of Hawaiian / Pacific Population in the United States is 0.19%.