Cities with the Highest Percentage of Population Employed in Public Administration in South Carolina
RELATED REPORTS & OPTIONS
Public Administration
South Carolina
Compare Cities
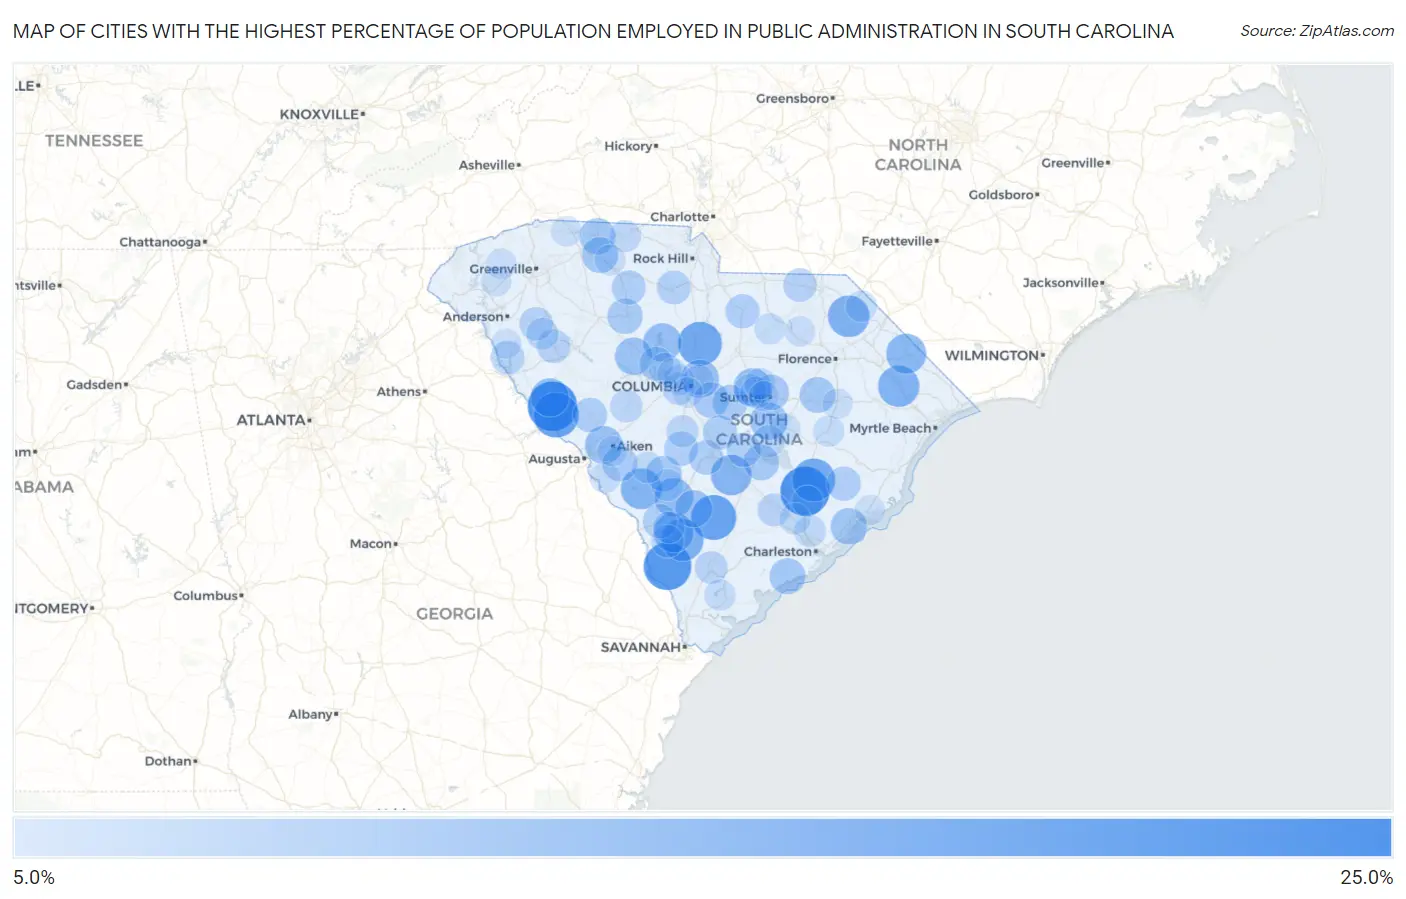
Map of Cities with the Highest Percentage of Population Employed in Public Administration in South Carolina
0.0%
25.0%
Cities with the Highest Percentage of Population Employed in Public Administration in South Carolina
| City | % Employed | vs State | vs National | |
| 1. | Plum Branch | 24.4% | 4.5%(+20.0)#1 | 4.7%(+19.8)#782 |
| 2. | Pinopolis | 24.3% | 4.5%(+19.8)#2 | 4.7%(+19.6)#796 |
| 3. | Scotia | 22.7% | 4.5%(+18.3)#3 | 4.7%(+18.0)#913 |
| 4. | Parksville | 20.5% | 4.5%(+16.0)#4 | 4.7%(+15.8)#1,128 |
| 5. | Williams | 20.4% | 4.5%(+15.9)#5 | 4.7%(+15.7)#1,145 |
| 6. | Ridgeway | 19.4% | 4.5%(+14.9)#6 | 4.7%(+14.7)#1,286 |
| 7. | Bonneau | 18.6% | 4.5%(+14.2)#7 | 4.7%(+13.9)#1,384 |
| 8. | Hampton | 17.8% | 4.5%(+13.3)#8 | 4.7%(+13.1)#1,520 |
| 9. | Blenheim | 17.2% | 4.5%(+12.8)#9 | 4.7%(+12.6)#1,620 |
| 10. | Aynor | 16.9% | 4.5%(+12.5)#10 | 4.7%(+12.3)#1,676 |
| 11. | Snelling | 16.5% | 4.5%(+12.1)#11 | 4.7%(+11.9)#1,754 |
| 12. | Bowman | 16.3% | 4.5%(+11.9)#12 | 4.7%(+11.6)#1,792 |
| 13. | Brunson | 15.8% | 4.5%(+11.3)#13 | 4.7%(+11.1)#1,909 |
| 14. | Nichols | 15.7% | 4.5%(+11.2)#14 | 4.7%(+11.0)#1,933 |
| 15. | Olar | 14.8% | 4.5%(+10.3)#15 | 4.7%(+10.1)#2,177 |
| 16. | Mccormick | 14.4% | 4.5%(+9.96)#16 | 4.7%(+9.74)#2,304 |
| 17. | Jenkinsville | 14.3% | 4.5%(+9.82)#17 | 4.7%(+9.60)#2,379 |
| 18. | Oakland | 14.2% | 4.5%(+9.72)#18 | 4.7%(+9.50)#2,410 |
| 19. | Arcadia Lakes | 14.0% | 4.5%(+9.50)#19 | 4.7%(+9.28)#2,476 |
| 20. | Centenary | 13.9% | 4.5%(+9.42)#20 | 4.7%(+9.20)#2,510 |
| 21. | Graniteville | 13.8% | 4.5%(+9.31)#21 | 4.7%(+9.09)#2,551 |
| 22. | Prosperity | 13.6% | 4.5%(+9.09)#22 | 4.7%(+8.87)#2,642 |
| 23. | Paxville | 13.5% | 4.5%(+9.06)#23 | 4.7%(+8.84)#2,650 |
| 24. | Ehrhardt | 13.3% | 4.5%(+8.79)#24 | 4.7%(+8.57)#2,761 |
| 25. | Awendaw | 12.5% | 4.5%(+8.07)#25 | 4.7%(+7.85)#2,997 |
| 26. | Mayo | 12.3% | 4.5%(+7.86)#26 | 4.7%(+7.64)#3,094 |
| 27. | Glendale | 12.3% | 4.5%(+7.80)#27 | 4.7%(+7.58)#3,122 |
| 28. | Rockville | 12.2% | 4.5%(+7.73)#28 | 4.7%(+7.51)#3,171 |
| 29. | Olanta | 12.1% | 4.5%(+7.65)#29 | 4.7%(+7.44)#3,209 |
| 30. | Blackville | 12.1% | 4.5%(+7.63)#30 | 4.7%(+7.41)#3,227 |
| 31. | Helena | 12.0% | 4.5%(+7.49)#31 | 4.7%(+7.27)#3,289 |
| 32. | Mulberry | 11.9% | 4.5%(+7.44)#32 | 4.7%(+7.22)#3,310 |
| 33. | Hopkins | 11.9% | 4.5%(+7.40)#33 | 4.7%(+7.18)#3,326 |
| 34. | Vance | 11.8% | 4.5%(+7.30)#34 | 4.7%(+7.08)#3,381 |
| 35. | Whitmire | 11.6% | 4.5%(+7.15)#35 | 4.7%(+6.93)#3,466 |
| 36. | Eastover | 11.5% | 4.5%(+7.02)#36 | 4.7%(+6.80)#3,541 |
| 37. | New Ellenton | 11.5% | 4.5%(+7.00)#37 | 4.7%(+6.79)#3,550 |
| 38. | Floydale | 11.4% | 4.5%(+6.90)#38 | 4.7%(+6.68)#3,606 |
| 39. | Edisto | 10.9% | 4.5%(+6.45)#39 | 4.7%(+6.23)#3,845 |
| 40. | Edgefield | 10.8% | 4.5%(+6.38)#40 | 4.7%(+6.16)#3,899 |
| 41. | Allendale | 10.8% | 4.5%(+6.35)#41 | 4.7%(+6.14)#3,917 |
| 42. | St Matthews | 10.8% | 4.5%(+6.35)#42 | 4.7%(+6.13)#3,919 |
| 43. | Monarch Mill | 10.7% | 4.5%(+6.26)#43 | 4.7%(+6.04)#3,970 |
| 44. | Neeses | 10.7% | 4.5%(+6.25)#44 | 4.7%(+6.03)#3,982 |
| 45. | Elloree | 10.7% | 4.5%(+6.23)#45 | 4.7%(+6.01)#4,001 |
| 46. | Jamestown | 10.6% | 4.5%(+6.17)#46 | 4.7%(+5.95)#4,042 |
| 47. | Kershaw | 10.5% | 4.5%(+6.06)#47 | 4.7%(+5.84)#4,099 |
| 48. | Eureka Mill | 10.5% | 4.5%(+6.01)#48 | 4.7%(+5.79)#4,156 |
| 49. | Chapin | 10.3% | 4.5%(+5.86)#49 | 4.7%(+5.65)#4,250 |
| 50. | Lowndesville | 10.2% | 4.5%(+5.70)#50 | 4.7%(+5.48)#4,361 |
| 51. | Hodges | 10.2% | 4.5%(+5.70)#51 | 4.7%(+5.48)#4,362 |
| 52. | Chesterfield | 10.1% | 4.5%(+5.65)#52 | 4.7%(+5.43)#4,405 |
| 53. | Honea Path | 10.0% | 4.5%(+5.54)#53 | 4.7%(+5.32)#4,462 |
| 54. | Sheldon | 9.6% | 4.5%(+5.10)#54 | 4.7%(+4.88)#4,812 |
| 55. | Yemassee | 9.5% | 4.5%(+5.08)#55 | 4.7%(+4.86)#4,827 |
| 56. | Drayton | 9.4% | 4.5%(+4.96)#56 | 4.7%(+4.74)#4,939 |
| 57. | Ridgeville | 9.4% | 4.5%(+4.89)#57 | 4.7%(+4.67)#4,991 |
| 58. | Capitol View | 9.4% | 4.5%(+4.89)#58 | 4.7%(+4.67)#4,993 |
| 59. | Gifford | 9.3% | 4.5%(+4.84)#59 | 4.7%(+4.62)#5,033 |
| 60. | Oak Grove | 9.2% | 4.5%(+4.73)#60 | 4.7%(+4.51)#5,124 |
| 61. | Summerton | 9.2% | 4.5%(+4.70)#61 | 4.7%(+4.49)#5,139 |
| 62. | Monetta | 9.1% | 4.5%(+4.62)#62 | 4.7%(+4.41)#5,209 |
| 63. | Woodford | 9.0% | 4.5%(+4.49)#63 | 4.7%(+4.27)#5,339 |
| 64. | Lake Murray Of Richland | 8.9% | 4.5%(+4.41)#64 | 4.7%(+4.19)#5,415 |
| 65. | North Santee | 8.8% | 4.5%(+4.38)#65 | 4.7%(+4.16)#5,446 |
| 66. | Donalds | 8.8% | 4.5%(+4.29)#66 | 4.7%(+4.07)#5,532 |
| 67. | Hilda | 8.7% | 4.5%(+4.26)#67 | 4.7%(+4.04)#5,569 |
| 68. | East Gaffney | 8.7% | 4.5%(+4.24)#68 | 4.7%(+4.03)#5,584 |
| 69. | Stateburg | 8.7% | 4.5%(+4.21)#69 | 4.7%(+3.99)#5,627 |
| 70. | Cherryvale | 8.7% | 4.5%(+4.19)#70 | 4.7%(+3.97)#5,648 |
| 71. | Hanahan | 8.6% | 4.5%(+4.14)#71 | 4.7%(+3.92)#5,690 |
| 72. | Fairfax | 8.5% | 4.5%(+4.04)#72 | 4.7%(+3.82)#5,798 |
| 73. | Grover | 8.5% | 4.5%(+3.98)#73 | 4.7%(+3.77)#5,858 |
| 74. | Sangaree | 8.4% | 4.5%(+3.92)#74 | 4.7%(+3.70)#5,931 |
| 75. | Williston | 8.3% | 4.5%(+3.80)#75 | 4.7%(+3.58)#6,063 |
| 76. | Dalzell | 8.3% | 4.5%(+3.79)#76 | 4.7%(+3.57)#6,076 |
| 77. | Moncks Corner | 8.2% | 4.5%(+3.71)#77 | 4.7%(+3.49)#6,172 |
| 78. | Clio | 8.1% | 4.5%(+3.65)#78 | 4.7%(+3.43)#6,224 |
| 79. | Bethune | 8.1% | 4.5%(+3.64)#79 | 4.7%(+3.42)#6,230 |
| 80. | Laurel Bay | 8.1% | 4.5%(+3.60)#80 | 4.7%(+3.38)#6,278 |
| 81. | Kingstree | 8.1% | 4.5%(+3.58)#81 | 4.7%(+3.37)#6,298 |
| 82. | Seven Oaks | 8.0% | 4.5%(+3.49)#82 | 4.7%(+3.27)#6,407 |
| 83. | Manning | 7.8% | 4.5%(+3.37)#83 | 4.7%(+3.15)#6,550 |
| 84. | Jackson | 7.7% | 4.5%(+3.23)#84 | 4.7%(+3.01)#6,721 |
| 85. | Central Pacolet | 7.7% | 4.5%(+3.23)#85 | 4.7%(+3.01)#6,740 |
| 86. | Adams Run | 7.6% | 4.5%(+3.12)#86 | 4.7%(+2.90)#6,867 |
| 87. | Campobello | 7.6% | 4.5%(+3.12)#87 | 4.7%(+2.90)#6,872 |
| 88. | Irmo | 7.6% | 4.5%(+3.09)#88 | 4.7%(+2.88)#6,903 |
| 89. | Pickens | 7.5% | 4.5%(+3.07)#89 | 4.7%(+2.85)#6,946 |
| 90. | North Hartsville | 7.5% | 4.5%(+3.05)#90 | 4.7%(+2.83)#6,981 |
| 91. | Forest Acres | 7.5% | 4.5%(+3.03)#91 | 4.7%(+2.81)#7,005 |
| 92. | East Camden | 7.4% | 4.5%(+2.95)#92 | 4.7%(+2.73)#7,094 |
| 93. | Lake City | 7.4% | 4.5%(+2.94)#93 | 4.7%(+2.72)#7,096 |
| 94. | Cayce | 7.4% | 4.5%(+2.94)#94 | 4.7%(+2.72)#7,097 |
| 95. | Aiken | 7.4% | 4.5%(+2.90)#95 | 4.7%(+2.68)#7,151 |
| 96. | Norris | 7.4% | 4.5%(+2.89)#96 | 4.7%(+2.67)#7,164 |
| 97. | Hilltop | 7.3% | 4.5%(+2.87)#97 | 4.7%(+2.65)#7,196 |
| 98. | Mcclellanville | 7.3% | 4.5%(+2.85)#98 | 4.7%(+2.63)#7,229 |
| 99. | Iva | 7.2% | 4.5%(+2.77)#99 | 4.7%(+2.55)#7,340 |
| 100. | Sumter | 7.2% | 4.5%(+2.73)#100 | 4.7%(+2.52)#7,382 |
Common Questions
What are the Top 10 Cities with the Highest Percentage of Population Employed in Public Administration in South Carolina?
Top 10 Cities with the Highest Percentage of Population Employed in Public Administration in South Carolina are:
#1
24.4%
#2
24.3%
#3
22.7%
#4
20.5%
#5
20.4%
#6
19.4%
#7
18.6%
#8
17.8%
#9
17.2%
#10
16.9%
What city has the Highest Percentage of Population Employed in Public Administration in South Carolina?
Plum Branch has the Highest Percentage of Population Employed in Public Administration in South Carolina with 24.4%.
What is the Percentage of Population Employed in Public Administration in the State of South Carolina?
Percentage of Population Employed in Public Administration in South Carolina is 4.5%.
What is the Percentage of Population Employed in Public Administration in the United States?
Percentage of Population Employed in Public Administration in the United States is 4.7%.