Cities with the Highest Percentage of Population Employed in Public Administration in Tennessee
RELATED REPORTS & OPTIONS
Public Administration
Tennessee
Compare Cities
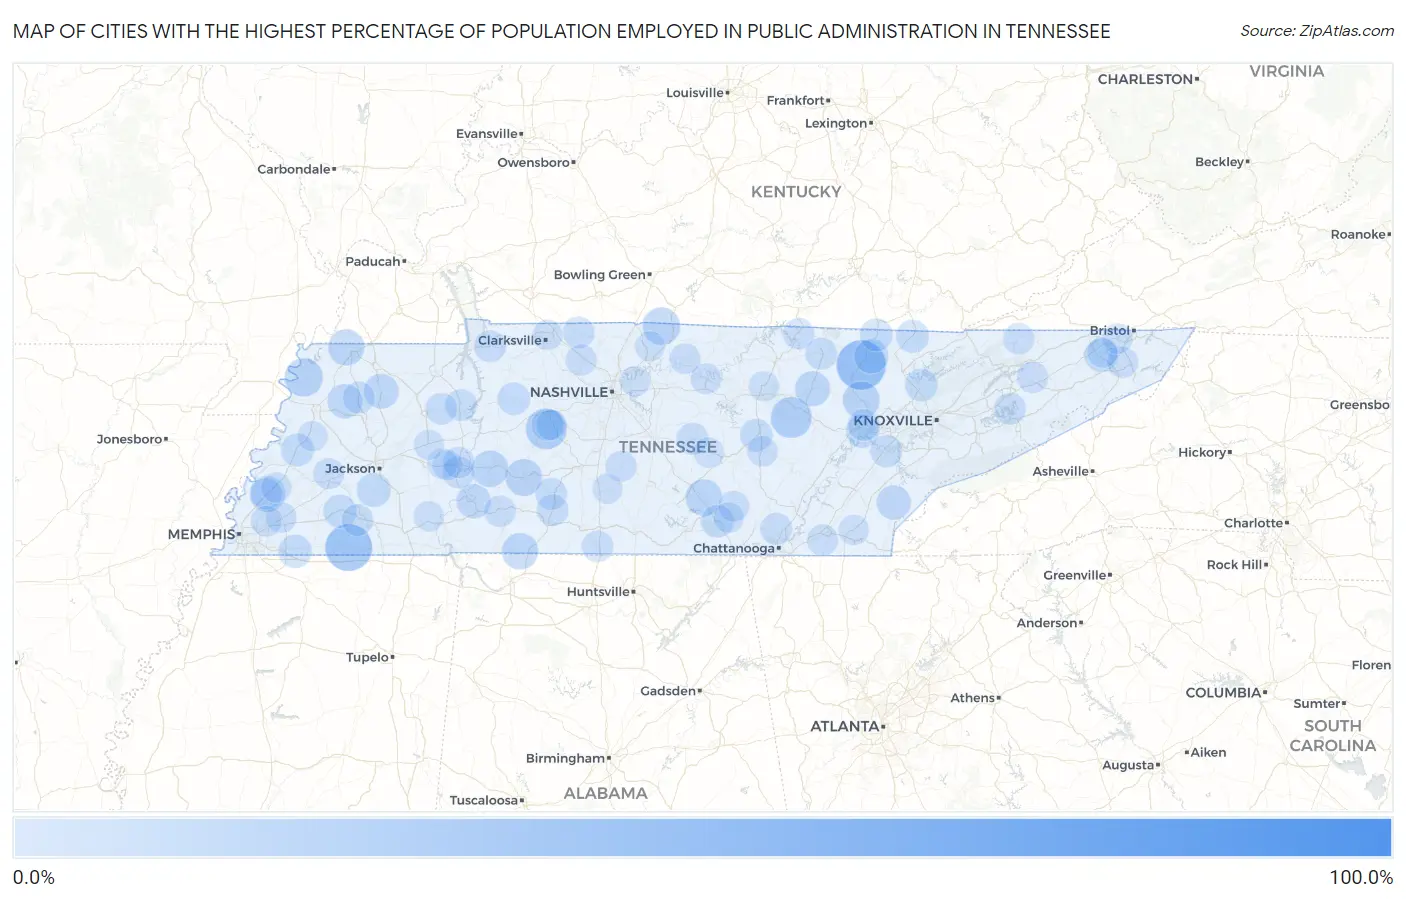
Map of Cities with the Highest Percentage of Population Employed in Public Administration in Tennessee
0.0%
100.0%
Cities with the Highest Percentage of Population Employed in Public Administration in Tennessee
| City | % Employed | vs State | vs National | |
| 1. | Statesville | 87.8% | 4.2%(+83.6)#1 | 4.7%(+83.1)#36 |
| 2. | Pocahontas | 57.7% | 4.2%(+53.5)#2 | 4.7%(+53.0)#94 |
| 3. | Palmersville | 50.0% | 4.2%(+45.8)#3 | 4.7%(+45.3)#131 |
| 4. | Luray | 38.9% | 4.2%(+34.8)#4 | 4.7%(+34.2)#276 |
| 5. | Robbins | 37.5% | 4.2%(+33.3)#5 | 4.7%(+32.8)#304 |
| 6. | Saulsbury | 33.3% | 4.2%(+29.2)#6 | 4.7%(+28.6)#370 |
| 7. | Briceville | 25.2% | 4.2%(+21.1)#7 | 4.7%(+20.6)#712 |
| 8. | Wrigley | 23.9% | 4.2%(+19.7)#8 | 4.7%(+19.2)#829 |
| 9. | Pleasant Hill | 23.7% | 4.2%(+19.5)#9 | 4.7%(+19.0)#847 |
| 10. | Walnut Grove Cdp Sumner County | 20.9% | 4.2%(+16.8)#10 | 4.7%(+16.3)#1,088 |
| 11. | Big Rock | 20.2% | 4.2%(+16.1)#11 | 4.7%(+15.5)#1,163 |
| 12. | Walnut Grove Cdp Hardin County | 20.0% | 4.2%(+15.8)#12 | 4.7%(+15.3)#1,185 |
| 13. | Ridgely | 19.6% | 4.2%(+15.5)#13 | 4.7%(+14.9)#1,252 |
| 14. | Fairfield | 18.5% | 4.2%(+14.3)#14 | 4.7%(+13.8)#1,400 |
| 15. | Wartburg | 17.6% | 4.2%(+13.4)#15 | 4.7%(+12.9)#1,556 |
| 16. | Oak Grove Cdp Sumner County | 17.6% | 4.2%(+13.4)#16 | 4.7%(+12.9)#1,559 |
| 17. | Hohenwald | 17.2% | 4.2%(+13.0)#17 | 4.7%(+12.5)#1,630 |
| 18. | Westpoint | 17.0% | 4.2%(+12.9)#18 | 4.7%(+12.4)#1,664 |
| 19. | Hillsboro | 17.0% | 4.2%(+12.8)#19 | 4.7%(+12.3)#1,669 |
| 20. | Linden | 17.0% | 4.2%(+12.8)#20 | 4.7%(+12.3)#1,671 |
| 21. | Iron City | 16.7% | 4.2%(+12.5)#21 | 4.7%(+12.0)#1,726 |
| 22. | Chewalla | 16.3% | 4.2%(+12.2)#22 | 4.7%(+11.6)#1,795 |
| 23. | Woodland Mills | 16.3% | 4.2%(+12.2)#23 | 4.7%(+11.6)#1,797 |
| 24. | Atoka | 15.8% | 4.2%(+11.7)#24 | 4.7%(+11.1)#1,906 |
| 25. | Delano | 15.5% | 4.2%(+11.3)#25 | 4.7%(+10.8)#1,996 |
| 26. | Clarkrange | 14.8% | 4.2%(+10.6)#26 | 4.7%(+10.1)#2,193 |
| 27. | Yorkville | 14.0% | 4.2%(+9.87)#27 | 4.7%(+9.34)#2,464 |
| 28. | Greenfield | 14.0% | 4.2%(+9.83)#28 | 4.7%(+9.30)#2,475 |
| 29. | Clifton | 13.7% | 4.2%(+9.55)#29 | 4.7%(+9.01)#2,576 |
| 30. | Tellico Plains | 13.4% | 4.2%(+9.24)#30 | 4.7%(+8.71)#2,709 |
| 31. | Huntsville | 13.3% | 4.2%(+9.16)#31 | 4.7%(+8.63)#2,747 |
| 32. | Medon | 12.7% | 4.2%(+8.59)#32 | 4.7%(+8.06)#2,929 |
| 33. | Mayland | 12.2% | 4.2%(+8.08)#33 | 4.7%(+7.55)#3,143 |
| 34. | Gray | 12.2% | 4.2%(+8.02)#34 | 4.7%(+7.49)#3,183 |
| 35. | Midtown | 11.8% | 4.2%(+7.69)#35 | 4.7%(+7.16)#3,342 |
| 36. | Whiteville | 11.8% | 4.2%(+7.60)#36 | 4.7%(+7.07)#3,389 |
| 37. | Rossville | 11.7% | 4.2%(+7.58)#37 | 4.7%(+7.04)#3,401 |
| 38. | Ripley | 11.4% | 4.2%(+7.23)#38 | 4.7%(+6.70)#3,592 |
| 39. | Jellico | 11.2% | 4.2%(+7.04)#39 | 4.7%(+6.51)#3,683 |
| 40. | Winfield | 11.0% | 4.2%(+6.81)#40 | 4.7%(+6.28)#3,825 |
| 41. | Monteagle | 10.9% | 4.2%(+6.72)#41 | 4.7%(+6.19)#3,870 |
| 42. | Norris | 10.9% | 4.2%(+6.72)#42 | 4.7%(+6.18)#3,871 |
| 43. | Mcewen | 10.9% | 4.2%(+6.70)#43 | 4.7%(+6.17)#3,892 |
| 44. | Biltmore | 10.7% | 4.2%(+6.55)#44 | 4.7%(+6.02)#3,996 |
| 45. | Doyle | 10.6% | 4.2%(+6.40)#45 | 4.7%(+5.87)#4,089 |
| 46. | Wildersville | 10.1% | 4.2%(+5.99)#46 | 4.7%(+5.46)#4,381 |
| 47. | Loudon | 10.0% | 4.2%(+5.88)#47 | 4.7%(+5.35)#4,447 |
| 48. | Woodbury | 10.0% | 4.2%(+5.88)#48 | 4.7%(+5.35)#4,448 |
| 49. | Fairmount | 9.7% | 4.2%(+5.59)#49 | 4.7%(+5.06)#4,687 |
| 50. | Beech Bluff | 9.6% | 4.2%(+5.49)#50 | 4.7%(+4.96)#4,759 |
| 51. | Rutherford | 9.6% | 4.2%(+5.44)#51 | 4.7%(+4.91)#4,795 |
| 52. | Jamestown | 9.5% | 4.2%(+5.38)#52 | 4.7%(+4.85)#4,840 |
| 53. | Lyles | 9.5% | 4.2%(+5.36)#53 | 4.7%(+4.83)#4,869 |
| 54. | Decaturville | 9.4% | 4.2%(+5.28)#54 | 4.7%(+4.75)#4,925 |
| 55. | Camden | 9.4% | 4.2%(+5.28)#55 | 4.7%(+4.75)#4,932 |
| 56. | Baneberry | 9.4% | 4.2%(+5.27)#56 | 4.7%(+4.74)#4,942 |
| 57. | Summertown | 9.3% | 4.2%(+5.19)#57 | 4.7%(+4.66)#5,007 |
| 58. | Harriman | 9.3% | 4.2%(+5.12)#58 | 4.7%(+4.59)#5,056 |
| 59. | Hollow Rock | 9.3% | 4.2%(+5.11)#59 | 4.7%(+4.57)#5,065 |
| 60. | Ethridge | 9.3% | 4.2%(+5.10)#60 | 4.7%(+4.57)#5,075 |
| 61. | Dover | 9.2% | 4.2%(+5.06)#61 | 4.7%(+4.53)#5,106 |
| 62. | Bolivar | 9.2% | 4.2%(+5.01)#62 | 4.7%(+4.48)#5,147 |
| 63. | Adams | 9.1% | 4.2%(+4.96)#63 | 4.7%(+4.43)#5,182 |
| 64. | Byrdstown | 8.8% | 4.2%(+4.65)#64 | 4.7%(+4.11)#5,486 |
| 65. | Elkton | 8.8% | 4.2%(+4.64)#65 | 4.7%(+4.11)#5,491 |
| 66. | Waynesboro | 8.8% | 4.2%(+4.63)#66 | 4.7%(+4.10)#5,503 |
| 67. | Sneedville | 8.8% | 4.2%(+4.62)#67 | 4.7%(+4.09)#5,509 |
| 68. | Munford | 8.7% | 4.2%(+4.57)#68 | 4.7%(+4.04)#5,571 |
| 69. | Bulls Gap | 8.7% | 4.2%(+4.56)#69 | 4.7%(+4.03)#5,581 |
| 70. | Strawberry Plains | 8.7% | 4.2%(+4.54)#70 | 4.7%(+4.01)#5,617 |
| 71. | South Cleveland | 8.6% | 4.2%(+4.47)#71 | 4.7%(+3.94)#5,669 |
| 72. | Parsons | 8.6% | 4.2%(+4.41)#72 | 4.7%(+3.87)#5,742 |
| 73. | Watauga | 8.5% | 4.2%(+4.36)#73 | 4.7%(+3.83)#5,787 |
| 74. | Pleasant View | 8.5% | 4.2%(+4.31)#74 | 4.7%(+3.78)#5,847 |
| 75. | Brownsville | 8.3% | 4.2%(+4.14)#75 | 4.7%(+3.61)#6,047 |
| 76. | Chapel Hill | 8.1% | 4.2%(+3.98)#76 | 4.7%(+3.45)#6,212 |
| 77. | Hartsville Trousdale County | 8.0% | 4.2%(+3.85)#77 | 4.7%(+3.32)#6,350 |
| 78. | Carthage | 7.9% | 4.2%(+3.73)#78 | 4.7%(+3.19)#6,502 |
| 79. | Arlington | 7.9% | 4.2%(+3.70)#79 | 4.7%(+3.17)#6,527 |
| 80. | Bartlett | 7.8% | 4.2%(+3.67)#80 | 4.7%(+3.14)#6,564 |
| 81. | Coalmont | 7.8% | 4.2%(+3.66)#81 | 4.7%(+3.13)#6,569 |
| 82. | Spencer | 7.7% | 4.2%(+3.54)#82 | 4.7%(+3.01)#6,724 |
| 83. | Tracy City | 7.5% | 4.2%(+3.34)#83 | 4.7%(+2.81)#7,002 |
| 84. | Brighton | 7.5% | 4.2%(+3.34)#84 | 4.7%(+2.81)#7,006 |
| 85. | Chesterfield | 7.5% | 4.2%(+3.32)#85 | 4.7%(+2.79)#7,036 |
| 86. | Centertown | 7.5% | 4.2%(+3.31)#86 | 4.7%(+2.78)#7,042 |
| 87. | Bon Aqua Junction | 7.4% | 4.2%(+3.24)#87 | 4.7%(+2.71)#7,124 |
| 88. | Lewisburg | 7.3% | 4.2%(+3.18)#88 | 4.7%(+2.65)#7,195 |
| 89. | Adamsville | 7.3% | 4.2%(+3.18)#89 | 4.7%(+2.65)#7,197 |
| 90. | Darden | 7.3% | 4.2%(+3.18)#90 | 4.7%(+2.65)#7,204 |
| 91. | Benton | 7.2% | 4.2%(+3.08)#91 | 4.7%(+2.55)#7,336 |
| 92. | Blountville | 7.2% | 4.2%(+3.08)#92 | 4.7%(+2.55)#7,342 |
| 93. | Spurgeon | 7.2% | 4.2%(+3.04)#93 | 4.7%(+2.51)#7,392 |
| 94. | Algood | 7.2% | 4.2%(+3.03)#94 | 4.7%(+2.49)#7,400 |
| 95. | Gates | 7.2% | 4.2%(+3.02)#95 | 4.7%(+2.49)#7,412 |
| 96. | Clarksville | 7.1% | 4.2%(+2.99)#96 | 4.7%(+2.46)#7,474 |
| 97. | Green Hill | 7.0% | 4.2%(+2.90)#97 | 4.7%(+2.36)#7,602 |
| 98. | Graball | 7.0% | 4.2%(+2.89)#98 | 4.7%(+2.36)#7,617 |
| 99. | Parker S Crossroads | 7.0% | 4.2%(+2.80)#99 | 4.7%(+2.27)#7,731 |
| 100. | Butler | 6.9% | 4.2%(+2.78)#100 | 4.7%(+2.25)#7,764 |
Common Questions
What are the Top 10 Cities with the Highest Percentage of Population Employed in Public Administration in Tennessee?
Top 10 Cities with the Highest Percentage of Population Employed in Public Administration in Tennessee are:
What city has the Highest Percentage of Population Employed in Public Administration in Tennessee?
Robbins has the Highest Percentage of Population Employed in Public Administration in Tennessee with 37.5%.
What is the Percentage of Population Employed in Public Administration in the State of Tennessee?
Percentage of Population Employed in Public Administration in Tennessee is 4.2%.
What is the Percentage of Population Employed in Public Administration in the United States?
Percentage of Population Employed in Public Administration in the United States is 4.7%.