Cities with the Highest Percentage of Population Employed in Public Administration in West Virginia
RELATED REPORTS & OPTIONS
Public Administration
West Virginia
Compare Cities
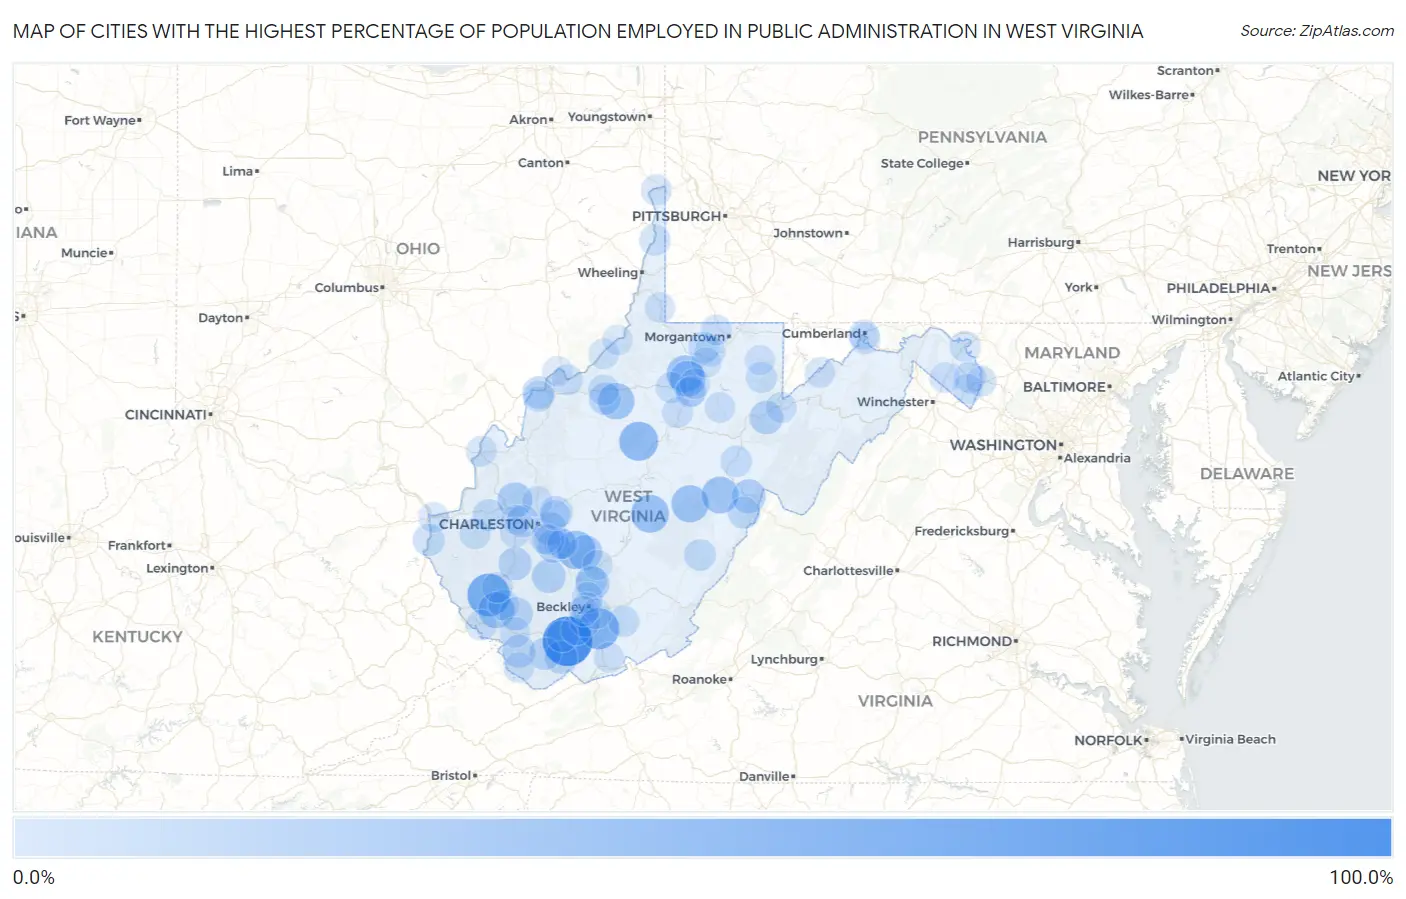
Map of Cities with the Highest Percentage of Population Employed in Public Administration in West Virginia
0.0%
100.0%
Cities with the Highest Percentage of Population Employed in Public Administration in West Virginia
| City | % Employed | vs State | vs National | |
| 1. | Bud | 100.0% | 6.8%(+93.2)#1 | 4.7%(+95.3)#7 |
| 2. | Verdunville | 67.7% | 6.8%(+60.9)#2 | 4.7%(+63.1)#64 |
| 3. | Ghent | 59.2% | 6.8%(+52.4)#3 | 4.7%(+54.6)#86 |
| 4. | Sand Fork | 50.0% | 6.8%(+43.2)#4 | 4.7%(+45.3)#133 |
| 5. | Smithers | 46.6% | 6.8%(+39.8)#5 | 4.7%(+41.9)#173 |
| 6. | Tioga | 45.2% | 6.8%(+38.4)#6 | 4.7%(+40.5)#183 |
| 7. | Bergoo | 41.7% | 6.8%(+34.8)#7 | 4.7%(+37.0)#238 |
| 8. | Lumberport | 40.9% | 6.8%(+34.0)#8 | 4.7%(+36.2)#252 |
| 9. | Valley Head | 40.0% | 6.8%(+33.2)#9 | 4.7%(+35.3)#263 |
| 10. | Pullman | 38.7% | 6.8%(+31.9)#10 | 4.7%(+34.0)#280 |
| 11. | Omar | 36.7% | 6.8%(+29.9)#11 | 4.7%(+32.0)#316 |
| 12. | Spelter | 35.9% | 6.8%(+29.1)#12 | 4.7%(+31.2)#330 |
| 13. | Bancroft | 31.7% | 6.8%(+24.8)#13 | 4.7%(+27.0)#425 |
| 14. | Glen Ferris | 30.6% | 6.8%(+23.8)#14 | 4.7%(+25.9)#462 |
| 15. | Peach Creek | 28.6% | 6.8%(+21.8)#15 | 4.7%(+23.9)#539 |
| 16. | Reynoldsville | 27.9% | 6.8%(+21.0)#16 | 4.7%(+23.2)#573 |
| 17. | Bartow | 27.5% | 6.8%(+20.7)#17 | 4.7%(+22.8)#590 |
| 18. | Hilltop | 26.5% | 6.8%(+19.7)#18 | 4.7%(+21.8)#639 |
| 19. | Booth | 26.3% | 6.8%(+19.5)#19 | 4.7%(+21.6)#647 |
| 20. | Whitesville | 26.3% | 6.8%(+19.4)#20 | 4.7%(+21.6)#651 |
| 21. | Hendricks | 25.0% | 6.8%(+18.2)#21 | 4.7%(+20.3)#724 |
| 22. | Chelyan | 23.9% | 6.8%(+17.1)#22 | 4.7%(+19.2)#831 |
| 23. | Mallory | 23.9% | 6.8%(+17.0)#23 | 4.7%(+19.2)#834 |
| 24. | Danville | 23.6% | 6.8%(+16.8)#24 | 4.7%(+18.9)#851 |
| 25. | Iaeger | 22.9% | 6.8%(+16.0)#25 | 4.7%(+18.2)#908 |
| 26. | Sprague | 22.7% | 6.8%(+15.9)#26 | 4.7%(+18.0)#918 |
| 27. | Raymond | 22.2% | 6.8%(+15.4)#27 | 4.7%(+17.5)#963 |
| 28. | Northfork | 21.7% | 6.8%(+14.9)#28 | 4.7%(+17.1)#999 |
| 29. | Coal Fork | 21.6% | 6.8%(+14.7)#29 | 4.7%(+16.9)#1,011 |
| 30. | Elkview | 21.0% | 6.8%(+14.2)#30 | 4.7%(+16.3)#1,083 |
| 31. | Welch | 20.5% | 6.8%(+13.7)#31 | 4.7%(+15.8)#1,132 |
| 32. | Blennerhassett | 20.4% | 6.8%(+13.6)#32 | 4.7%(+15.7)#1,141 |
| 33. | Jefferson | 19.8% | 6.8%(+13.0)#33 | 4.7%(+15.1)#1,230 |
| 34. | Harrisville | 19.5% | 6.8%(+12.7)#34 | 4.7%(+14.8)#1,262 |
| 35. | Green Bank | 18.8% | 6.8%(+11.9)#35 | 4.7%(+14.1)#1,375 |
| 36. | Culloden | 17.7% | 6.8%(+10.9)#36 | 4.7%(+13.0)#1,527 |
| 37. | Prichard | 17.6% | 6.8%(+10.8)#37 | 4.7%(+13.0)#1,534 |
| 38. | Hillsboro | 17.4% | 6.8%(+10.6)#38 | 4.7%(+12.7)#1,586 |
| 39. | Itmann | 17.3% | 6.8%(+10.5)#39 | 4.7%(+12.6)#1,605 |
| 40. | Shenandoah Junction | 17.1% | 6.8%(+10.3)#40 | 4.7%(+12.4)#1,649 |
| 41. | East Dailey | 16.0% | 6.8%(+9.17)#41 | 4.7%(+11.3)#1,867 |
| 42. | Scarbro | 15.7% | 6.8%(+8.87)#42 | 4.7%(+11.0)#1,939 |
| 43. | Grant Town | 15.4% | 6.8%(+8.62)#43 | 4.7%(+10.8)#1,997 |
| 44. | Hinton | 15.3% | 6.8%(+8.44)#44 | 4.7%(+10.6)#2,046 |
| 45. | Crooked Creek | 15.1% | 6.8%(+8.30)#45 | 4.7%(+10.4)#2,088 |
| 46. | Wellsburg | 14.9% | 6.8%(+8.07)#46 | 4.7%(+10.2)#2,157 |
| 47. | Wolf Summit | 14.9% | 6.8%(+8.07)#47 | 4.7%(+10.2)#2,159 |
| 48. | Rowlesburg | 14.7% | 6.8%(+7.85)#48 | 4.7%(+9.98)#2,222 |
| 49. | East Bank | 14.5% | 6.8%(+7.66)#49 | 4.7%(+9.80)#2,285 |
| 50. | Lubeck | 14.5% | 6.8%(+7.65)#50 | 4.7%(+9.79)#2,292 |
| 51. | Coal City | 14.4% | 6.8%(+7.54)#51 | 4.7%(+9.68)#2,325 |
| 52. | Neibert | 14.1% | 6.8%(+7.27)#52 | 4.7%(+9.41)#2,444 |
| 53. | Prosperity | 13.8% | 6.8%(+6.97)#53 | 4.7%(+9.11)#2,538 |
| 54. | Belle | 13.8% | 6.8%(+6.94)#54 | 4.7%(+9.07)#2,556 |
| 55. | Rivesville | 13.6% | 6.8%(+6.82)#55 | 4.7%(+8.95)#2,600 |
| 56. | Ellenboro | 13.6% | 6.8%(+6.82)#56 | 4.7%(+8.95)#2,604 |
| 57. | Wiley Ford | 13.6% | 6.8%(+6.80)#57 | 4.7%(+8.93)#2,614 |
| 58. | Thomas | 13.4% | 6.8%(+6.54)#58 | 4.7%(+8.68)#2,723 |
| 59. | Falling Waters | 13.3% | 6.8%(+6.48)#59 | 4.7%(+8.61)#2,750 |
| 60. | Jane Lew | 13.2% | 6.8%(+6.35)#60 | 4.7%(+8.48)#2,787 |
| 61. | Newell | 13.2% | 6.8%(+6.34)#61 | 4.7%(+8.47)#2,791 |
| 62. | Waverly | 13.2% | 6.8%(+6.34)#62 | 4.7%(+8.47)#2,792 |
| 63. | Mitchell Heights | 13.1% | 6.8%(+6.27)#63 | 4.7%(+8.40)#2,821 |
| 64. | Cassville | 13.1% | 6.8%(+6.26)#64 | 4.7%(+8.40)#2,822 |
| 65. | Point Pleasant | 13.1% | 6.8%(+6.24)#65 | 4.7%(+8.38)#2,828 |
| 66. | West Hamlin | 12.9% | 6.8%(+6.12)#66 | 4.7%(+8.26)#2,870 |
| 67. | Red Jacket | 12.9% | 6.8%(+6.08)#67 | 4.7%(+8.22)#2,880 |
| 68. | Philippi | 12.7% | 6.8%(+5.90)#68 | 4.7%(+8.04)#2,938 |
| 69. | Dupont | 12.4% | 6.8%(+5.55)#69 | 4.7%(+7.69)#3,078 |
| 70. | Bradshaw | 12.3% | 6.8%(+5.51)#70 | 4.7%(+7.64)#3,091 |
| 71. | Ridgeley | 12.3% | 6.8%(+5.46)#71 | 4.7%(+7.60)#3,114 |
| 72. | Rhodell | 12.3% | 6.8%(+5.46)#72 | 4.7%(+7.60)#3,116 |
| 73. | Friendly | 12.2% | 6.8%(+5.38)#73 | 4.7%(+7.51)#3,173 |
| 74. | Marmet | 12.2% | 6.8%(+5.37)#74 | 4.7%(+7.51)#3,176 |
| 75. | Stonewood | 12.2% | 6.8%(+5.37)#75 | 4.7%(+7.50)#3,177 |
| 76. | Anmoore | 12.0% | 6.8%(+5.16)#76 | 4.7%(+7.30)#3,274 |
| 77. | Ceredo | 12.0% | 6.8%(+5.14)#77 | 4.7%(+7.27)#3,286 |
| 78. | East View | 11.9% | 6.8%(+5.10)#78 | 4.7%(+7.23)#3,303 |
| 79. | Harpers Ferry | 11.9% | 6.8%(+5.03)#79 | 4.7%(+7.17)#3,338 |
| 80. | Bridgeport | 11.8% | 6.8%(+5.02)#80 | 4.7%(+7.16)#3,340 |
| 81. | Mabscott | 11.8% | 6.8%(+4.97)#81 | 4.7%(+7.10)#3,366 |
| 82. | Inwood | 11.7% | 6.8%(+4.91)#82 | 4.7%(+7.05)#3,396 |
| 83. | Justice | 11.7% | 6.8%(+4.85)#83 | 4.7%(+6.98)#3,430 |
| 84. | Greenville | 11.6% | 6.8%(+4.75)#84 | 4.7%(+6.89)#3,490 |
| 85. | Daniels | 11.6% | 6.8%(+4.74)#85 | 4.7%(+6.87)#3,496 |
| 86. | Sissonville | 11.5% | 6.8%(+4.70)#86 | 4.7%(+6.83)#3,524 |
| 87. | Glasgow | 11.5% | 6.8%(+4.68)#87 | 4.7%(+6.81)#3,536 |
| 88. | Elk Garden | 11.4% | 6.8%(+4.57)#88 | 4.7%(+6.71)#3,588 |
| 89. | Cameron | 11.2% | 6.8%(+4.42)#89 | 4.7%(+6.56)#3,668 |
| 90. | Alum Creek | 11.1% | 6.8%(+4.33)#90 | 4.7%(+6.46)#3,708 |
| 91. | Crab Orchard | 11.1% | 6.8%(+4.29)#91 | 4.7%(+6.43)#3,722 |
| 92. | Pinch | 11.0% | 6.8%(+4.21)#92 | 4.7%(+6.34)#3,794 |
| 93. | Athens | 10.9% | 6.8%(+4.05)#93 | 4.7%(+6.18)#3,885 |
| 94. | Paden City | 10.8% | 6.8%(+3.94)#94 | 4.7%(+6.08)#3,954 |
| 95. | Pleasant Valley | 10.5% | 6.8%(+3.63)#95 | 4.7%(+5.77)#4,169 |
| 96. | Kingwood | 10.3% | 6.8%(+3.51)#96 | 4.7%(+5.65)#4,248 |
| 97. | Charles Town | 10.3% | 6.8%(+3.51)#97 | 4.7%(+5.64)#4,251 |
| 98. | Williamstown | 10.3% | 6.8%(+3.51)#98 | 4.7%(+5.64)#4,252 |
| 99. | St Albans | 10.2% | 6.8%(+3.36)#99 | 4.7%(+5.49)#4,356 |
| 100. | Fayetteville | 10.2% | 6.8%(+3.35)#100 | 4.7%(+5.48)#4,366 |
Common Questions
What are the Top 10 Cities with the Highest Percentage of Population Employed in Public Administration in West Virginia?
Top 10 Cities with the Highest Percentage of Population Employed in Public Administration in West Virginia are:
#1
100.0%
#2
67.7%
#3
59.2%
#4
50.0%
#5
46.6%
#6
45.2%
#7
41.7%
#8
40.9%
#9
40.0%
#10
38.7%
What city has the Highest Percentage of Population Employed in Public Administration in West Virginia?
Bud has the Highest Percentage of Population Employed in Public Administration in West Virginia with 100.0%.
What is the Percentage of Population Employed in Public Administration in the State of West Virginia?
Percentage of Population Employed in Public Administration in West Virginia is 6.8%.
What is the Percentage of Population Employed in Public Administration in the United States?
Percentage of Population Employed in Public Administration in the United States is 4.7%.