Cities with the Highest Percentage of Population Employed in Public Administration in Illinois
RELATED REPORTS & OPTIONS
Public Administration
Illinois
Compare Cities
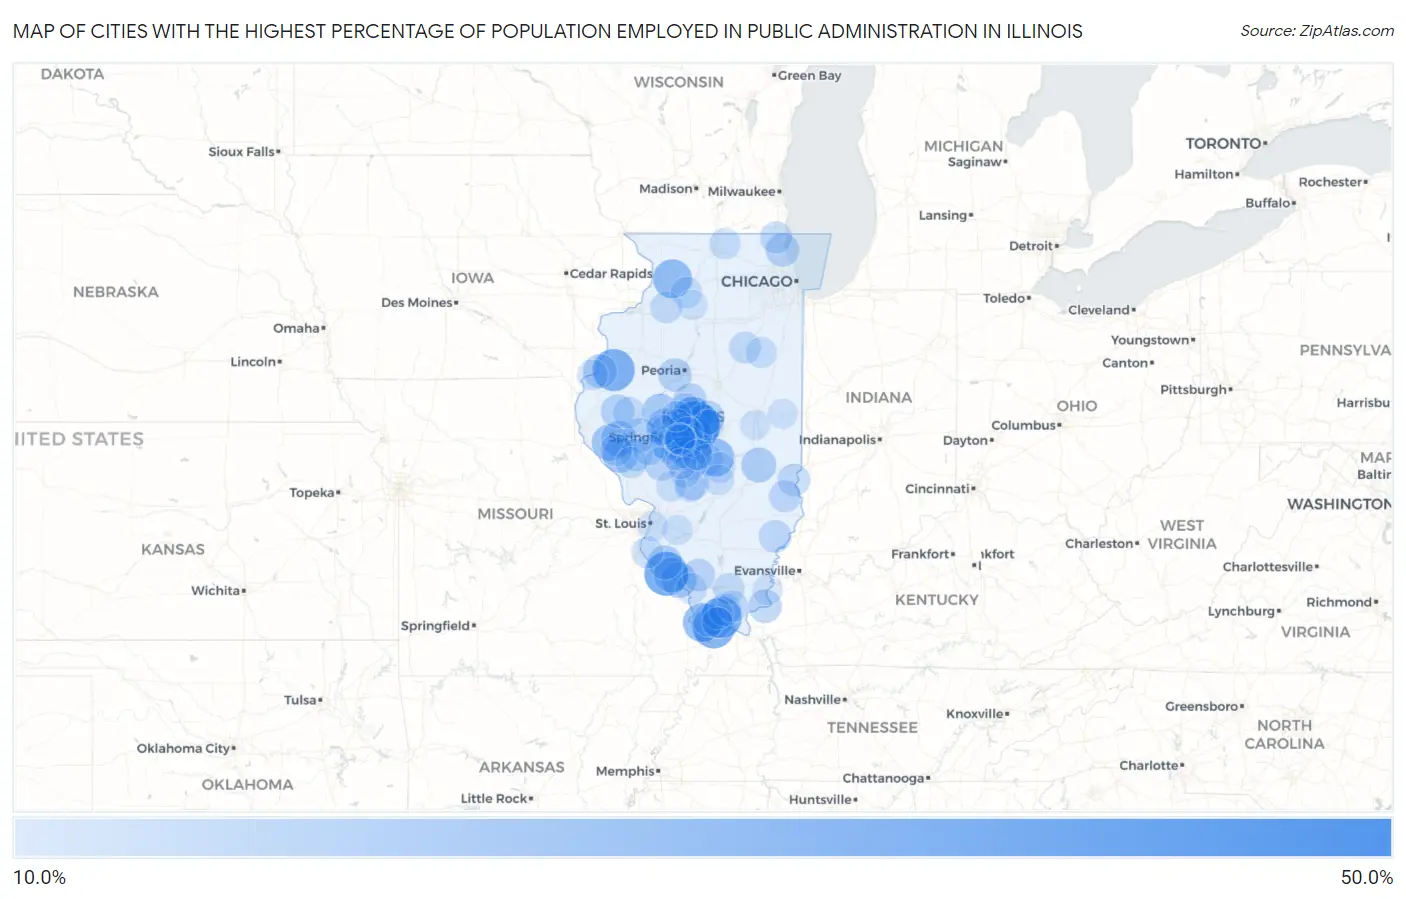
Map of Cities with the Highest Percentage of Population Employed in Public Administration in Illinois
0.0%
50.0%
Cities with the Highest Percentage of Population Employed in Public Administration in Illinois
| City | % Employed | vs State | vs National | |
| 1. | Cornland | 42.5% | 3.7%(+38.8)#1 | 4.7%(+37.8)#229 |
| 2. | Literberry | 36.5% | 3.7%(+32.8)#2 | 4.7%(+31.8)#323 |
| 3. | Kaskaskia | 33.3% | 3.7%(+29.6)#3 | 4.7%(+28.6)#377 |
| 4. | Carman | 32.4% | 3.7%(+28.7)#4 | 4.7%(+27.7)#403 |
| 5. | Unity | 31.0% | 3.7%(+27.3)#5 | 4.7%(+26.3)#446 |
| 6. | Raritan | 30.4% | 3.7%(+26.6)#6 | 4.7%(+25.7)#467 |
| 7. | Olmsted | 30.1% | 3.7%(+26.4)#7 | 4.7%(+25.4)#482 |
| 8. | Belknap | 29.4% | 3.7%(+25.7)#8 | 4.7%(+24.7)#502 |
| 9. | Broadwell | 28.6% | 3.7%(+24.9)#9 | 4.7%(+23.9)#536 |
| 10. | Blairsville | 28.4% | 3.7%(+24.7)#10 | 4.7%(+23.7)#545 |
| 11. | Adams | 28.2% | 3.7%(+24.5)#11 | 4.7%(+23.5)#556 |
| 12. | Plum Valley | 26.3% | 3.7%(+22.5)#12 | 4.7%(+21.6)#650 |
| 13. | Tamms | 25.9% | 3.7%(+22.2)#13 | 4.7%(+21.3)#666 |
| 14. | Coleta | 25.6% | 3.7%(+21.9)#14 | 4.7%(+20.9)#687 |
| 15. | Assumption | 24.4% | 3.7%(+20.7)#15 | 4.7%(+19.7)#783 |
| 16. | Gulfport | 23.9% | 3.7%(+20.2)#16 | 4.7%(+19.2)#826 |
| 17. | Tovey | 23.1% | 3.7%(+19.4)#17 | 4.7%(+18.4)#887 |
| 18. | Baylis | 21.5% | 3.7%(+17.8)#18 | 4.7%(+16.9)#1,012 |
| 19. | Perry | 20.2% | 3.7%(+16.4)#19 | 4.7%(+15.5)#1,167 |
| 20. | Tallula | 20.0% | 3.7%(+16.3)#20 | 4.7%(+15.3)#1,180 |
| 21. | Rockwood | 20.0% | 3.7%(+16.3)#21 | 4.7%(+15.3)#1,205 |
| 22. | Time | 20.0% | 3.7%(+16.3)#22 | 4.7%(+15.3)#1,206 |
| 23. | Kilbourne | 19.8% | 3.7%(+16.1)#23 | 4.7%(+15.1)#1,225 |
| 24. | Chester | 19.7% | 3.7%(+15.9)#24 | 4.7%(+15.0)#1,246 |
| 25. | Lerna | 19.3% | 3.7%(+15.6)#25 | 4.7%(+14.6)#1,294 |
| 26. | Mechanicsburg | 19.3% | 3.7%(+15.6)#26 | 4.7%(+14.6)#1,296 |
| 27. | Buffalo | 18.5% | 3.7%(+14.7)#27 | 4.7%(+13.8)#1,403 |
| 28. | Evansville | 18.2% | 3.7%(+14.5)#28 | 4.7%(+13.5)#1,444 |
| 29. | Concord | 18.2% | 3.7%(+14.5)#29 | 4.7%(+13.5)#1,450 |
| 30. | Lomax | 17.9% | 3.7%(+14.1)#30 | 4.7%(+13.2)#1,506 |
| 31. | Loami | 17.8% | 3.7%(+14.1)#31 | 4.7%(+13.1)#1,516 |
| 32. | Mount Pulaski | 17.7% | 3.7%(+14.0)#32 | 4.7%(+13.0)#1,524 |
| 33. | New Berlin | 17.5% | 3.7%(+13.8)#33 | 4.7%(+12.9)#1,568 |
| 34. | Chestnut | 17.5% | 3.7%(+13.8)#34 | 4.7%(+12.8)#1,572 |
| 35. | Camden | 17.4% | 3.7%(+13.7)#35 | 4.7%(+12.7)#1,587 |
| 36. | Knollwood | 17.1% | 3.7%(+13.4)#36 | 4.7%(+12.5)#1,638 |
| 37. | Cave In Rock | 17.1% | 3.7%(+13.4)#37 | 4.7%(+12.4)#1,650 |
| 38. | Palmyra | 16.9% | 3.7%(+13.2)#38 | 4.7%(+12.2)#1,684 |
| 39. | Lake Camelot | 16.9% | 3.7%(+13.2)#39 | 4.7%(+12.2)#1,688 |
| 40. | Emden | 16.8% | 3.7%(+13.0)#40 | 4.7%(+12.1)#1,706 |
| 41. | Ullin | 16.6% | 3.7%(+12.9)#41 | 4.7%(+11.9)#1,746 |
| 42. | Smithville | 16.5% | 3.7%(+12.8)#42 | 4.7%(+11.8)#1,757 |
| 43. | Edinburg | 16.4% | 3.7%(+12.7)#43 | 4.7%(+11.7)#1,778 |
| 44. | Schram City | 16.1% | 3.7%(+12.4)#44 | 4.7%(+11.4)#1,841 |
| 45. | Sherman | 16.1% | 3.7%(+12.3)#45 | 4.7%(+11.4)#1,852 |
| 46. | Vergennes | 15.8% | 3.7%(+12.1)#46 | 4.7%(+11.1)#1,899 |
| 47. | Chatham | 15.8% | 3.7%(+12.1)#47 | 4.7%(+11.1)#1,920 |
| 48. | West Union | 15.7% | 3.7%(+12.0)#48 | 4.7%(+11.0)#1,941 |
| 49. | Bone Gap | 15.6% | 3.7%(+11.9)#49 | 4.7%(+10.9)#1,953 |
| 50. | Alsey | 15.6% | 3.7%(+11.9)#50 | 4.7%(+10.9)#1,955 |
| 51. | Vienna | 15.5% | 3.7%(+11.8)#51 | 4.7%(+10.8)#1,989 |
| 52. | Rochester | 15.3% | 3.7%(+11.6)#52 | 4.7%(+10.6)#2,033 |
| 53. | Auburn | 15.2% | 3.7%(+11.5)#53 | 4.7%(+10.5)#2,065 |
| 54. | Old Mill Creek | 15.1% | 3.7%(+11.4)#54 | 4.7%(+10.4)#2,092 |
| 55. | Stoy | 15.1% | 3.7%(+11.3)#55 | 4.7%(+10.4)#2,100 |
| 56. | Pittsfield | 14.9% | 3.7%(+11.2)#56 | 4.7%(+10.2)#2,148 |
| 57. | Pleasant Plains | 14.8% | 3.7%(+11.1)#57 | 4.7%(+10.1)#2,170 |
| 58. | Owaneco | 14.6% | 3.7%(+10.9)#58 | 4.7%(+9.96)#2,232 |
| 59. | Odell | 14.5% | 3.7%(+10.8)#59 | 4.7%(+9.83)#2,274 |
| 60. | New Holland | 14.4% | 3.7%(+10.7)#60 | 4.7%(+9.72)#2,308 |
| 61. | Crab Orchard | 14.4% | 3.7%(+10.7)#61 | 4.7%(+9.69)#2,318 |
| 62. | Athens | 14.3% | 3.7%(+10.6)#62 | 4.7%(+9.64)#2,334 |
| 63. | Hooppole | 14.3% | 3.7%(+10.6)#63 | 4.7%(+9.60)#2,360 |
| 64. | Nachusa | 14.3% | 3.7%(+10.6)#64 | 4.7%(+9.60)#2,366 |
| 65. | Maeystown | 14.3% | 3.7%(+10.6)#65 | 4.7%(+9.60)#2,371 |
| 66. | Simpson | 14.3% | 3.7%(+10.6)#66 | 4.7%(+9.60)#2,380 |
| 67. | Leland Grove | 14.1% | 3.7%(+10.4)#67 | 4.7%(+9.39)#2,449 |
| 68. | Rushville | 14.0% | 3.7%(+10.3)#68 | 4.7%(+9.33)#2,465 |
| 69. | Pawnee | 14.0% | 3.7%(+10.3)#69 | 4.7%(+9.33)#2,466 |
| 70. | Springfield | 13.8% | 3.7%(+10.1)#70 | 4.7%(+9.14)#2,528 |
| 71. | Hillview | 13.8% | 3.7%(+10.1)#71 | 4.7%(+9.11)#2,542 |
| 72. | Harmon | 13.8% | 3.7%(+10.1)#72 | 4.7%(+9.11)#2,545 |
| 73. | Taylor Springs | 13.7% | 3.7%(+10.00)#73 | 4.7%(+9.03)#2,571 |
| 74. | Cypress | 13.6% | 3.7%(+9.92)#74 | 4.7%(+8.95)#2,603 |
| 75. | Kempton | 13.6% | 3.7%(+9.84)#75 | 4.7%(+8.87)#2,639 |
| 76. | Ashland | 13.5% | 3.7%(+9.83)#76 | 4.7%(+8.86)#2,644 |
| 77. | Candlewick Lake | 13.5% | 3.7%(+9.81)#77 | 4.7%(+8.84)#2,651 |
| 78. | Woodson | 13.5% | 3.7%(+9.79)#78 | 4.7%(+8.83)#2,655 |
| 79. | Gorham | 13.4% | 3.7%(+9.71)#79 | 4.7%(+8.75)#2,692 |
| 80. | Latham | 13.4% | 3.7%(+9.70)#80 | 4.7%(+8.73)#2,700 |
| 81. | Spaulding | 13.3% | 3.7%(+9.63)#81 | 4.7%(+8.66)#2,726 |
| 82. | Southern View | 13.3% | 3.7%(+9.53)#82 | 4.7%(+8.57)#2,763 |
| 83. | Pontoosuc | 13.2% | 3.7%(+9.44)#83 | 4.7%(+8.47)#2,796 |
| 84. | Jerome | 13.1% | 3.7%(+9.40)#84 | 4.7%(+8.44)#2,809 |
| 85. | Tower Hill | 13.1% | 3.7%(+9.35)#85 | 4.7%(+8.38)#2,826 |
| 86. | Morrisonville | 13.1% | 3.7%(+9.35)#86 | 4.7%(+8.38)#2,827 |
| 87. | Raymond | 13.0% | 3.7%(+9.24)#87 | 4.7%(+8.27)#2,867 |
| 88. | Greenview | 12.7% | 3.7%(+9.02)#88 | 4.7%(+8.05)#2,932 |
| 89. | New Grand Chain | 12.7% | 3.7%(+9.01)#89 | 4.7%(+8.04)#2,935 |
| 90. | Sauget | 12.7% | 3.7%(+8.96)#90 | 4.7%(+7.99)#2,951 |
| 91. | Herrick | 12.7% | 3.7%(+8.95)#91 | 4.7%(+7.98)#2,955 |
| 92. | Farmersville | 12.5% | 3.7%(+8.82)#92 | 4.7%(+7.86)#2,995 |
| 93. | Langleyville | 12.5% | 3.7%(+8.78)#93 | 4.7%(+7.81)#3,017 |
| 94. | Old Shawneetown | 12.5% | 3.7%(+8.78)#94 | 4.7%(+7.81)#3,025 |
| 95. | Cable | 12.5% | 3.7%(+8.78)#95 | 4.7%(+7.81)#3,032 |
| 96. | Gillespie | 12.3% | 3.7%(+8.60)#96 | 4.7%(+7.63)#3,099 |
| 97. | New Baden | 12.2% | 3.7%(+8.50)#97 | 4.7%(+7.53)#3,148 |
| 98. | Fithian | 12.2% | 3.7%(+8.44)#98 | 4.7%(+7.48)#3,191 |
| 99. | Sadorus | 12.1% | 3.7%(+8.35)#99 | 4.7%(+7.38)#3,239 |
| 100. | Ohio | 11.9% | 3.7%(+8.23)#100 | 4.7%(+7.26)#3,292 |
Common Questions
What are the Top 10 Cities with the Highest Percentage of Population Employed in Public Administration in Illinois?
Top 10 Cities with the Highest Percentage of Population Employed in Public Administration in Illinois are:
What city has the Highest Percentage of Population Employed in Public Administration in Illinois?
Cornland has the Highest Percentage of Population Employed in Public Administration in Illinois with 42.5%.
What is the Percentage of Population Employed in Public Administration in the State of Illinois?
Percentage of Population Employed in Public Administration in Illinois is 3.7%.
What is the Percentage of Population Employed in Public Administration in the United States?
Percentage of Population Employed in Public Administration in the United States is 4.7%.