Cities with the Highest Percentage of Population Employed in Public Administration in Virginia
RELATED REPORTS & OPTIONS
Public Administration
Virginia
Compare Cities
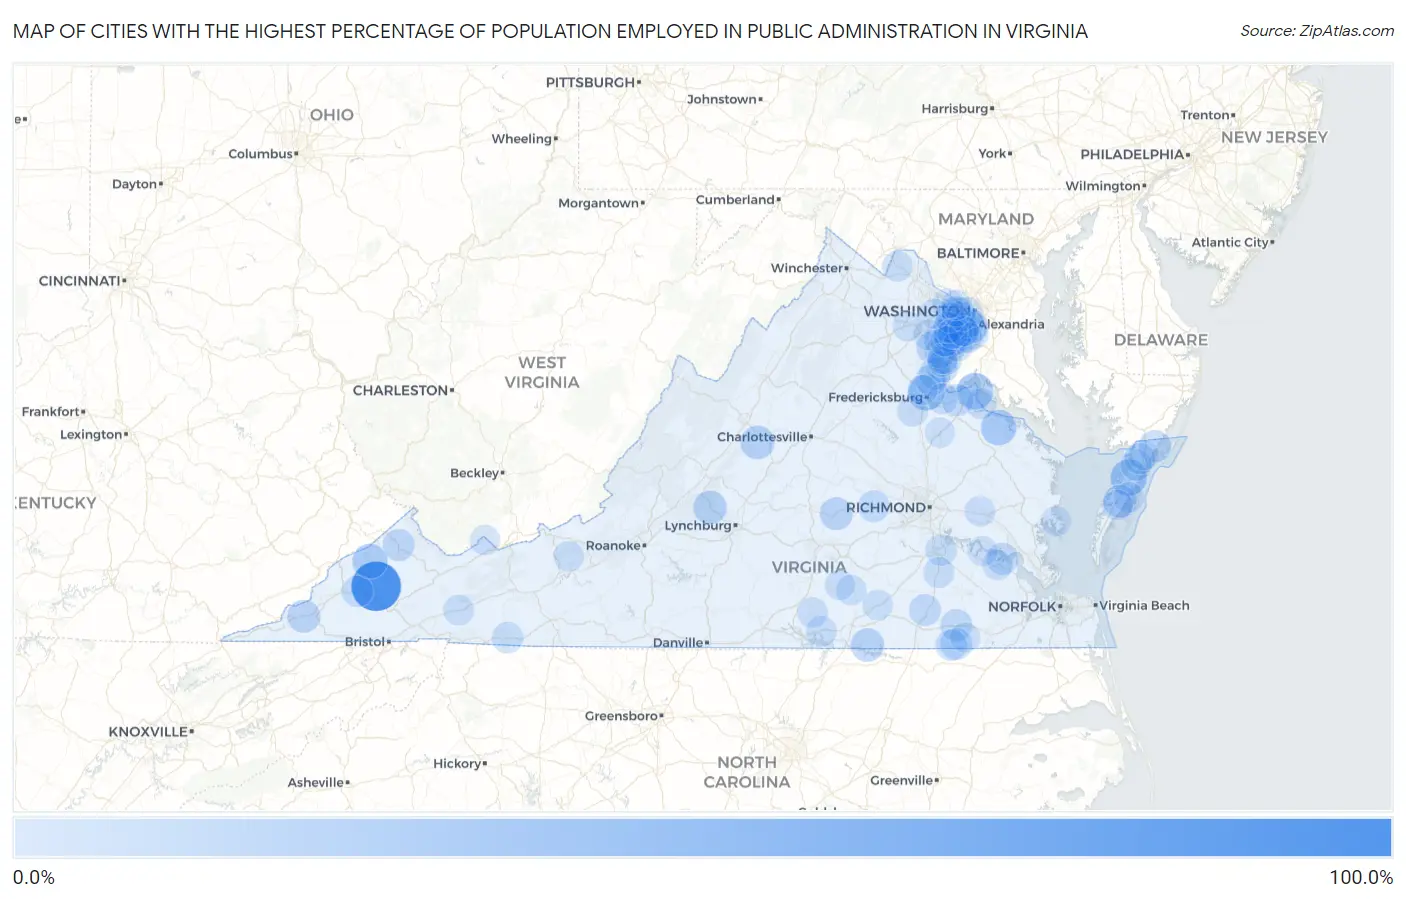
Map of Cities with the Highest Percentage of Population Employed in Public Administration in Virginia
0.0%
100.0%
Cities with the Highest Percentage of Population Employed in Public Administration in Virginia
| City | % Employed | vs State | vs National | |
| 1. | Dante | 91.7% | 8.9%(+82.8)#1 | 4.7%(+87.0)#34 |
| 2. | Dahlgren Center | 39.0% | 8.9%(+30.1)#2 | 4.7%(+34.4)#272 |
| 3. | Greenbush | 38.6% | 8.9%(+29.7)#3 | 4.7%(+34.0)#283 |
| 4. | Falmouth | 37.3% | 8.9%(+28.3)#4 | 4.7%(+32.6)#311 |
| 5. | Weems | 36.7% | 8.9%(+27.8)#5 | 4.7%(+32.0)#317 |
| 6. | Montross | 34.6% | 8.9%(+25.7)#6 | 4.7%(+29.9)#347 |
| 7. | Locust Mount | 33.0% | 8.9%(+24.1)#7 | 4.7%(+28.3)#389 |
| 8. | East Stone Gap | 32.9% | 8.9%(+24.0)#8 | 4.7%(+28.2)#393 |
| 9. | Clinchco | 31.9% | 8.9%(+23.0)#9 | 4.7%(+27.2)#419 |
| 10. | Kincora | 27.9% | 8.9%(+19.0)#10 | 4.7%(+23.2)#571 |
| 11. | Sherando | 27.0% | 8.9%(+18.1)#11 | 4.7%(+22.3)#610 |
| 12. | Big Island | 26.9% | 8.9%(+18.0)#12 | 4.7%(+22.2)#618 |
| 13. | Ebony | 25.9% | 8.9%(+17.0)#13 | 4.7%(+21.2)#667 |
| 14. | Dinwiddie | 25.5% | 8.9%(+16.6)#14 | 4.7%(+20.8)#690 |
| 15. | Mappsburg | 25.0% | 8.9%(+16.1)#15 | 4.7%(+20.3)#742 |
| 16. | Port Republic | 24.4% | 8.9%(+15.5)#16 | 4.7%(+19.7)#785 |
| 17. | Dryden | 24.2% | 8.9%(+15.3)#17 | 4.7%(+19.5)#798 |
| 18. | Cumberland | 24.2% | 8.9%(+15.3)#18 | 4.7%(+19.5)#800 |
| 19. | Kingstowne | 22.8% | 8.9%(+13.9)#19 | 4.7%(+18.2)#909 |
| 20. | Franconia | 22.7% | 8.9%(+13.8)#20 | 4.7%(+18.0)#919 |
| 21. | Laurel Hill | 22.6% | 8.9%(+13.7)#21 | 4.7%(+18.0)#924 |
| 22. | Occoquan | 22.6% | 8.9%(+13.7)#22 | 4.7%(+17.9)#926 |
| 23. | Horntown | 21.8% | 8.9%(+12.9)#23 | 4.7%(+17.2)#992 |
| 24. | Independent Hill | 21.8% | 8.9%(+12.9)#24 | 4.7%(+17.2)#993 |
| 25. | Huntington | 21.7% | 8.9%(+12.8)#25 | 4.7%(+17.0)#1,003 |
| 26. | County Center | 21.4% | 8.9%(+12.5)#26 | 4.7%(+16.7)#1,028 |
| 27. | Grundy | 21.2% | 8.9%(+12.3)#27 | 4.7%(+16.5)#1,057 |
| 28. | Quantico Base | 21.2% | 8.9%(+12.3)#28 | 4.7%(+16.5)#1,060 |
| 29. | Scotland | 20.8% | 8.9%(+11.9)#29 | 4.7%(+16.1)#1,096 |
| 30. | Leesylvania | 20.8% | 8.9%(+11.9)#30 | 4.7%(+16.1)#1,097 |
| 31. | Capron | 20.7% | 8.9%(+11.8)#31 | 4.7%(+16.0)#1,107 |
| 32. | Jarratt | 20.7% | 8.9%(+11.7)#32 | 4.7%(+16.0)#1,113 |
| 33. | King George | 20.6% | 8.9%(+11.7)#33 | 4.7%(+15.9)#1,119 |
| 34. | Aquia Harbour | 20.6% | 8.9%(+11.7)#34 | 4.7%(+15.9)#1,124 |
| 35. | Boykins | 19.9% | 8.9%(+11.0)#35 | 4.7%(+15.2)#1,215 |
| 36. | Powhatan | 19.4% | 8.9%(+10.5)#36 | 4.7%(+14.7)#1,287 |
| 37. | Stafford Courthouse | 19.2% | 8.9%(+10.3)#37 | 4.7%(+14.5)#1,305 |
| 38. | Fort Belvoir | 18.9% | 8.9%(+10.0)#38 | 4.7%(+14.2)#1,353 |
| 39. | Fort Hunt | 18.9% | 8.9%(+9.99)#39 | 4.7%(+14.2)#1,356 |
| 40. | Coeburn | 18.7% | 8.9%(+9.78)#40 | 4.7%(+14.0)#1,379 |
| 41. | Branchville | 18.5% | 8.9%(+9.55)#41 | 4.7%(+13.8)#1,404 |
| 42. | Cherry Hill | 18.4% | 8.9%(+9.53)#42 | 4.7%(+13.7)#1,406 |
| 43. | Bloxom | 18.4% | 8.9%(+9.48)#43 | 4.7%(+13.7)#1,412 |
| 44. | Fort Lee | 18.3% | 8.9%(+9.39)#44 | 4.7%(+13.6)#1,427 |
| 45. | Independence | 18.2% | 8.9%(+9.25)#45 | 4.7%(+13.5)#1,464 |
| 46. | Montclair | 17.9% | 8.9%(+8.95)#46 | 4.7%(+13.2)#1,505 |
| 47. | Lorton | 17.7% | 8.9%(+8.76)#47 | 4.7%(+13.0)#1,532 |
| 48. | Hallwood | 17.6% | 8.9%(+8.66)#48 | 4.7%(+12.9)#1,558 |
| 49. | Baywood | 17.6% | 8.9%(+8.64)#49 | 4.7%(+12.9)#1,563 |
| 50. | Arlington | 17.3% | 8.9%(+8.43)#50 | 4.7%(+12.7)#1,598 |
| 51. | Belle Haven | 17.2% | 8.9%(+8.32)#51 | 4.7%(+12.5)#1,622 |
| 52. | South Run | 17.1% | 8.9%(+8.16)#52 | 4.7%(+12.4)#1,662 |
| 53. | West Springfield | 16.7% | 8.9%(+7.82)#53 | 4.7%(+12.0)#1,713 |
| 54. | Templeton | 16.4% | 8.9%(+7.49)#54 | 4.7%(+11.7)#1,783 |
| 55. | Passapatanzy | 16.3% | 8.9%(+7.35)#55 | 4.7%(+11.6)#1,809 |
| 56. | Mcmullin | 16.2% | 8.9%(+7.31)#56 | 4.7%(+11.5)#1,816 |
| 57. | Boydton | 16.2% | 8.9%(+7.27)#57 | 4.7%(+11.5)#1,823 |
| 58. | Rose Hill Cdp Fairfax County | 16.2% | 8.9%(+7.26)#58 | 4.7%(+11.5)#1,824 |
| 59. | Spotsylvania Courthouse | 16.2% | 8.9%(+7.26)#59 | 4.7%(+11.5)#1,825 |
| 60. | Hillsboro | 16.0% | 8.9%(+7.09)#60 | 4.7%(+11.3)#1,862 |
| 61. | Falls Church | 16.0% | 8.9%(+7.05)#61 | 4.7%(+11.3)#1,872 |
| 62. | Triangle | 15.9% | 8.9%(+7.01)#62 | 4.7%(+11.2)#1,879 |
| 63. | Alexandria | 15.8% | 8.9%(+6.93)#63 | 4.7%(+11.2)#1,897 |
| 64. | Buckhall | 15.8% | 8.9%(+6.85)#64 | 4.7%(+11.1)#1,922 |
| 65. | Merrifield | 15.7% | 8.9%(+6.81)#65 | 4.7%(+11.0)#1,931 |
| 66. | Colonial Beach | 15.7% | 8.9%(+6.80)#66 | 4.7%(+11.0)#1,935 |
| 67. | Mount Vernon | 15.7% | 8.9%(+6.77)#67 | 4.7%(+11.0)#1,943 |
| 68. | Belspring | 15.6% | 8.9%(+6.72)#68 | 4.7%(+10.9)#1,954 |
| 69. | Kings Park | 15.6% | 8.9%(+6.70)#69 | 4.7%(+10.9)#1,962 |
| 70. | Chase City | 15.5% | 8.9%(+6.64)#70 | 4.7%(+10.9)#1,973 |
| 71. | Crosspointe | 15.4% | 8.9%(+6.53)#71 | 4.7%(+10.8)#1,999 |
| 72. | Wachapreague | 15.3% | 8.9%(+6.40)#72 | 4.7%(+10.6)#2,035 |
| 73. | Cats Bridge | 15.3% | 8.9%(+6.35)#73 | 4.7%(+10.6)#2,050 |
| 74. | Newington | 15.2% | 8.9%(+6.33)#74 | 4.7%(+10.6)#2,054 |
| 75. | Lake Barcroft | 15.1% | 8.9%(+6.21)#75 | 4.7%(+10.4)#2,086 |
| 76. | Mason Neck | 15.1% | 8.9%(+6.21)#76 | 4.7%(+10.4)#2,087 |
| 77. | Burke | 15.1% | 8.9%(+6.20)#77 | 4.7%(+10.4)#2,089 |
| 78. | Mount Clifton | 15.1% | 8.9%(+6.19)#78 | 4.7%(+10.4)#2,091 |
| 79. | New Kent | 15.1% | 8.9%(+6.15)#79 | 4.7%(+10.4)#2,105 |
| 80. | Mantua | 15.0% | 8.9%(+6.11)#80 | 4.7%(+10.3)#2,117 |
| 81. | Kenbridge | 14.8% | 8.9%(+5.85)#81 | 4.7%(+10.1)#2,190 |
| 82. | Alberta | 14.7% | 8.9%(+5.84)#82 | 4.7%(+10.1)#2,202 |
| 83. | Surry | 14.7% | 8.9%(+5.77)#83 | 4.7%(+9.99)#2,219 |
| 84. | Pocahontas | 14.6% | 8.9%(+5.68)#84 | 4.7%(+9.90)#2,254 |
| 85. | Dumfries | 14.6% | 8.9%(+5.64)#85 | 4.7%(+9.86)#2,259 |
| 86. | Lake Ridge | 14.5% | 8.9%(+5.63)#86 | 4.7%(+9.85)#2,264 |
| 87. | Victoria | 14.5% | 8.9%(+5.58)#87 | 4.7%(+9.80)#2,282 |
| 88. | Temperanceville | 14.4% | 8.9%(+5.49)#88 | 4.7%(+9.71)#2,312 |
| 89. | Mathews | 14.3% | 8.9%(+5.43)#89 | 4.7%(+9.65)#2,332 |
| 90. | Claremont | 14.3% | 8.9%(+5.38)#90 | 4.7%(+9.60)#2,346 |
| 91. | Newsoms | 14.3% | 8.9%(+5.38)#91 | 4.7%(+9.60)#2,351 |
| 92. | Wolf Trap | 14.1% | 8.9%(+5.22)#92 | 4.7%(+9.45)#2,428 |
| 93. | Greenbriar | 14.1% | 8.9%(+5.18)#93 | 4.7%(+9.40)#2,445 |
| 94. | Gainesville | 14.0% | 8.9%(+5.14)#94 | 4.7%(+9.36)#2,458 |
| 95. | Southern Gateway | 14.0% | 8.9%(+5.09)#95 | 4.7%(+9.31)#2,470 |
| 96. | Bowling Green | 14.0% | 8.9%(+5.08)#96 | 4.7%(+9.30)#2,472 |
| 97. | Idylwood | 13.9% | 8.9%(+4.98)#97 | 4.7%(+9.20)#2,507 |
| 98. | Newington Forest | 13.8% | 8.9%(+4.90)#98 | 4.7%(+9.12)#2,533 |
| 99. | Hayfield | 13.8% | 8.9%(+4.89)#99 | 4.7%(+9.11)#2,536 |
| 100. | Mclean | 13.8% | 8.9%(+4.89)#100 | 4.7%(+9.11)#2,537 |
Common Questions
What are the Top 10 Cities with the Highest Percentage of Population Employed in Public Administration in Virginia?
Top 10 Cities with the Highest Percentage of Population Employed in Public Administration in Virginia are:
#1
91.7%
#2
39.0%
#3
38.6%
#4
37.3%
#5
34.6%
#6
31.9%
#7
27.0%
#8
26.9%
#9
25.9%
#10
25.0%
What city has the Highest Percentage of Population Employed in Public Administration in Virginia?
Dante has the Highest Percentage of Population Employed in Public Administration in Virginia with 91.7%.
What is the Percentage of Population Employed in Public Administration in the State of Virginia?
Percentage of Population Employed in Public Administration in Virginia is 8.9%.
What is the Percentage of Population Employed in Public Administration in the United States?
Percentage of Population Employed in Public Administration in the United States is 4.7%.