Cities with the Highest Percentage of Population Employed in Public Administration in Utah
RELATED REPORTS & OPTIONS
Public Administration
Utah
Compare Cities
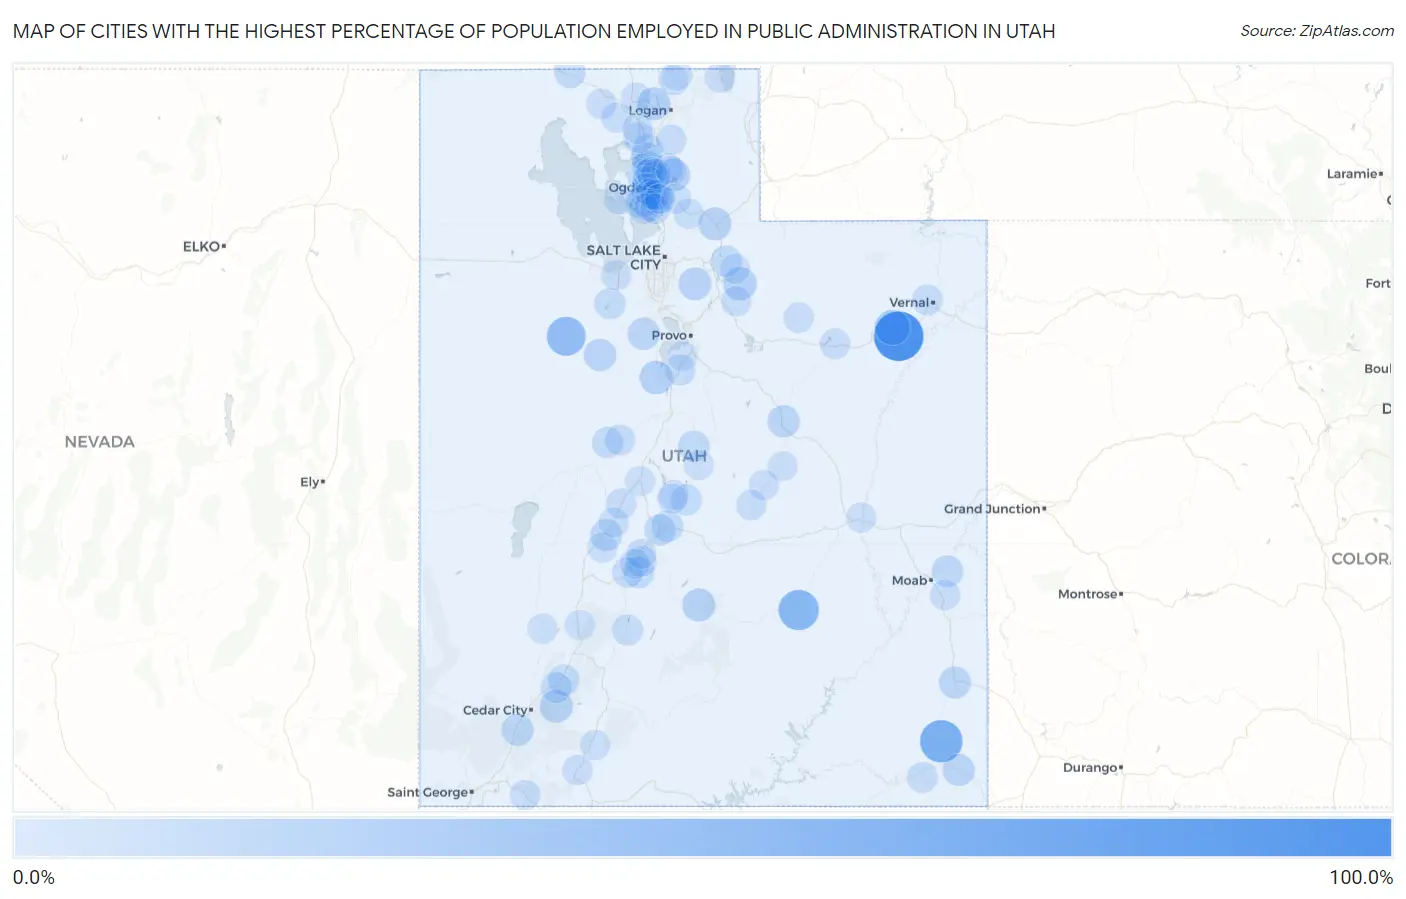
Map of Cities with the Highest Percentage of Population Employed in Public Administration in Utah
0.0%
100.0%
Cities with the Highest Percentage of Population Employed in Public Administration in Utah
| City | % Employed | vs State | vs National | |
| 1. | Randlett | 100.0% | 4.6%(+95.4)#1 | 4.7%(+95.3)#11 |
| 2. | White Mesa | 65.4% | 4.6%(+60.8)#2 | 4.7%(+60.7)#67 |
| 3. | Hanksville | 54.7% | 4.6%(+50.1)#3 | 4.7%(+50.1)#104 |
| 4. | Dugway | 47.8% | 4.6%(+43.2)#4 | 4.7%(+43.2)#165 |
| 5. | Lapoint | 43.8% | 4.6%(+39.1)#5 | 4.7%(+39.1)#205 |
| 6. | Fort Duchesne | 31.1% | 4.6%(+26.5)#6 | 4.7%(+26.4)#441 |
| 7. | Elberta | 22.7% | 4.6%(+18.0)#7 | 4.7%(+18.0)#920 |
| 8. | Woodland | 22.2% | 4.6%(+17.6)#8 | 4.7%(+17.5)#961 |
| 9. | Peter | 21.2% | 4.6%(+16.6)#9 | 4.7%(+16.5)#1,058 |
| 10. | Lyman | 20.8% | 4.6%(+16.2)#10 | 4.7%(+16.1)#1,099 |
| 11. | Echo | 20.5% | 4.6%(+15.9)#11 | 4.7%(+15.8)#1,129 |
| 12. | Brian Head | 20.0% | 4.6%(+15.4)#12 | 4.7%(+15.3)#1,195 |
| 13. | Eden | 19.4% | 4.6%(+14.8)#13 | 4.7%(+14.7)#1,274 |
| 14. | Alta | 19.3% | 4.6%(+14.7)#14 | 4.7%(+14.6)#1,302 |
| 15. | Vernon | 18.1% | 4.6%(+13.5)#15 | 4.7%(+13.4)#1,474 |
| 16. | Spring Glen | 17.6% | 4.6%(+13.0)#16 | 4.7%(+12.9)#1,550 |
| 17. | Fairfield | 17.3% | 4.6%(+12.7)#17 | 4.7%(+12.6)#1,607 |
| 18. | Monticello | 16.6% | 4.6%(+12.0)#18 | 4.7%(+11.9)#1,751 |
| 19. | Montezuma Creek | 16.4% | 4.6%(+11.8)#19 | 4.7%(+11.7)#1,777 |
| 20. | Kanarraville | 16.3% | 4.6%(+11.6)#20 | 4.7%(+11.6)#1,811 |
| 21. | Meadow | 15.7% | 4.6%(+11.1)#21 | 4.7%(+11.0)#1,940 |
| 22. | Castle Valley | 15.5% | 4.6%(+10.9)#22 | 4.7%(+10.8)#1,978 |
| 23. | Salina | 14.5% | 4.6%(+9.88)#23 | 4.7%(+9.80)#2,283 |
| 24. | Perry | 14.5% | 4.6%(+9.87)#24 | 4.7%(+9.80)#2,284 |
| 25. | West Point | 14.2% | 4.6%(+9.57)#25 | 4.7%(+9.50)#2,413 |
| 26. | Aurora | 13.8% | 4.6%(+9.18)#26 | 4.7%(+9.10)#2,549 |
| 27. | Snowville | 13.6% | 4.6%(+8.95)#27 | 4.7%(+8.87)#2,640 |
| 28. | Plain City | 13.4% | 4.6%(+8.83)#28 | 4.7%(+8.75)#2,691 |
| 29. | Wales | 13.3% | 4.6%(+8.67)#29 | 4.7%(+8.60)#2,754 |
| 30. | Farr West | 13.1% | 4.6%(+8.51)#30 | 4.7%(+8.43)#2,811 |
| 31. | South Ogden | 13.1% | 4.6%(+8.49)#31 | 4.7%(+8.41)#2,818 |
| 32. | Clinton | 13.0% | 4.6%(+8.39)#32 | 4.7%(+8.32)#2,850 |
| 33. | Peoa | 12.9% | 4.6%(+8.25)#33 | 4.7%(+8.17)#2,895 |
| 34. | Monroe | 12.6% | 4.6%(+8.02)#34 | 4.7%(+7.94)#2,966 |
| 35. | South Willard | 12.6% | 4.6%(+8.01)#35 | 4.7%(+7.94)#2,968 |
| 36. | Stockton | 12.5% | 4.6%(+7.89)#36 | 4.7%(+7.81)#3,009 |
| 37. | Harrisville | 12.4% | 4.6%(+7.79)#37 | 4.7%(+7.72)#3,066 |
| 38. | Paragonah | 12.1% | 4.6%(+7.54)#38 | 4.7%(+7.46)#3,197 |
| 39. | Parowan | 12.0% | 4.6%(+7.43)#39 | 4.7%(+7.35)#3,250 |
| 40. | Mayfield | 12.0% | 4.6%(+7.39)#40 | 4.7%(+7.31)#3,263 |
| 41. | Lynndyl | 12.0% | 4.6%(+7.39)#41 | 4.7%(+7.31)#3,265 |
| 42. | Central Valley | 11.7% | 4.6%(+7.09)#42 | 4.7%(+7.01)#3,418 |
| 43. | Spring Lake | 11.3% | 4.6%(+6.73)#43 | 4.7%(+6.65)#3,618 |
| 44. | Willard | 11.2% | 4.6%(+6.58)#44 | 4.7%(+6.50)#3,687 |
| 45. | Junction | 11.1% | 4.6%(+6.50)#45 | 4.7%(+6.43)#3,735 |
| 46. | Hooper | 11.1% | 4.6%(+6.49)#46 | 4.7%(+6.42)#3,761 |
| 47. | Liberty | 10.9% | 4.6%(+6.26)#47 | 4.7%(+6.18)#3,883 |
| 48. | Joseph | 10.9% | 4.6%(+6.25)#48 | 4.7%(+6.18)#3,887 |
| 49. | Marriott Slaterville | 10.8% | 4.6%(+6.24)#49 | 4.7%(+6.16)#3,896 |
| 50. | Roy | 10.8% | 4.6%(+6.20)#50 | 4.7%(+6.13)#3,924 |
| 51. | West Haven | 10.6% | 4.6%(+6.02)#51 | 4.7%(+5.94)#4,049 |
| 52. | South Weber | 10.6% | 4.6%(+5.95)#52 | 4.7%(+5.87)#4,086 |
| 53. | Tselakai Dezza | 10.5% | 4.6%(+5.92)#53 | 4.7%(+5.84)#4,120 |
| 54. | Maeser | 10.5% | 4.6%(+5.91)#54 | 4.7%(+5.84)#4,125 |
| 55. | Corinne | 10.5% | 4.6%(+5.89)#55 | 4.7%(+5.81)#4,145 |
| 56. | Leamington | 10.3% | 4.6%(+5.71)#56 | 4.7%(+5.63)#4,257 |
| 57. | Pleasant View | 10.3% | 4.6%(+5.64)#57 | 4.7%(+5.57)#4,306 |
| 58. | Riverdale | 10.0% | 4.6%(+5.42)#58 | 4.7%(+5.34)#4,451 |
| 59. | Apple Valley | 10.0% | 4.6%(+5.37)#59 | 4.7%(+5.30)#4,501 |
| 60. | Avon | 9.7% | 4.6%(+5.13)#60 | 4.7%(+5.05)#4,694 |
| 61. | Duchesne | 9.7% | 4.6%(+5.07)#61 | 4.7%(+5.00)#4,724 |
| 62. | Cove | 9.6% | 4.6%(+5.03)#62 | 4.7%(+4.95)#4,765 |
| 63. | Holden | 9.5% | 4.6%(+4.92)#63 | 4.7%(+4.84)#4,845 |
| 64. | Clearfield | 9.4% | 4.6%(+4.79)#64 | 4.7%(+4.72)#4,956 |
| 65. | Tabiona | 9.4% | 4.6%(+4.77)#65 | 4.7%(+4.69)#4,979 |
| 66. | Stansbury Park | 9.3% | 4.6%(+4.67)#66 | 4.7%(+4.59)#5,055 |
| 67. | Castle Dale | 9.1% | 4.6%(+4.48)#67 | 4.7%(+4.41)#5,199 |
| 68. | Howell | 9.0% | 4.6%(+4.37)#68 | 4.7%(+4.30)#5,315 |
| 69. | Thatcher | 8.9% | 4.6%(+4.33)#69 | 4.7%(+4.26)#5,349 |
| 70. | Bear River City | 8.9% | 4.6%(+4.29)#70 | 4.7%(+4.21)#5,389 |
| 71. | Syracuse | 8.8% | 4.6%(+4.21)#71 | 4.7%(+4.13)#5,472 |
| 72. | Spanish Valley | 8.8% | 4.6%(+4.21)#72 | 4.7%(+4.13)#5,474 |
| 73. | Washington Terrace | 8.8% | 4.6%(+4.16)#73 | 4.7%(+4.08)#5,520 |
| 74. | Orderville | 8.7% | 4.6%(+4.10)#74 | 4.7%(+4.03)#5,582 |
| 75. | Morgan | 8.7% | 4.6%(+4.09)#75 | 4.7%(+4.02)#5,594 |
| 76. | Layton | 8.7% | 4.6%(+4.07)#76 | 4.7%(+4.00)#5,625 |
| 77. | Ferron | 8.7% | 4.6%(+4.07)#77 | 4.7%(+3.99)#5,628 |
| 78. | Timber Lakes | 8.5% | 4.6%(+3.93)#78 | 4.7%(+3.86)#5,757 |
| 79. | Richfield | 8.5% | 4.6%(+3.91)#79 | 4.7%(+3.83)#5,780 |
| 80. | Garden City | 8.5% | 4.6%(+3.88)#80 | 4.7%(+3.81)#5,813 |
| 81. | Minersville | 8.5% | 4.6%(+3.86)#81 | 4.7%(+3.78)#5,836 |
| 82. | Alton | 8.5% | 4.6%(+3.84)#82 | 4.7%(+3.77)#5,859 |
| 83. | Gunnison | 8.4% | 4.6%(+3.83)#83 | 4.7%(+3.76)#5,872 |
| 84. | Kanosh | 8.4% | 4.6%(+3.76)#84 | 4.7%(+3.68)#5,955 |
| 85. | Richmond | 8.3% | 4.6%(+3.70)#85 | 4.7%(+3.62)#6,030 |
| 86. | Green River | 8.1% | 4.6%(+3.53)#86 | 4.7%(+3.46)#6,200 |
| 87. | North Ogden | 8.1% | 4.6%(+3.47)#87 | 4.7%(+3.40)#6,269 |
| 88. | Uintah | 8.0% | 4.6%(+3.36)#88 | 4.7%(+3.28)#6,397 |
| 89. | Scipio | 8.0% | 4.6%(+3.35)#89 | 4.7%(+3.28)#6,405 |
| 90. | Centerfield | 8.0% | 4.6%(+3.35)#90 | 4.7%(+3.27)#6,406 |
| 91. | Fillmore | 7.9% | 4.6%(+3.33)#91 | 4.7%(+3.25)#6,432 |
| 92. | Marion | 7.9% | 4.6%(+3.31)#92 | 4.7%(+3.23)#6,452 |
| 93. | Wolf Creek | 7.9% | 4.6%(+3.27)#93 | 4.7%(+3.19)#6,503 |
| 94. | Beaver | 7.9% | 4.6%(+3.25)#94 | 4.7%(+3.18)#6,516 |
| 95. | Benjamin | 7.8% | 4.6%(+3.19)#95 | 4.7%(+3.11)#6,587 |
| 96. | Riverside | 7.8% | 4.6%(+3.15)#96 | 4.7%(+3.08)#6,636 |
| 97. | Cleveland | 7.8% | 4.6%(+3.15)#97 | 4.7%(+3.08)#6,638 |
| 98. | Elsinore | 7.8% | 4.6%(+3.15)#98 | 4.7%(+3.07)#6,648 |
| 99. | Ephraim | 7.7% | 4.6%(+3.11)#99 | 4.7%(+3.04)#6,689 |
| 100. | Mountain Green | 7.7% | 4.6%(+3.10)#100 | 4.7%(+3.02)#6,705 |
Common Questions
What are the Top 10 Cities with the Highest Percentage of Population Employed in Public Administration in Utah?
Top 10 Cities with the Highest Percentage of Population Employed in Public Administration in Utah are:
#1
100.0%
#2
65.4%
#3
54.7%
#4
47.8%
#5
31.1%
#6
22.7%
#7
22.2%
#8
21.2%
#9
20.8%
#10
20.5%
What city has the Highest Percentage of Population Employed in Public Administration in Utah?
Randlett has the Highest Percentage of Population Employed in Public Administration in Utah with 100.0%.
What is the Percentage of Population Employed in Public Administration in the State of Utah?
Percentage of Population Employed in Public Administration in Utah is 4.6%.
What is the Percentage of Population Employed in Public Administration in the United States?
Percentage of Population Employed in Public Administration in the United States is 4.7%.