Cities with the Highest Percentage of Population Employed in Public Administration in Indiana
RELATED REPORTS & OPTIONS
Public Administration
Indiana
Compare Cities
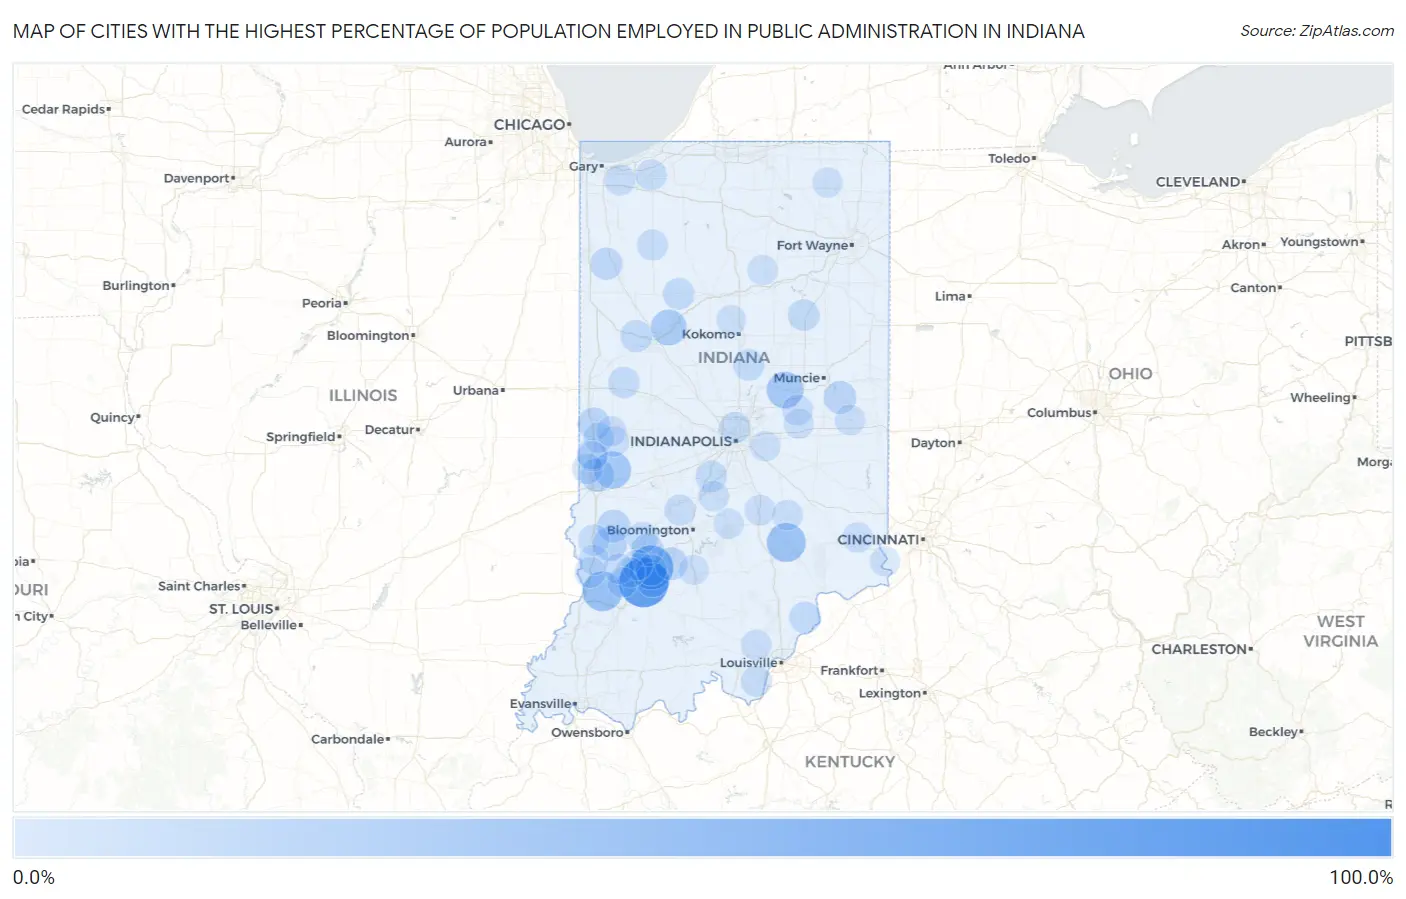
Map of Cities with the Highest Percentage of Population Employed in Public Administration in Indiana
0.0%
100.0%
Cities with the Highest Percentage of Population Employed in Public Administration in Indiana
| City | % Employed | vs State | vs National | |
| 1. | Needham | 100.0% | 3.6%(+96.4)#1 | 4.7%(+95.3)#27 |
| 2. | Raglesville | 81.6% | 3.6%(+78.0)#2 | 4.7%(+76.9)#39 |
| 3. | Scircleville | 72.7% | 3.6%(+69.2)#3 | 4.7%(+68.0)#54 |
| 4. | Scotland | 60.9% | 3.6%(+57.3)#4 | 4.7%(+56.2)#80 |
| 5. | Talma | 60.0% | 3.6%(+56.4)#5 | 4.7%(+55.3)#82 |
| 6. | Walesboro | 59.2% | 3.6%(+55.7)#6 | 4.7%(+54.5)#87 |
| 7. | Taswell | 46.4% | 3.6%(+42.9)#7 | 4.7%(+41.7)#175 |
| 8. | Ragsdale | 44.4% | 3.6%(+40.9)#8 | 4.7%(+39.8)#194 |
| 9. | Scipio | 41.5% | 3.6%(+38.0)#9 | 4.7%(+36.8)#246 |
| 10. | Grayford | 40.0% | 3.6%(+36.4)#10 | 4.7%(+35.3)#261 |
| 11. | Solsberry | 39.6% | 3.6%(+36.1)#11 | 4.7%(+34.9)#266 |
| 12. | Brimfield | 37.3% | 3.6%(+33.8)#12 | 4.7%(+32.7)#309 |
| 13. | Fontanet | 35.1% | 3.6%(+31.5)#13 | 4.7%(+30.4)#342 |
| 14. | River Forest | 33.3% | 3.6%(+29.8)#14 | 4.7%(+28.6)#385 |
| 15. | Midland | 32.4% | 3.6%(+28.9)#15 | 4.7%(+27.7)#404 |
| 16. | Paxton | 30.7% | 3.6%(+27.1)#16 | 4.7%(+26.0)#456 |
| 17. | Americus | 30.2% | 3.6%(+26.6)#17 | 4.7%(+25.5)#478 |
| 18. | Mariah Hill | 27.0% | 3.6%(+23.4)#18 | 4.7%(+22.3)#611 |
| 19. | Lucerne | 26.8% | 3.6%(+23.2)#19 | 4.7%(+22.1)#620 |
| 20. | Blue Ridge | 26.2% | 3.6%(+22.7)#20 | 4.7%(+21.5)#652 |
| 21. | Gwynneville | 24.9% | 3.6%(+21.3)#21 | 4.7%(+20.2)#754 |
| 22. | Flat Rock | 24.8% | 3.6%(+21.2)#22 | 4.7%(+20.1)#759 |
| 23. | Burns City | 24.4% | 3.6%(+20.9)#23 | 4.7%(+19.8)#781 |
| 24. | Dugger | 23.6% | 3.6%(+20.1)#24 | 4.7%(+19.0)#849 |
| 25. | Hartz Lake | 23.4% | 3.6%(+19.9)#25 | 4.7%(+18.7)#866 |
| 26. | Bennetts Switch | 22.6% | 3.6%(+19.0)#26 | 4.7%(+17.9)#934 |
| 27. | Waynesville | 22.4% | 3.6%(+18.8)#27 | 4.7%(+17.7)#950 |
| 28. | North Terre Haute | 21.4% | 3.6%(+17.9)#28 | 4.7%(+16.7)#1,033 |
| 29. | Wyatt | 20.2% | 3.6%(+16.7)#29 | 4.7%(+15.6)#1,158 |
| 30. | Coalmont | 20.1% | 3.6%(+16.6)#30 | 4.7%(+15.4)#1,172 |
| 31. | Owensburg | 19.0% | 3.6%(+15.5)#31 | 4.7%(+14.4)#1,326 |
| 32. | Blountsville | 18.8% | 3.6%(+15.2)#32 | 4.7%(+14.1)#1,371 |
| 33. | Mace | 18.3% | 3.6%(+14.8)#33 | 4.7%(+13.6)#1,423 |
| 34. | Putnamville | 18.3% | 3.6%(+14.8)#34 | 4.7%(+13.6)#1,424 |
| 35. | Newport | 18.1% | 3.6%(+14.6)#35 | 4.7%(+13.4)#1,470 |
| 36. | Bloomfield | 18.0% | 3.6%(+14.4)#36 | 4.7%(+13.3)#1,485 |
| 37. | Homer | 17.5% | 3.6%(+13.9)#37 | 4.7%(+12.8)#1,579 |
| 38. | Mount Ayr | 17.1% | 3.6%(+13.6)#38 | 4.7%(+12.5)#1,642 |
| 39. | New London | 16.7% | 3.6%(+13.1)#39 | 4.7%(+12.0)#1,728 |
| 40. | Needmore | 16.3% | 3.6%(+12.7)#40 | 4.7%(+11.6)#1,800 |
| 41. | Montmorenci | 16.1% | 3.6%(+12.6)#41 | 4.7%(+11.4)#1,832 |
| 42. | St. Anthony | 15.8% | 3.6%(+12.3)#42 | 4.7%(+11.1)#1,904 |
| 43. | Landess | 15.2% | 3.6%(+11.6)#43 | 4.7%(+10.5)#2,078 |
| 44. | Millgrove | 15.2% | 3.6%(+11.6)#44 | 4.7%(+10.5)#2,079 |
| 45. | Oakville | 15.0% | 3.6%(+11.4)#45 | 4.7%(+10.3)#2,123 |
| 46. | New Washington | 14.8% | 3.6%(+11.2)#46 | 4.7%(+10.1)#2,184 |
| 47. | Union Mills | 14.7% | 3.6%(+11.1)#47 | 4.7%(+9.99)#2,220 |
| 48. | Idaville | 14.5% | 3.6%(+11.0)#48 | 4.7%(+9.86)#2,260 |
| 49. | Nineveh | 14.5% | 3.6%(+11.0)#49 | 4.7%(+9.85)#2,266 |
| 50. | Young America | 14.3% | 3.6%(+10.7)#50 | 4.7%(+9.60)#2,353 |
| 51. | Bethany | 14.3% | 3.6%(+10.7)#51 | 4.7%(+9.60)#2,382 |
| 52. | Tipton | 14.1% | 3.6%(+10.6)#52 | 4.7%(+9.42)#2,442 |
| 53. | Mellott | 14.1% | 3.6%(+10.5)#53 | 4.7%(+9.38)#2,453 |
| 54. | Crows Nest | 13.8% | 3.6%(+10.2)#54 | 4.7%(+9.11)#2,544 |
| 55. | Worthington | 13.6% | 3.6%(+10.1)#55 | 4.7%(+8.93)#2,615 |
| 56. | Chili | 13.2% | 3.6%(+9.61)#56 | 4.7%(+8.47)#2,799 |
| 57. | Crane | 13.1% | 3.6%(+9.58)#57 | 4.7%(+8.45)#2,806 |
| 58. | Westville | 13.0% | 3.6%(+9.46)#58 | 4.7%(+8.32)#2,849 |
| 59. | Sullivan | 13.0% | 3.6%(+9.43)#59 | 4.7%(+8.30)#2,857 |
| 60. | Petersville | 12.9% | 3.6%(+9.35)#60 | 4.7%(+8.22)#2,881 |
| 61. | Stinesville | 12.6% | 3.6%(+9.02)#61 | 4.7%(+7.89)#2,984 |
| 62. | Medaryville | 12.6% | 3.6%(+9.00)#62 | 4.7%(+7.87)#2,988 |
| 63. | Wheeler | 12.3% | 3.6%(+8.79)#63 | 4.7%(+7.66)#3,087 |
| 64. | Elizabeth | 12.3% | 3.6%(+8.76)#64 | 4.7%(+7.62)#3,101 |
| 65. | Markleville | 12.1% | 3.6%(+8.59)#65 | 4.7%(+7.46)#3,199 |
| 66. | Fairview Park | 12.1% | 3.6%(+8.52)#66 | 4.7%(+7.39)#3,237 |
| 67. | Everton | 12.0% | 3.6%(+8.45)#67 | 4.7%(+7.31)#3,261 |
| 68. | Libertyville | 12.0% | 3.6%(+8.45)#68 | 4.7%(+7.31)#3,264 |
| 69. | Oaktown | 11.9% | 3.6%(+8.38)#69 | 4.7%(+7.24)#3,299 |
| 70. | New Goshen | 11.9% | 3.6%(+8.32)#70 | 4.7%(+7.18)#3,323 |
| 71. | Rockville | 11.7% | 3.6%(+8.17)#71 | 4.7%(+7.03)#3,410 |
| 72. | Haysville | 11.4% | 3.6%(+7.84)#72 | 4.7%(+6.70)#3,591 |
| 73. | Ramsey | 11.3% | 3.6%(+7.72)#73 | 4.7%(+6.59)#3,653 |
| 74. | Blooming Grove | 11.1% | 3.6%(+7.56)#74 | 4.7%(+6.43)#3,737 |
| 75. | Antioch | 11.1% | 3.6%(+7.56)#75 | 4.7%(+6.43)#3,743 |
| 76. | Cloverland | 11.1% | 3.6%(+7.50)#76 | 4.7%(+6.37)#3,783 |
| 77. | Greenville | 11.0% | 3.6%(+7.48)#77 | 4.7%(+6.35)#3,792 |
| 78. | Taylorsville | 11.0% | 3.6%(+7.46)#78 | 4.7%(+6.32)#3,800 |
| 79. | Hartsville | 10.8% | 3.6%(+7.26)#79 | 4.7%(+6.13)#3,925 |
| 80. | Hagerstown | 10.7% | 3.6%(+7.19)#80 | 4.7%(+6.05)#3,963 |
| 81. | Newberry | 10.6% | 3.6%(+7.09)#81 | 4.7%(+5.95)#4,038 |
| 82. | Sandborn | 10.5% | 3.6%(+6.98)#82 | 4.7%(+5.84)#4,107 |
| 83. | Painted Hills | 10.5% | 3.6%(+6.90)#83 | 4.7%(+5.77)#4,170 |
| 84. | Montezuma | 10.4% | 3.6%(+6.90)#84 | 4.7%(+5.76)#4,175 |
| 85. | Moores Hill | 10.4% | 3.6%(+6.85)#85 | 4.7%(+5.71)#4,208 |
| 86. | Merriam | 10.2% | 3.6%(+6.67)#86 | 4.7%(+5.53)#4,320 |
| 87. | Roann | 10.2% | 3.6%(+6.65)#87 | 4.7%(+5.52)#4,332 |
| 88. | Bloomingdale | 10.2% | 3.6%(+6.65)#88 | 4.7%(+5.52)#4,333 |
| 89. | Nashville | 10.2% | 3.6%(+6.65)#89 | 4.7%(+5.51)#4,339 |
| 90. | Elnora | 10.1% | 3.6%(+6.57)#90 | 4.7%(+5.44)#4,400 |
| 91. | Rome City | 10.1% | 3.6%(+6.51)#91 | 4.7%(+5.38)#4,429 |
| 92. | Wilkinson | 9.9% | 3.6%(+6.33)#92 | 4.7%(+5.20)#4,572 |
| 93. | Carlisle | 9.8% | 3.6%(+6.24)#93 | 4.7%(+5.11)#4,640 |
| 94. | Plainville | 9.8% | 3.6%(+6.24)#94 | 4.7%(+5.11)#4,642 |
| 95. | New Palestine | 9.7% | 3.6%(+6.17)#95 | 4.7%(+5.04)#4,703 |
| 96. | Clinton | 9.7% | 3.6%(+6.16)#96 | 4.7%(+5.03)#4,705 |
| 97. | Rising Sun | 9.7% | 3.6%(+6.11)#97 | 4.7%(+4.97)#4,748 |
| 98. | Galveston | 9.5% | 3.6%(+5.99)#98 | 4.7%(+4.86)#4,828 |
| 99. | Oolitic | 9.5% | 3.6%(+5.97)#99 | 4.7%(+4.84)#4,842 |
| 100. | Harrison Lake | 9.5% | 3.6%(+5.93)#100 | 4.7%(+4.80)#4,887 |
Common Questions
What are the Top 10 Cities with the Highest Percentage of Population Employed in Public Administration in Indiana?
Top 10 Cities with the Highest Percentage of Population Employed in Public Administration in Indiana are:
#1
81.6%
#2
60.9%
#3
44.4%
#4
41.5%
#5
35.1%
#6
33.3%
#7
30.2%
#8
24.4%
#9
23.6%
#10
21.4%
What city has the Highest Percentage of Population Employed in Public Administration in Indiana?
Raglesville has the Highest Percentage of Population Employed in Public Administration in Indiana with 81.6%.
What is the Percentage of Population Employed in Public Administration in the State of Indiana?
Percentage of Population Employed in Public Administration in Indiana is 3.6%.
What is the Percentage of Population Employed in Public Administration in the United States?
Percentage of Population Employed in Public Administration in the United States is 4.7%.