Cities with the Highest Percentage of Population Employed in Public Administration in Kansas
RELATED REPORTS & OPTIONS
Public Administration
Kansas
Compare Cities
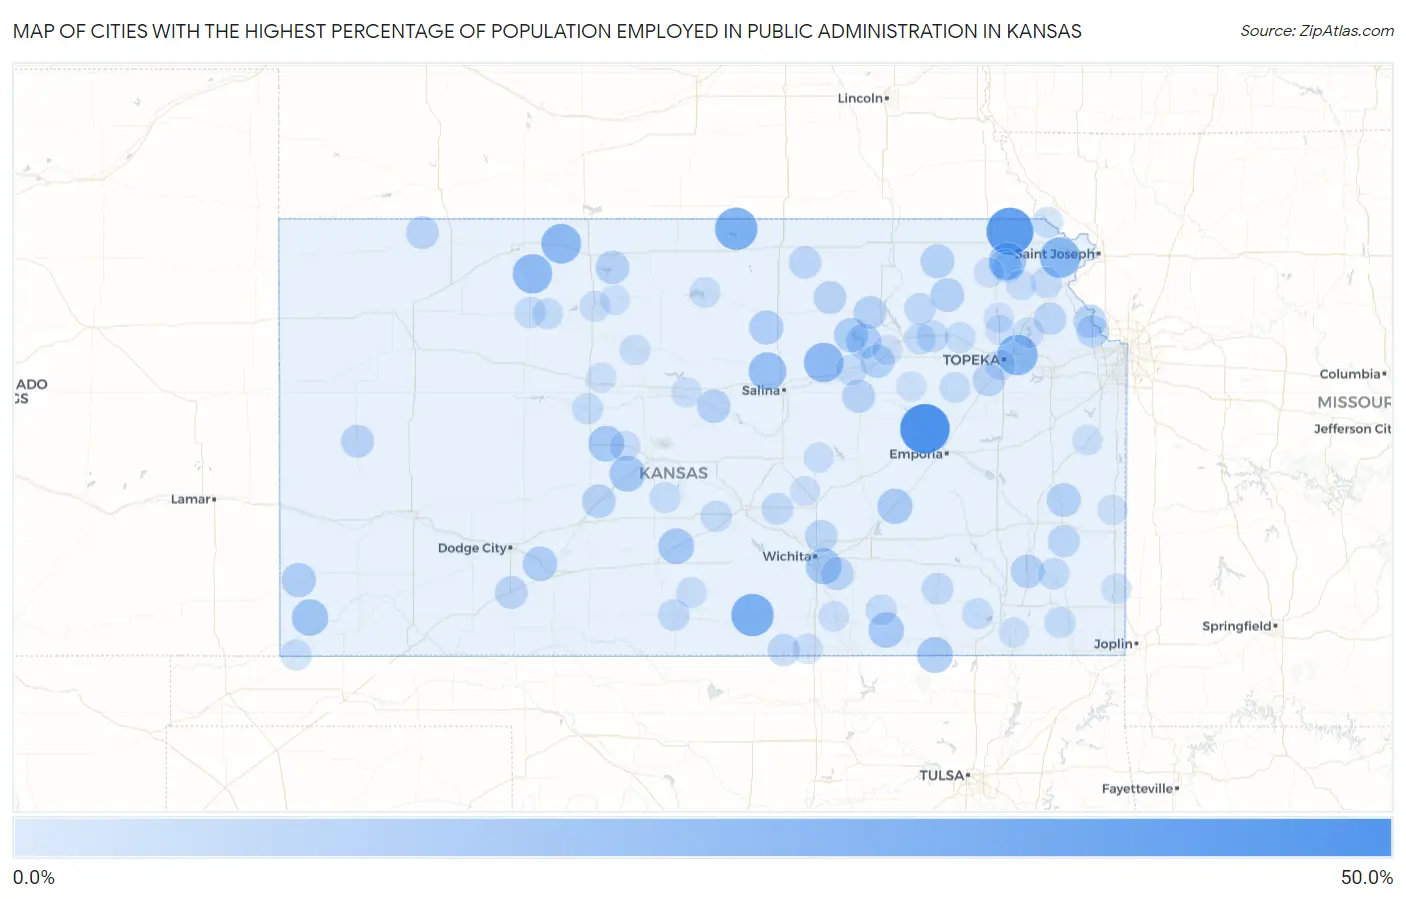
Map of Cities with the Highest Percentage of Population Employed in Public Administration in Kansas
0.0%
50.0%
Cities with the Highest Percentage of Population Employed in Public Administration in Kansas
| City | % Employed | vs State | vs National | |
| 1. | Dunlap | 48.3% | 4.6%(+43.7)#1 | 4.7%(+43.6)#159 |
| 2. | Hamlin | 42.9% | 4.6%(+38.3)#2 | 4.7%(+38.2)#226 |
| 3. | Webber | 33.3% | 4.6%(+28.8)#3 | 4.7%(+28.6)#380 |
| 4. | Danville | 33.3% | 4.6%(+28.8)#4 | 4.7%(+28.6)#381 |
| 5. | Grantville | 29.3% | 4.6%(+24.7)#5 | 4.7%(+24.6)#505 |
| 6. | Bendena | 29.1% | 4.6%(+24.5)#6 | 4.7%(+24.4)#514 |
| 7. | Prairie View | 27.7% | 4.6%(+23.1)#7 | 4.7%(+23.0)#581 |
| 8. | Talmage | 27.6% | 4.6%(+23.0)#8 | 4.7%(+22.9)#586 |
| 9. | Edmond | 27.1% | 4.6%(+22.6)#9 | 4.7%(+22.5)#605 |
| 10. | Tecumseh | 24.1% | 4.6%(+19.5)#10 | 4.7%(+19.4)#812 |
| 11. | Culver | 23.8% | 4.6%(+19.2)#11 | 4.7%(+19.1)#837 |
| 12. | Kickapoo Site 1 | 23.1% | 4.6%(+18.5)#12 | 4.7%(+18.4)#893 |
| 13. | Ringo | 22.5% | 4.6%(+17.9)#13 | 4.7%(+17.8)#938 |
| 14. | Richfield | 21.4% | 4.6%(+16.9)#14 | 4.7%(+16.7)#1,026 |
| 15. | Mcconnell Afb | 20.2% | 4.6%(+15.6)#15 | 4.7%(+15.5)#1,166 |
| 16. | Pawnee Rock | 20.1% | 4.6%(+15.6)#16 | 4.7%(+15.5)#1,168 |
| 17. | Elgin | 20.0% | 4.6%(+15.4)#17 | 4.7%(+15.3)#1,199 |
| 18. | Timken | 20.0% | 4.6%(+15.4)#18 | 4.7%(+15.3)#1,202 |
| 19. | Preston | 19.7% | 4.6%(+15.1)#19 | 4.7%(+15.0)#1,240 |
| 20. | Keats | 19.5% | 4.6%(+14.9)#20 | 4.7%(+14.8)#1,265 |
| 21. | Peck | 19.4% | 4.6%(+14.8)#21 | 4.7%(+14.7)#1,283 |
| 22. | Dexter | 19.3% | 4.6%(+14.7)#22 | 4.7%(+14.6)#1,303 |
| 23. | Cassoday | 18.9% | 4.6%(+14.3)#23 | 4.7%(+14.2)#1,357 |
| 24. | Yale | 18.5% | 4.6%(+13.9)#24 | 4.7%(+13.8)#1,397 |
| 25. | Milford | 18.0% | 4.6%(+13.4)#25 | 4.7%(+13.3)#1,490 |
| 26. | Ford | 17.2% | 4.6%(+12.6)#26 | 4.7%(+12.5)#1,626 |
| 27. | Manter | 17.1% | 4.6%(+12.6)#27 | 4.7%(+12.5)#1,641 |
| 28. | Wakefield | 17.1% | 4.6%(+12.6)#28 | 4.7%(+12.4)#1,647 |
| 29. | Delphos | 16.9% | 4.6%(+12.3)#29 | 4.7%(+12.2)#1,685 |
| 30. | Kincaid | 16.1% | 4.6%(+11.6)#30 | 4.7%(+11.4)#1,836 |
| 31. | Vermillion | 16.1% | 4.6%(+11.6)#31 | 4.7%(+11.4)#1,837 |
| 32. | Onaga | 15.8% | 4.6%(+11.3)#32 | 4.7%(+11.2)#1,898 |
| 33. | Grandview Plaza | 15.8% | 4.6%(+11.2)#33 | 4.7%(+11.1)#1,921 |
| 34. | Kirwin | 15.6% | 4.6%(+11.0)#34 | 4.7%(+10.9)#1,971 |
| 35. | Ellsworth | 15.5% | 4.6%(+10.9)#35 | 4.7%(+10.8)#1,979 |
| 36. | Garfield | 15.4% | 4.6%(+10.8)#36 | 4.7%(+10.7)#2,017 |
| 37. | Earlton | 15.2% | 4.6%(+10.6)#37 | 4.7%(+10.5)#2,059 |
| 38. | Woodbine | 14.8% | 4.6%(+10.2)#38 | 4.7%(+10.1)#2,198 |
| 39. | Leavenworth | 14.6% | 4.6%(+10.0)#39 | 4.7%(+9.90)#2,249 |
| 40. | Leonardville | 14.6% | 4.6%(+10.0)#40 | 4.7%(+9.90)#2,252 |
| 41. | Leoti | 14.4% | 4.6%(+9.86)#41 | 4.7%(+9.75)#2,303 |
| 42. | Herndon | 14.3% | 4.6%(+9.71)#42 | 4.7%(+9.60)#2,367 |
| 43. | Morganville | 14.1% | 4.6%(+9.56)#43 | 4.7%(+9.45)#2,431 |
| 44. | Rose Hill | 14.1% | 4.6%(+9.53)#44 | 4.7%(+9.42)#2,438 |
| 45. | Minneola | 14.0% | 4.6%(+9.38)#45 | 4.7%(+9.27)#2,481 |
| 46. | Auburn | 13.8% | 4.6%(+9.24)#46 | 4.7%(+9.13)#2,531 |
| 47. | Kechi | 13.8% | 4.6%(+9.18)#47 | 4.7%(+9.07)#2,555 |
| 48. | Winchester | 13.5% | 4.6%(+8.92)#48 | 4.7%(+8.81)#2,662 |
| 49. | Agenda | 13.3% | 4.6%(+8.76)#49 | 4.7%(+8.65)#2,739 |
| 50. | Lansing | 13.1% | 4.6%(+8.55)#50 | 4.7%(+8.43)#2,810 |
| 51. | Caldwell | 12.8% | 4.6%(+8.23)#51 | 4.7%(+8.12)#2,911 |
| 52. | Elsmore | 12.5% | 4.6%(+7.93)#52 | 4.7%(+7.81)#3,042 |
| 53. | Wamego | 12.4% | 4.6%(+7.79)#53 | 4.7%(+7.68)#3,079 |
| 54. | Burrton | 12.4% | 4.6%(+7.79)#54 | 4.7%(+7.67)#3,080 |
| 55. | Howard | 12.3% | 4.6%(+7.76)#55 | 4.7%(+7.64)#3,090 |
| 56. | Medicine Lodge | 12.0% | 4.6%(+7.44)#56 | 4.7%(+7.33)#3,256 |
| 57. | Westmoreland | 11.9% | 4.6%(+7.37)#57 | 4.7%(+7.26)#3,295 |
| 58. | Kickapoo Site 7 | 11.8% | 4.6%(+7.19)#58 | 4.7%(+7.08)#3,384 |
| 59. | Erie | 11.7% | 4.6%(+7.14)#59 | 4.7%(+7.02)#3,413 |
| 60. | St George | 11.5% | 4.6%(+6.96)#60 | 4.7%(+6.85)#3,515 |
| 61. | Abbyville | 11.4% | 4.6%(+6.85)#61 | 4.7%(+6.74)#3,577 |
| 62. | Hill City | 11.1% | 4.6%(+6.55)#62 | 4.7%(+6.44)#3,718 |
| 63. | Labette | 11.1% | 4.6%(+6.54)#63 | 4.7%(+6.43)#3,755 |
| 64. | Lancaster | 11.0% | 4.6%(+6.43)#64 | 4.7%(+6.31)#3,806 |
| 65. | Hudson | 10.9% | 4.6%(+6.34)#65 | 4.7%(+6.22)#3,857 |
| 66. | Chapman | 10.9% | 4.6%(+6.28)#66 | 4.7%(+6.17)#3,890 |
| 67. | Schoenchen | 10.9% | 4.6%(+6.28)#67 | 4.7%(+6.17)#3,894 |
| 68. | Burden | 10.8% | 4.6%(+6.25)#68 | 4.7%(+6.14)#3,916 |
| 69. | St Marys | 10.7% | 4.6%(+6.15)#69 | 4.7%(+6.03)#3,974 |
| 70. | Elkhart | 10.7% | 4.6%(+6.13)#70 | 4.7%(+6.02)#3,994 |
| 71. | Eskridge | 10.7% | 4.6%(+6.08)#71 | 4.7%(+5.97)#4,030 |
| 72. | Elk City | 10.6% | 4.6%(+6.01)#72 | 4.7%(+5.90)#4,074 |
| 73. | White Cloud | 10.5% | 4.6%(+5.95)#73 | 4.7%(+5.84)#4,119 |
| 74. | Bogue | 10.5% | 4.6%(+5.95)#74 | 4.7%(+5.84)#4,121 |
| 75. | Kickapoo Tribal Center | 10.4% | 4.6%(+5.84)#75 | 4.7%(+5.73)#4,203 |
| 76. | Nashville | 10.3% | 4.6%(+5.77)#76 | 4.7%(+5.66)#4,240 |
| 77. | Paradise | 10.3% | 4.6%(+5.77)#77 | 4.7%(+5.66)#4,241 |
| 78. | Glen Elder | 10.3% | 4.6%(+5.71)#78 | 4.7%(+5.60)#4,286 |
| 79. | Ozawkie | 10.3% | 4.6%(+5.68)#79 | 4.7%(+5.57)#4,298 |
| 80. | Albert | 10.2% | 4.6%(+5.63)#80 | 4.7%(+5.52)#4,337 |
| 81. | Stockton | 10.1% | 4.6%(+5.56)#81 | 4.7%(+5.45)#4,390 |
| 82. | Topeka | 10.0% | 4.6%(+5.45)#82 | 4.7%(+5.34)#4,453 |
| 83. | Muscotah | 10.0% | 4.6%(+5.43)#83 | 4.7%(+5.31)#4,482 |
| 84. | Oxford | 9.8% | 4.6%(+5.20)#84 | 4.7%(+5.09)#4,663 |
| 85. | Osawatomie | 9.8% | 4.6%(+5.20)#85 | 4.7%(+5.08)#4,664 |
| 86. | South Haven | 9.6% | 4.6%(+4.98)#86 | 4.7%(+4.87)#4,824 |
| 87. | Wilson | 9.4% | 4.6%(+4.85)#87 | 4.7%(+4.74)#4,936 |
| 88. | Frontenac | 9.3% | 4.6%(+4.71)#88 | 4.7%(+4.60)#5,045 |
| 89. | Wetmore | 9.2% | 4.6%(+4.67)#89 | 4.7%(+4.56)#5,086 |
| 90. | Hesston | 9.2% | 4.6%(+4.65)#90 | 4.7%(+4.53)#5,104 |
| 91. | Lehigh | 9.2% | 4.6%(+4.61)#91 | 4.7%(+4.50)#5,130 |
| 92. | Ogden | 9.1% | 4.6%(+4.52)#92 | 4.7%(+4.41)#5,197 |
| 93. | Liberty | 9.1% | 4.6%(+4.52)#93 | 4.7%(+4.41)#5,218 |
| 94. | Woodston | 9.1% | 4.6%(+4.52)#94 | 4.7%(+4.41)#5,221 |
| 95. | Fulton | 9.1% | 4.6%(+4.52)#95 | 4.7%(+4.41)#5,223 |
| 96. | Mayetta | 9.0% | 4.6%(+4.47)#96 | 4.7%(+4.36)#5,262 |
| 97. | Hoyt | 9.0% | 4.6%(+4.42)#97 | 4.7%(+4.31)#5,299 |
| 98. | Catharine | 9.0% | 4.6%(+4.42)#98 | 4.7%(+4.30)#5,311 |
| 99. | Dennis | 8.9% | 4.6%(+4.29)#99 | 4.7%(+4.18)#5,427 |
| 100. | Alta Vista | 8.8% | 4.6%(+4.27)#100 | 4.7%(+4.15)#5,452 |
Common Questions
What are the Top 10 Cities with the Highest Percentage of Population Employed in Public Administration in Kansas?
Top 10 Cities with the Highest Percentage of Population Employed in Public Administration in Kansas are:
#1
48.3%
#2
42.9%
#3
33.3%
#4
33.3%
#5
29.3%
#6
29.1%
#7
27.7%
#8
27.6%
#9
27.1%
#10
23.8%
What city has the Highest Percentage of Population Employed in Public Administration in Kansas?
Dunlap has the Highest Percentage of Population Employed in Public Administration in Kansas with 48.3%.
What is the Percentage of Population Employed in Public Administration in the State of Kansas?
Percentage of Population Employed in Public Administration in Kansas is 4.6%.
What is the Percentage of Population Employed in Public Administration in the United States?
Percentage of Population Employed in Public Administration in the United States is 4.7%.