Cities with the Highest Percentage of Population Employed in Public Administration in Massachusetts
RELATED REPORTS & OPTIONS
Public Administration
Massachusetts
Compare Cities
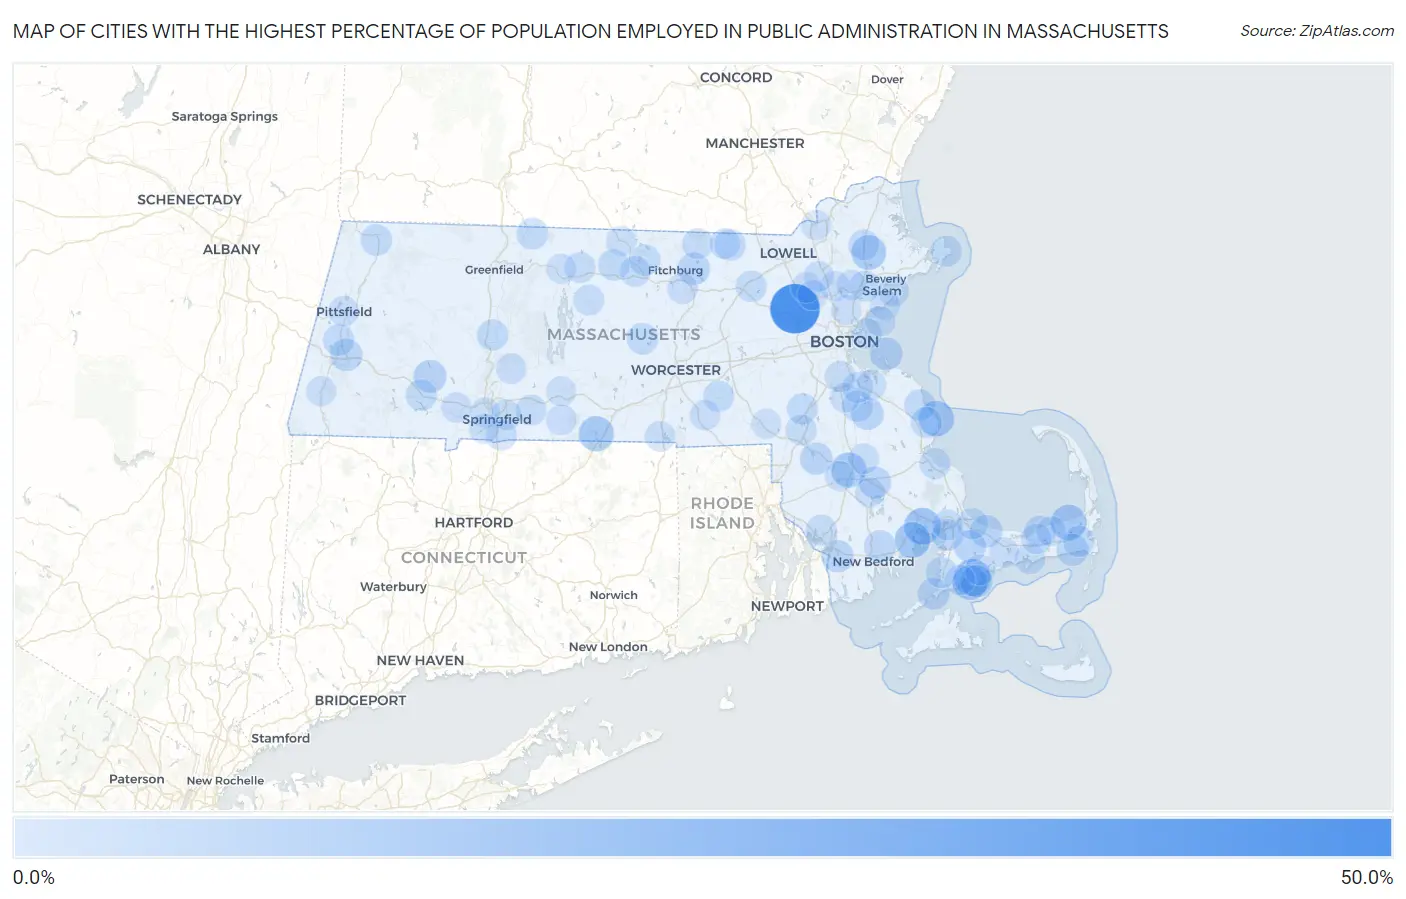
Map of Cities with the Highest Percentage of Population Employed in Public Administration in Massachusetts
0.0%
50.0%
Cities with the Highest Percentage of Population Employed in Public Administration in Massachusetts
| City | % Employed | vs State | vs National | |
| 1. | Hanscom Afb | 44.2% | 3.8%(+40.4)#1 | 4.7%(+39.5)#197 |
| 2. | Seabrook | 17.5% | 3.8%(+13.7)#2 | 4.7%(+12.8)#1,575 |
| 3. | Wareham Center | 17.4% | 3.8%(+13.6)#3 | 4.7%(+12.8)#1,584 |
| 4. | Marion Center | 15.2% | 3.8%(+11.4)#4 | 4.7%(+10.5)#2,061 |
| 5. | Ocean Bluff Brant Rock | 15.1% | 3.8%(+11.2)#5 | 4.7%(+10.4)#2,106 |
| 6. | Brewster | 15.0% | 3.8%(+11.2)#6 | 4.7%(+10.4)#2,108 |
| 7. | Holland | 14.1% | 3.8%(+10.3)#7 | 4.7%(+9.45)#2,426 |
| 8. | Raynham Center | 13.9% | 3.8%(+10.1)#8 | 4.7%(+9.21)#2,503 |
| 9. | Topsfield | 13.5% | 3.8%(+9.65)#9 | 4.7%(+8.78)#2,673 |
| 10. | Seconsett Island | 13.3% | 3.8%(+9.52)#10 | 4.7%(+8.65)#2,735 |
| 11. | West Warren | 10.6% | 3.8%(+6.79)#11 | 4.7%(+5.92)#4,060 |
| 12. | Huntington | 9.5% | 3.8%(+5.69)#12 | 4.7%(+4.82)#4,874 |
| 13. | Hull | 9.1% | 3.8%(+5.25)#13 | 4.7%(+4.38)#5,244 |
| 14. | Norton Center | 9.0% | 3.8%(+5.16)#14 | 4.7%(+4.29)#5,322 |
| 15. | Oak Bluffs | 8.7% | 3.8%(+4.93)#15 | 4.7%(+4.06)#5,546 |
| 16. | East Sandwich | 8.7% | 3.8%(+4.89)#16 | 4.7%(+4.02)#5,589 |
| 17. | Abington | 8.7% | 3.8%(+4.83)#17 | 4.7%(+3.97)#5,652 |
| 18. | Lunenburg | 8.6% | 3.8%(+4.77)#18 | 4.7%(+3.90)#5,708 |
| 19. | New Seabury | 8.6% | 3.8%(+4.77)#19 | 4.7%(+3.90)#5,713 |
| 20. | Lee | 8.4% | 3.8%(+4.63)#20 | 4.7%(+3.76)#5,864 |
| 21. | North Westport | 8.4% | 3.8%(+4.62)#21 | 4.7%(+3.75)#5,884 |
| 22. | Middleborough Center | 8.1% | 3.8%(+4.31)#22 | 4.7%(+3.44)#6,215 |
| 23. | Forestdale | 8.0% | 3.8%(+4.20)#23 | 4.7%(+3.33)#6,338 |
| 24. | Acushnet Center | 7.9% | 3.8%(+4.04)#24 | 4.7%(+3.17)#6,520 |
| 25. | Harwich Port | 7.7% | 3.8%(+3.93)#25 | 4.7%(+3.06)#6,664 |
| 26. | Cedar Crest | 7.7% | 3.8%(+3.93)#26 | 4.7%(+3.06)#6,665 |
| 27. | Woods Hole | 7.7% | 3.8%(+3.90)#27 | 4.7%(+3.03)#6,703 |
| 28. | Monument Beach | 7.3% | 3.8%(+3.52)#28 | 4.7%(+2.65)#7,206 |
| 29. | Northfield | 7.2% | 3.8%(+3.38)#29 | 4.7%(+2.51)#7,389 |
| 30. | Dennis | 7.1% | 3.8%(+3.29)#30 | 4.7%(+2.42)#7,519 |
| 31. | North Adams | 6.9% | 3.8%(+3.10)#31 | 4.7%(+2.23)#7,779 |
| 32. | Rutland | 6.8% | 3.8%(+2.99)#32 | 4.7%(+2.12)#7,960 |
| 33. | Blandford | 6.7% | 3.8%(+2.93)#33 | 4.7%(+2.06)#8,070 |
| 34. | East Harwich | 6.7% | 3.8%(+2.90)#34 | 4.7%(+2.03)#8,113 |
| 35. | East Pepperell | 6.7% | 3.8%(+2.88)#35 | 4.7%(+2.01)#8,150 |
| 36. | Lenox | 6.7% | 3.8%(+2.86)#36 | 4.7%(+1.99)#8,166 |
| 37. | Baldwinville | 6.6% | 3.8%(+2.83)#37 | 4.7%(+1.96)#8,232 |
| 38. | Hatfield | 6.6% | 3.8%(+2.79)#38 | 4.7%(+1.92)#8,295 |
| 39. | Marshfield Hills | 6.5% | 3.8%(+2.72)#39 | 4.7%(+1.85)#8,390 |
| 40. | Holbrook | 6.4% | 3.8%(+2.60)#40 | 4.7%(+1.73)#8,607 |
| 41. | Peabody | 6.3% | 3.8%(+2.48)#41 | 4.7%(+1.61)#8,831 |
| 42. | Rockport | 6.3% | 3.8%(+2.45)#42 | 4.7%(+1.58)#8,878 |
| 43. | Sandwich | 6.2% | 3.8%(+2.43)#43 | 4.7%(+1.56)#8,928 |
| 44. | Marshfield | 6.2% | 3.8%(+2.37)#44 | 4.7%(+1.50)#9,016 |
| 45. | Littleton Common | 6.2% | 3.8%(+2.37)#45 | 4.7%(+1.50)#9,030 |
| 46. | South Ashburnham | 6.2% | 3.8%(+2.36)#46 | 4.7%(+1.49)#9,044 |
| 47. | West Falmouth | 6.1% | 3.8%(+2.32)#47 | 4.7%(+1.45)#9,123 |
| 48. | Walpole | 6.1% | 3.8%(+2.30)#48 | 4.7%(+1.43)#9,150 |
| 49. | Plymouth | 6.1% | 3.8%(+2.27)#49 | 4.7%(+1.40)#9,221 |
| 50. | Upton | 5.9% | 3.8%(+2.09)#50 | 4.7%(+1.22)#9,542 |
| 51. | Athol | 5.8% | 3.8%(+2.03)#51 | 4.7%(+1.16)#9,657 |
| 52. | Winthrop Town | 5.8% | 3.8%(+2.02)#52 | 4.7%(+1.15)#9,686 |
| 53. | Gardner | 5.7% | 3.8%(+1.89)#53 | 4.7%(+1.02)#9,968 |
| 54. | West Yarmouth | 5.7% | 3.8%(+1.87)#54 | 4.7%(+0.996)#10,036 |
| 55. | Foxborough | 5.7% | 3.8%(+1.85)#55 | 4.7%(+0.985)#10,055 |
| 56. | Longmeadow | 5.6% | 3.8%(+1.83)#56 | 4.7%(+0.964)#10,101 |
| 57. | Somerset | 5.6% | 3.8%(+1.77)#57 | 4.7%(+0.899)#10,262 |
| 58. | Boxford | 5.6% | 3.8%(+1.75)#58 | 4.7%(+0.880)#10,308 |
| 59. | Petersham | 5.5% | 3.8%(+1.70)#59 | 4.7%(+0.832)#10,431 |
| 60. | Milton | 5.4% | 3.8%(+1.57)#60 | 4.7%(+0.697)#10,735 |
| 61. | Wilbraham | 5.3% | 3.8%(+1.52)#61 | 4.7%(+0.656)#10,843 |
| 62. | Springfield | 5.3% | 3.8%(+1.48)#62 | 4.7%(+0.609)#10,942 |
| 63. | Braintree Town | 5.3% | 3.8%(+1.44)#63 | 4.7%(+0.566)#11,072 |
| 64. | Townsend | 5.2% | 3.8%(+1.42)#64 | 4.7%(+0.548)#11,105 |
| 65. | Pinehurst | 5.2% | 3.8%(+1.38)#65 | 4.7%(+0.506)#11,221 |
| 66. | Whitinsville | 5.2% | 3.8%(+1.36)#66 | 4.7%(+0.488)#11,252 |
| 67. | Mashpee Neck | 5.1% | 3.8%(+1.30)#67 | 4.7%(+0.435)#11,375 |
| 68. | Pepperell | 5.1% | 3.8%(+1.25)#68 | 4.7%(+0.383)#11,506 |
| 69. | Barnstable Town | 5.0% | 3.8%(+1.22)#69 | 4.7%(+0.355)#11,583 |
| 70. | East Falmouth | 5.0% | 3.8%(+1.21)#70 | 4.7%(+0.337)#11,617 |
| 71. | Leominster | 5.0% | 3.8%(+1.15)#71 | 4.7%(+0.280)#11,755 |
| 72. | Buzzards Bay | 5.0% | 3.8%(+1.15)#72 | 4.7%(+0.279)#11,761 |
| 73. | Monson Center | 4.9% | 3.8%(+1.11)#73 | 4.7%(+0.240)#11,862 |
| 74. | Granby | 4.9% | 3.8%(+1.10)#74 | 4.7%(+0.226)#11,894 |
| 75. | Reading | 4.9% | 3.8%(+1.04)#75 | 4.7%(+0.174)#12,024 |
| 76. | Westfield | 4.9% | 3.8%(+1.04)#76 | 4.7%(+0.172)#12,034 |
| 77. | Webster | 4.8% | 3.8%(+0.965)#77 | 4.7%(+0.096)#12,211 |
| 78. | Pittsfield | 4.8% | 3.8%(+0.963)#78 | 4.7%(+0.094)#12,223 |
| 79. | Wilmington | 4.7% | 3.8%(+0.903)#79 | 4.7%(+0.034)#12,381 |
| 80. | Bridgewater Town | 4.7% | 3.8%(+0.867)#80 | 4.7%(-0.002)#12,481 |
| 81. | Yarmouth Port | 4.7% | 3.8%(+0.857)#81 | 4.7%(-0.012)#12,511 |
| 82. | Weymouth Town | 4.6% | 3.8%(+0.749)#82 | 4.7%(-0.120)#12,814 |
| 83. | Salem | 4.5% | 3.8%(+0.728)#83 | 4.7%(-0.141)#12,886 |
| 84. | West Springfield Town | 4.5% | 3.8%(+0.709)#84 | 4.7%(-0.161)#12,924 |
| 85. | Palmer Town | 4.5% | 3.8%(+0.683)#85 | 4.7%(-0.187)#12,993 |
| 86. | Great Barrington | 4.5% | 3.8%(+0.668)#86 | 4.7%(-0.201)#13,034 |
| 87. | Melrose | 4.5% | 3.8%(+0.660)#87 | 4.7%(-0.210)#13,070 |
| 88. | East Dennis | 4.4% | 3.8%(+0.609)#88 | 4.7%(-0.260)#13,221 |
| 89. | Burlington | 4.4% | 3.8%(+0.606)#89 | 4.7%(-0.264)#13,230 |
| 90. | Swampscott | 4.4% | 3.8%(+0.596)#90 | 4.7%(-0.273)#13,250 |
| 91. | Nahant | 4.4% | 3.8%(+0.583)#91 | 4.7%(-0.287)#13,274 |
| 92. | North Lakeville | 4.3% | 3.8%(+0.532)#92 | 4.7%(-0.337)#13,390 |
| 93. | Winchendon | 4.3% | 3.8%(+0.517)#93 | 4.7%(-0.352)#13,460 |
| 94. | Agawam Town | 4.3% | 3.8%(+0.485)#94 | 4.7%(-0.385)#13,538 |
| 95. | Orange | 4.3% | 3.8%(+0.456)#95 | 4.7%(-0.414)#13,635 |
| 96. | Taunton | 4.3% | 3.8%(+0.454)#96 | 4.7%(-0.415)#13,639 |
| 97. | Methuen Town | 4.2% | 3.8%(+0.432)#97 | 4.7%(-0.438)#13,705 |
| 98. | Franklin Town | 4.2% | 3.8%(+0.421)#98 | 4.7%(-0.448)#13,725 |
| 99. | Randolph Town | 4.2% | 3.8%(+0.412)#99 | 4.7%(-0.457)#13,754 |
| 100. | Lynnfield | 4.2% | 3.8%(+0.380)#100 | 4.7%(-0.489)#13,850 |
Common Questions
What are the Top 10 Cities with the Highest Percentage of Population Employed in Public Administration in Massachusetts?
Top 10 Cities with the Highest Percentage of Population Employed in Public Administration in Massachusetts are:
#1
44.2%
#2
17.5%
#3
17.4%
#4
15.2%
#5
15.1%
#6
15.0%
#7
14.1%
#8
13.9%
#9
13.5%
#10
13.3%
What city has the Highest Percentage of Population Employed in Public Administration in Massachusetts?
Hanscom AFB has the Highest Percentage of Population Employed in Public Administration in Massachusetts with 44.2%.
What is the Percentage of Population Employed in Public Administration in the State of Massachusetts?
Percentage of Population Employed in Public Administration in Massachusetts is 3.8%.
What is the Percentage of Population Employed in Public Administration in the United States?
Percentage of Population Employed in Public Administration in the United States is 4.7%.