Cities with the Highest Percentage of Population Employed in Public Administration in South Dakota
RELATED REPORTS & OPTIONS
Public Administration
South Dakota
Compare Cities
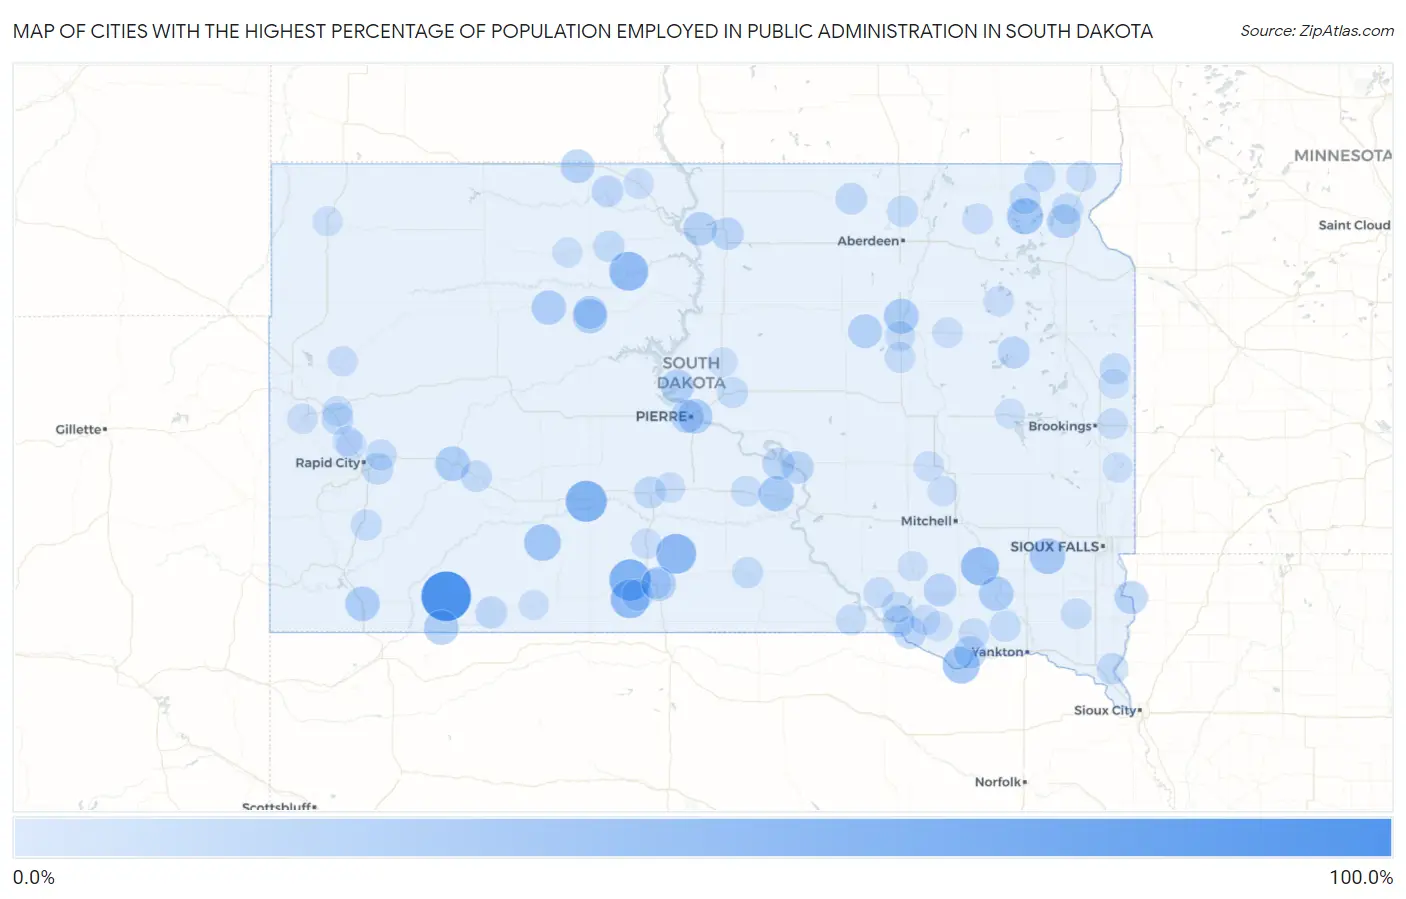
Map of Cities with the Highest Percentage of Population Employed in Public Administration in South Dakota
0.0%
100.0%
Cities with the Highest Percentage of Population Employed in Public Administration in South Dakota
| City | % Employed | vs State | vs National | |
| 1. | Manderson White Horse Creek | 89.1% | 4.8%(+84.3)#1 | 4.7%(+84.4)#35 |
| 2. | Soldier Creek | 53.3% | 4.8%(+48.5)#2 | 4.7%(+48.6)#114 |
| 3. | Belvidere | 52.9% | 4.8%(+48.1)#3 | 4.7%(+48.3)#117 |
| 4. | Lyons | 50.0% | 4.8%(+45.2)#4 | 4.7%(+45.3)#135 |
| 5. | Wood | 47.6% | 4.8%(+42.8)#5 | 4.7%(+42.9)#168 |
| 6. | Whitehorse | 43.5% | 4.8%(+38.7)#6 | 4.7%(+38.9)#209 |
| 7. | Two Strike | 42.3% | 4.8%(+37.5)#7 | 4.7%(+37.6)#230 |
| 8. | Milltown | 40.0% | 4.8%(+35.2)#8 | 4.7%(+35.3)#264 |
| 9. | Running Water | 36.0% | 4.8%(+31.2)#9 | 4.7%(+31.3)#328 |
| 10. | Peever Flats | 35.5% | 4.8%(+30.7)#10 | 4.7%(+30.8)#337 |
| 11. | Wanblee | 34.0% | 4.8%(+29.2)#11 | 4.7%(+29.3)#356 |
| 12. | Eden | 31.7% | 4.8%(+26.9)#12 | 4.7%(+27.0)#423 |
| 13. | Enemy Swim | 30.6% | 4.8%(+25.8)#13 | 4.7%(+25.9)#459 |
| 14. | Monroe | 30.0% | 4.8%(+25.2)#14 | 4.7%(+25.3)#488 |
| 15. | Reliance | 28.2% | 4.8%(+23.4)#15 | 4.7%(+23.5)#555 |
| 16. | Ashton | 27.0% | 4.8%(+22.2)#16 | 4.7%(+22.3)#613 |
| 17. | Wasta | 25.8% | 4.8%(+21.0)#17 | 4.7%(+21.1)#676 |
| 18. | Olivet | 25.7% | 4.8%(+20.9)#18 | 4.7%(+21.0)#681 |
| 19. | Pine Ridge | 25.6% | 4.8%(+20.8)#19 | 4.7%(+20.9)#686 |
| 20. | Pierre | 25.5% | 4.8%(+20.7)#20 | 4.7%(+20.8)#688 |
| 21. | Oelrichs | 25.5% | 4.8%(+20.7)#21 | 4.7%(+20.8)#693 |
| 22. | West Brule | 25.4% | 4.8%(+20.6)#22 | 4.7%(+20.8)#696 |
| 23. | Eagle Butte | 24.9% | 4.8%(+20.1)#23 | 4.7%(+20.2)#751 |
| 24. | Antelope | 24.1% | 4.8%(+19.3)#24 | 4.7%(+19.4)#808 |
| 25. | Dupree | 24.1% | 4.8%(+19.3)#25 | 4.7%(+19.4)#810 |
| 26. | Rockham | 22.2% | 4.8%(+17.4)#26 | 4.7%(+17.5)#971 |
| 27. | Mcintosh | 21.7% | 4.8%(+16.9)#27 | 4.7%(+17.1)#1,001 |
| 28. | Cow Creek | 21.4% | 4.8%(+16.6)#28 | 4.7%(+16.7)#1,022 |
| 29. | Agency Village | 21.4% | 4.8%(+16.6)#29 | 4.7%(+16.7)#1,031 |
| 30. | Glenham | 20.9% | 4.8%(+16.1)#30 | 4.7%(+16.2)#1,090 |
| 31. | Fairview | 19.6% | 4.8%(+14.8)#31 | 4.7%(+15.0)#1,248 |
| 32. | Fort Pierre | 19.6% | 4.8%(+14.8)#32 | 4.7%(+14.9)#1,249 |
| 33. | North Eagle Butte | 19.6% | 4.8%(+14.8)#33 | 4.7%(+14.9)#1,253 |
| 34. | Delmont | 18.2% | 4.8%(+13.4)#34 | 4.7%(+13.5)#1,449 |
| 35. | Marty | 17.2% | 4.8%(+12.4)#35 | 4.7%(+12.6)#1,619 |
| 36. | Springfield | 17.1% | 4.8%(+12.3)#36 | 4.7%(+12.4)#1,645 |
| 37. | Fort Thompson | 16.9% | 4.8%(+12.1)#37 | 4.7%(+12.2)#1,679 |
| 38. | Selby | 16.6% | 4.8%(+11.8)#38 | 4.7%(+11.9)#1,747 |
| 39. | Lower Brule | 16.3% | 4.8%(+11.5)#39 | 4.7%(+11.6)#1,808 |
| 40. | Pickstown | 15.6% | 4.8%(+10.7)#40 | 4.7%(+10.9)#1,970 |
| 41. | Naples | 15.4% | 4.8%(+10.6)#41 | 4.7%(+10.7)#2,019 |
| 42. | Batesland | 15.0% | 4.8%(+10.2)#42 | 4.7%(+10.3)#2,127 |
| 43. | Blucksberg Mountain | 14.2% | 4.8%(+9.44)#43 | 4.7%(+9.56)#2,391 |
| 44. | Murdo | 14.2% | 4.8%(+9.39)#44 | 4.7%(+9.51)#2,407 |
| 45. | Bullhead | 14.0% | 4.8%(+9.15)#45 | 4.7%(+9.27)#2,484 |
| 46. | Leola | 13.9% | 4.8%(+9.12)#46 | 4.7%(+9.25)#2,489 |
| 47. | Green Valley | 13.7% | 4.8%(+8.94)#47 | 4.7%(+9.06)#2,561 |
| 48. | Rosebud | 13.5% | 4.8%(+8.70)#48 | 4.7%(+8.82)#2,661 |
| 49. | Timber Lake | 12.5% | 4.8%(+7.74)#49 | 4.7%(+7.86)#2,994 |
| 50. | Richland | 12.5% | 4.8%(+7.69)#50 | 4.7%(+7.81)#3,024 |
| 51. | Wall | 12.4% | 4.8%(+7.57)#51 | 4.7%(+7.69)#3,075 |
| 52. | Veblen | 12.3% | 4.8%(+7.47)#52 | 4.7%(+7.60)#3,113 |
| 53. | Sisseton | 12.2% | 4.8%(+7.43)#53 | 4.7%(+7.55)#3,139 |
| 54. | Lake City | 12.1% | 4.8%(+7.31)#54 | 4.7%(+7.44)#3,215 |
| 55. | Blunt | 12.0% | 4.8%(+7.16)#55 | 4.7%(+7.28)#3,281 |
| 56. | Winner | 11.8% | 4.8%(+6.99)#56 | 4.7%(+7.11)#3,362 |
| 57. | Westport | 11.8% | 4.8%(+6.96)#57 | 4.7%(+7.08)#3,382 |
| 58. | Fairburn | 11.8% | 4.8%(+6.96)#58 | 4.7%(+7.08)#3,386 |
| 59. | Lesterville | 11.7% | 4.8%(+6.88)#59 | 4.7%(+7.00)#3,421 |
| 60. | Brandt | 11.7% | 4.8%(+6.86)#60 | 4.7%(+6.98)#3,433 |
| 61. | Wakpala | 11.4% | 4.8%(+6.62)#61 | 4.7%(+6.74)#3,573 |
| 62. | Lake Andes | 11.3% | 4.8%(+6.52)#62 | 4.7%(+6.65)#3,619 |
| 63. | Box Elder | 11.3% | 4.8%(+6.50)#63 | 4.7%(+6.62)#3,630 |
| 64. | Kenel | 11.3% | 4.8%(+6.48)#64 | 4.7%(+6.61)#3,638 |
| 65. | Prairiewood | 10.7% | 4.8%(+5.87)#65 | 4.7%(+5.99)#4,011 |
| 66. | Tyndall | 10.3% | 4.8%(+5.54)#66 | 4.7%(+5.66)#4,235 |
| 67. | Kennebec | 10.1% | 4.8%(+5.32)#67 | 4.7%(+5.44)#4,395 |
| 68. | Bonesteel | 10.1% | 4.8%(+5.30)#68 | 4.7%(+5.43)#4,406 |
| 69. | Bushnell | 10.0% | 4.8%(+5.19)#69 | 4.7%(+5.31)#4,488 |
| 70. | Mountain Plains | 9.9% | 4.8%(+5.10)#70 | 4.7%(+5.23)#4,543 |
| 71. | Geddes | 9.9% | 4.8%(+5.05)#71 | 4.7%(+5.17)#4,589 |
| 72. | Centerville | 9.8% | 4.8%(+5.04)#72 | 4.7%(+5.16)#4,596 |
| 73. | Tulare | 9.8% | 4.8%(+4.95)#73 | 4.7%(+5.07)#4,679 |
| 74. | Redfield | 9.7% | 4.8%(+4.91)#74 | 4.7%(+5.03)#4,704 |
| 75. | Langford | 9.6% | 4.8%(+4.80)#75 | 4.7%(+4.92)#4,786 |
| 76. | Wagner | 9.5% | 4.8%(+4.65)#76 | 4.7%(+4.77)#4,912 |
| 77. | New Effington | 9.4% | 4.8%(+4.60)#77 | 4.7%(+4.73)#4,949 |
| 78. | Mission | 9.4% | 4.8%(+4.57)#78 | 4.7%(+4.69)#4,974 |
| 79. | Doland | 9.3% | 4.8%(+4.52)#79 | 4.7%(+4.65)#5,015 |
| 80. | Lead | 9.2% | 4.8%(+4.44)#80 | 4.7%(+4.56)#5,081 |
| 81. | White River | 9.2% | 4.8%(+4.35)#81 | 4.7%(+4.47)#5,150 |
| 82. | Woonsocket | 9.1% | 4.8%(+4.26)#82 | 4.7%(+4.38)#5,247 |
| 83. | Cherry Creek | 8.9% | 4.8%(+4.08)#83 | 4.7%(+4.20)#5,399 |
| 84. | Bradley | 8.9% | 4.8%(+4.08)#84 | 4.7%(+4.20)#5,405 |
| 85. | Sturgis | 8.8% | 4.8%(+4.04)#85 | 4.7%(+4.16)#5,449 |
| 86. | Newell | 8.8% | 4.8%(+3.98)#86 | 4.7%(+4.11)#5,497 |
| 87. | Summerset | 8.7% | 4.8%(+3.92)#87 | 4.7%(+4.04)#5,565 |
| 88. | Mclaughlin | 8.5% | 4.8%(+3.73)#88 | 4.7%(+3.85)#5,760 |
| 89. | Draper | 8.3% | 4.8%(+3.52)#89 | 4.7%(+3.65)#6,021 |
| 90. | Letcher | 8.1% | 4.8%(+3.33)#90 | 4.7%(+3.45)#6,207 |
| 91. | Piedmont | 8.1% | 4.8%(+3.24)#91 | 4.7%(+3.36)#6,299 |
| 92. | Flandreau | 8.0% | 4.8%(+3.21)#92 | 4.7%(+3.33)#6,335 |
| 93. | Toronto | 7.9% | 4.8%(+3.11)#93 | 4.7%(+3.23)#6,456 |
| 94. | Buffalo | 7.8% | 4.8%(+3.03)#94 | 4.7%(+3.16)#6,536 |
| 95. | Martin | 7.8% | 4.8%(+3.02)#95 | 4.7%(+3.14)#6,563 |
| 96. | Dante | 7.7% | 4.8%(+2.88)#96 | 4.7%(+3.01)#6,750 |
| 97. | Onida | 7.6% | 4.8%(+2.84)#97 | 4.7%(+2.96)#6,804 |
| 98. | Corsica | 7.6% | 4.8%(+2.82)#98 | 4.7%(+2.94)#6,827 |
| 99. | Isabel | 7.6% | 4.8%(+2.80)#99 | 4.7%(+2.92)#6,857 |
| 100. | De Smet | 7.6% | 4.8%(+2.79)#100 | 4.7%(+2.92)#6,861 |
Common Questions
What are the Top 10 Cities with the Highest Percentage of Population Employed in Public Administration in South Dakota?
Top 10 Cities with the Highest Percentage of Population Employed in Public Administration in South Dakota are:
#1
89.1%
#2
53.3%
#3
52.9%
#4
47.6%
#5
43.5%
#6
42.3%
#7
40.0%
#8
36.0%
#9
34.0%
#10
31.7%
What city has the Highest Percentage of Population Employed in Public Administration in South Dakota?
Manderson White Horse Creek has the Highest Percentage of Population Employed in Public Administration in South Dakota with 89.1%.
What is the Percentage of Population Employed in Public Administration in the State of South Dakota?
Percentage of Population Employed in Public Administration in South Dakota is 4.8%.
What is the Percentage of Population Employed in Public Administration in the United States?
Percentage of Population Employed in Public Administration in the United States is 4.7%.