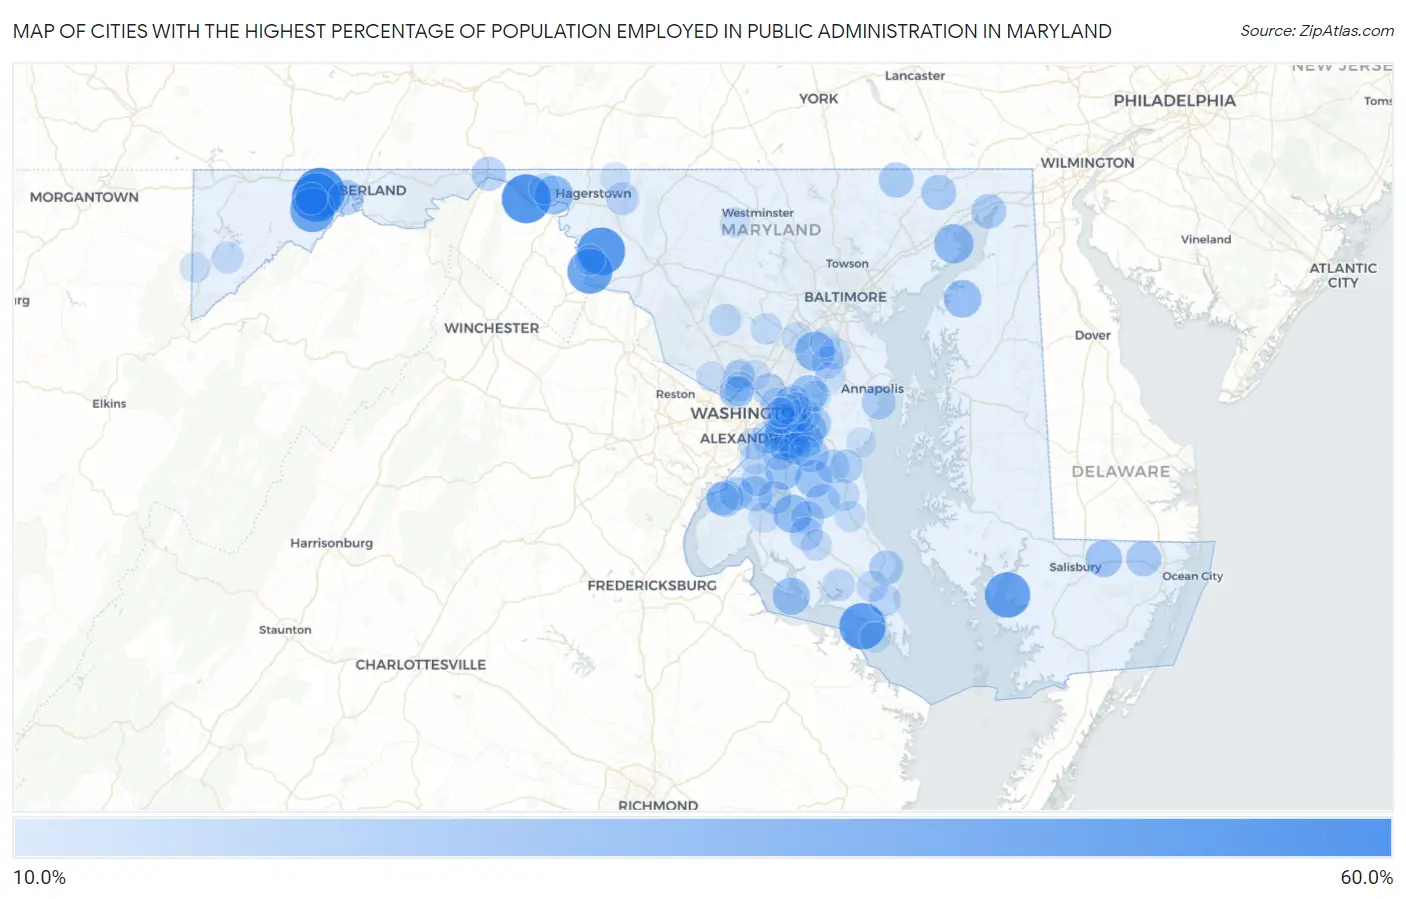
Cities with the Highest Percentage of Population Employed in Public Administration in Maryland
RELATED REPORTS & OPTIONS
Public Administration
Maryland
Compare Cities
Map of Cities with the Highest Percentage of Population Employed in Public Administration in Maryland
0.0%
60.0%
Cities with the Highest Percentage of Population Employed in Public Administration in Maryland
| City | % Employed | vs State | vs National | |
| 1. | Grahamtown | 51.2% | 11.0%(+40.2)#1 | 4.7%(+46.6)#122 |
| 2. | Shaft | 50.0% | 11.0%(+39.0)#2 | 4.7%(+45.3)#128 |
| 3. | Big Pool | 50.0% | 11.0%(+39.0)#3 | 4.7%(+45.3)#139 |
| 4. | Mount Briar | 47.7% | 11.0%(+36.7)#4 | 4.7%(+43.1)#167 |
| 5. | Tall Timbers | 45.1% | 11.0%(+34.1)#5 | 4.7%(+40.4)#185 |
| 6. | Nanticoke | 43.6% | 11.0%(+32.6)#6 | 4.7%(+39.0)#206 |
| 7. | Dargan | 42.9% | 11.0%(+31.9)#7 | 4.7%(+38.2)#220 |
| 8. | Gilmore | 41.9% | 11.0%(+30.9)#8 | 4.7%(+37.3)#235 |
| 9. | Andrews Afb | 38.3% | 11.0%(+27.3)#9 | 4.7%(+33.7)#292 |
| 10. | Fort Meade | 32.4% | 11.0%(+21.4)#10 | 4.7%(+27.7)#406 |
| 11. | Aberdeen Proving Ground | 32.0% | 11.0%(+21.0)#11 | 4.7%(+27.3)#417 |
| 12. | Charlton | 31.3% | 11.0%(+20.3)#12 | 4.7%(+26.7)#432 |
| 13. | Bryantown | 30.3% | 11.0%(+19.3)#13 | 4.7%(+25.6)#471 |
| 14. | Butlertown | 29.1% | 11.0%(+18.1)#14 | 4.7%(+24.5)#511 |
| 15. | Fairwood | 28.7% | 11.0%(+17.7)#15 | 4.7%(+24.0)#527 |
| 16. | Cobb Island | 28.4% | 11.0%(+17.4)#16 | 4.7%(+23.7)#547 |
| 17. | Baden | 28.2% | 11.0%(+17.2)#17 | 4.7%(+23.5)#553 |
| 18. | Wildewood | 28.0% | 11.0%(+17.0)#18 | 4.7%(+23.3)#562 |
| 19. | Callaway | 27.7% | 11.0%(+16.7)#19 | 4.7%(+23.0)#578 |
| 20. | Melwood | 27.7% | 11.0%(+16.7)#20 | 4.7%(+23.0)#580 |
| 21. | Brandywine | 27.6% | 11.0%(+16.6)#21 | 4.7%(+22.9)#582 |
| 22. | Parsonsburg | 27.5% | 11.0%(+16.5)#22 | 4.7%(+22.8)#591 |
| 23. | Potomac Heights | 26.7% | 11.0%(+15.7)#23 | 4.7%(+22.0)#627 |
| 24. | Morningside | 26.3% | 11.0%(+15.3)#24 | 4.7%(+21.6)#649 |
| 25. | Marlboro Village | 25.9% | 11.0%(+14.9)#25 | 4.7%(+21.2)#670 |
| 26. | Whaleyville | 25.0% | 11.0%(+14.0)#26 | 4.7%(+20.3)#730 |
| 27. | Bensville | 24.7% | 11.0%(+13.7)#27 | 4.7%(+20.0)#762 |
| 28. | Pylesville | 24.6% | 11.0%(+13.6)#28 | 4.7%(+20.0)#766 |
| 29. | Darlington | 24.6% | 11.0%(+13.6)#29 | 4.7%(+19.9)#770 |
| 30. | Croom | 24.3% | 11.0%(+13.3)#30 | 4.7%(+19.6)#795 |
| 31. | Bowling Green | 24.2% | 11.0%(+13.2)#31 | 4.7%(+19.5)#799 |
| 32. | Charlestown | 24.1% | 11.0%(+13.1)#32 | 4.7%(+19.4)#807 |
| 33. | Brock Hall | 24.0% | 11.0%(+13.0)#33 | 4.7%(+19.4)#814 |
| 34. | Aquasco | 23.7% | 11.0%(+12.7)#34 | 4.7%(+19.0)#848 |
| 35. | Westphalia | 23.5% | 11.0%(+12.5)#35 | 4.7%(+18.8)#860 |
| 36. | Queensland | 23.4% | 11.0%(+12.4)#36 | 4.7%(+18.7)#865 |
| 37. | Hancock | 23.3% | 11.0%(+12.3)#37 | 4.7%(+18.6)#875 |
| 38. | Lusby | 23.1% | 11.0%(+12.1)#38 | 4.7%(+18.4)#888 |
| 39. | Highland Beach | 22.6% | 11.0%(+11.6)#39 | 4.7%(+17.9)#932 |
| 40. | Friendship Heights Village | 22.1% | 11.0%(+11.1)#40 | 4.7%(+17.4)#974 |
| 41. | Dunkirk | 22.0% | 11.0%(+11.0)#41 | 4.7%(+17.3)#975 |
| 42. | Bryans Road | 21.9% | 11.0%(+10.9)#42 | 4.7%(+17.3)#981 |
| 43. | Owings | 21.9% | 11.0%(+10.9)#43 | 4.7%(+17.2)#986 |
| 44. | Kettering | 21.9% | 11.0%(+10.9)#44 | 4.7%(+17.2)#987 |
| 45. | Waldorf | 21.9% | 11.0%(+10.9)#45 | 4.7%(+17.2)#989 |
| 46. | Clinton | 21.5% | 11.0%(+10.5)#46 | 4.7%(+16.8)#1,016 |
| 47. | University Park | 21.5% | 11.0%(+10.5)#47 | 4.7%(+16.8)#1,017 |
| 48. | Hughesville | 21.4% | 11.0%(+10.4)#48 | 4.7%(+16.7)#1,029 |
| 49. | Springdale | 21.3% | 11.0%(+10.3)#49 | 4.7%(+16.6)#1,048 |
| 50. | Indian Head | 21.1% | 11.0%(+10.1)#50 | 4.7%(+16.4)#1,068 |
| 51. | Charlotte Hall | 21.0% | 11.0%(+10.0)#51 | 4.7%(+16.3)#1,077 |
| 52. | Pondsville | 20.6% | 11.0%(+9.63)#52 | 4.7%(+15.9)#1,116 |
| 53. | Abingdon | 20.4% | 11.0%(+9.43)#53 | 4.7%(+15.7)#1,134 |
| 54. | Capitol Heights | 20.4% | 11.0%(+9.40)#54 | 4.7%(+15.7)#1,142 |
| 55. | Accokeek | 19.9% | 11.0%(+8.86)#55 | 4.7%(+15.2)#1,220 |
| 56. | Lexington Park | 19.7% | 11.0%(+8.70)#56 | 4.7%(+15.0)#1,238 |
| 57. | Odenton | 19.7% | 11.0%(+8.70)#57 | 4.7%(+15.0)#1,239 |
| 58. | Temple Hills | 19.7% | 11.0%(+8.66)#58 | 4.7%(+15.0)#1,245 |
| 59. | Rosaryville | 19.6% | 11.0%(+8.57)#59 | 4.7%(+14.9)#1,255 |
| 60. | Leonardtown | 19.3% | 11.0%(+8.33)#60 | 4.7%(+14.6)#1,292 |
| 61. | Laytonsville | 19.3% | 11.0%(+8.28)#61 | 4.7%(+14.6)#1,299 |
| 62. | Largo | 19.1% | 11.0%(+8.10)#62 | 4.7%(+14.4)#1,321 |
| 63. | Cheverly | 18.9% | 11.0%(+7.93)#63 | 4.7%(+14.2)#1,343 |
| 64. | Carlos | 18.9% | 11.0%(+7.92)#64 | 4.7%(+14.2)#1,349 |
| 65. | National Harbor | 18.9% | 11.0%(+7.86)#65 | 4.7%(+14.2)#1,360 |
| 66. | California | 18.8% | 11.0%(+7.80)#66 | 4.7%(+14.1)#1,366 |
| 67. | Deer Park | 18.7% | 11.0%(+7.67)#67 | 4.7%(+14.0)#1,382 |
| 68. | Gambrills | 18.5% | 11.0%(+7.53)#68 | 4.7%(+13.8)#1,395 |
| 69. | Huntingtown | 18.5% | 11.0%(+7.49)#69 | 4.7%(+13.8)#1,399 |
| 70. | South Kensington | 18.4% | 11.0%(+7.39)#70 | 4.7%(+13.7)#1,411 |
| 71. | Highland | 18.2% | 11.0%(+7.23)#71 | 4.7%(+13.5)#1,438 |
| 72. | Bowie | 18.1% | 11.0%(+7.11)#72 | 4.7%(+13.4)#1,469 |
| 73. | Clear Spring | 18.1% | 11.0%(+7.10)#73 | 4.7%(+13.4)#1,473 |
| 74. | Brown Station | 18.1% | 11.0%(+7.05)#74 | 4.7%(+13.4)#1,476 |
| 75. | Fort Washington | 18.0% | 11.0%(+7.03)#75 | 4.7%(+13.3)#1,480 |
| 76. | Mechanicsville | 18.0% | 11.0%(+6.97)#76 | 4.7%(+13.3)#1,489 |
| 77. | Savage | 17.8% | 11.0%(+6.76)#77 | 4.7%(+13.1)#1,519 |
| 78. | St George Island | 17.5% | 11.0%(+6.53)#78 | 4.7%(+12.8)#1,569 |
| 79. | Marlton | 17.5% | 11.0%(+6.49)#79 | 4.7%(+12.8)#1,574 |
| 80. | Glenarden | 17.3% | 11.0%(+6.33)#80 | 4.7%(+12.6)#1,600 |
| 81. | Prince Frederick | 17.3% | 11.0%(+6.27)#81 | 4.7%(+12.6)#1,612 |
| 82. | Lake Arbor | 17.0% | 11.0%(+6.00)#82 | 4.7%(+12.3)#1,667 |
| 83. | New Windsor | 16.9% | 11.0%(+5.89)#83 | 4.7%(+12.2)#1,681 |
| 84. | Leitersburg | 16.8% | 11.0%(+5.81)#84 | 4.7%(+12.1)#1,695 |
| 85. | Crellin | 16.8% | 11.0%(+5.81)#85 | 4.7%(+12.1)#1,696 |
| 86. | La Plata | 16.8% | 11.0%(+5.77)#86 | 4.7%(+12.1)#1,702 |
| 87. | Walker Mill | 16.7% | 11.0%(+5.67)#87 | 4.7%(+12.0)#1,717 |
| 88. | Antietam | 16.7% | 11.0%(+5.67)#88 | 4.7%(+12.0)#1,735 |
| 89. | Severn | 16.5% | 11.0%(+5.47)#89 | 4.7%(+11.8)#1,770 |
| 90. | Crofton | 16.4% | 11.0%(+5.40)#90 | 4.7%(+11.7)#1,781 |
| 91. | Summerfield | 16.3% | 11.0%(+5.34)#91 | 4.7%(+11.7)#1,789 |
| 92. | Four Corners | 16.1% | 11.0%(+5.11)#92 | 4.7%(+11.4)#1,843 |
| 93. | Peppermill Village | 16.1% | 11.0%(+5.08)#93 | 4.7%(+11.4)#1,849 |
| 94. | Somerset | 16.0% | 11.0%(+5.04)#94 | 4.7%(+11.4)#1,855 |
| 95. | Kensington | 15.9% | 11.0%(+4.87)#95 | 4.7%(+11.2)#1,888 |
| 96. | Chevy Chase Section Five | 15.7% | 11.0%(+4.74)#96 | 4.7%(+11.1)#1,925 |
| 97. | Deale | 15.7% | 11.0%(+4.72)#97 | 4.7%(+11.0)#1,930 |
| 98. | Seat Pleasant | 15.7% | 11.0%(+4.68)#98 | 4.7%(+11.0)#1,942 |
| 99. | Potomac | 15.6% | 11.0%(+4.63)#99 | 4.7%(+10.9)#1,952 |
| 100. | Chevy Chase Village | 15.6% | 11.0%(+4.58)#100 | 4.7%(+10.9)#1,966 |
Common Questions
What are the Top 10 Cities with the Highest Percentage of Population Employed in Public Administration in Maryland?
Top 10 Cities with the Highest Percentage of Population Employed in Public Administration in Maryland are:
#1
51.2%
#2
50.0%
#3
50.0%
#4
47.7%
#5
45.1%
#6
43.6%
#7
42.9%
#8
41.9%
#9
38.3%
#10
32.4%
What city has the Highest Percentage of Population Employed in Public Administration in Maryland?
Grahamtown has the Highest Percentage of Population Employed in Public Administration in Maryland with 51.2%.
What is the Percentage of Population Employed in Public Administration in the State of Maryland?
Percentage of Population Employed in Public Administration in Maryland is 11.0%.
What is the Percentage of Population Employed in Public Administration in the United States?
Percentage of Population Employed in Public Administration in the United States is 4.7%.