Cities with the Highest Percentage of Population Employed in Public Administration in Michigan
RELATED REPORTS & OPTIONS
Public Administration
Michigan
Compare Cities
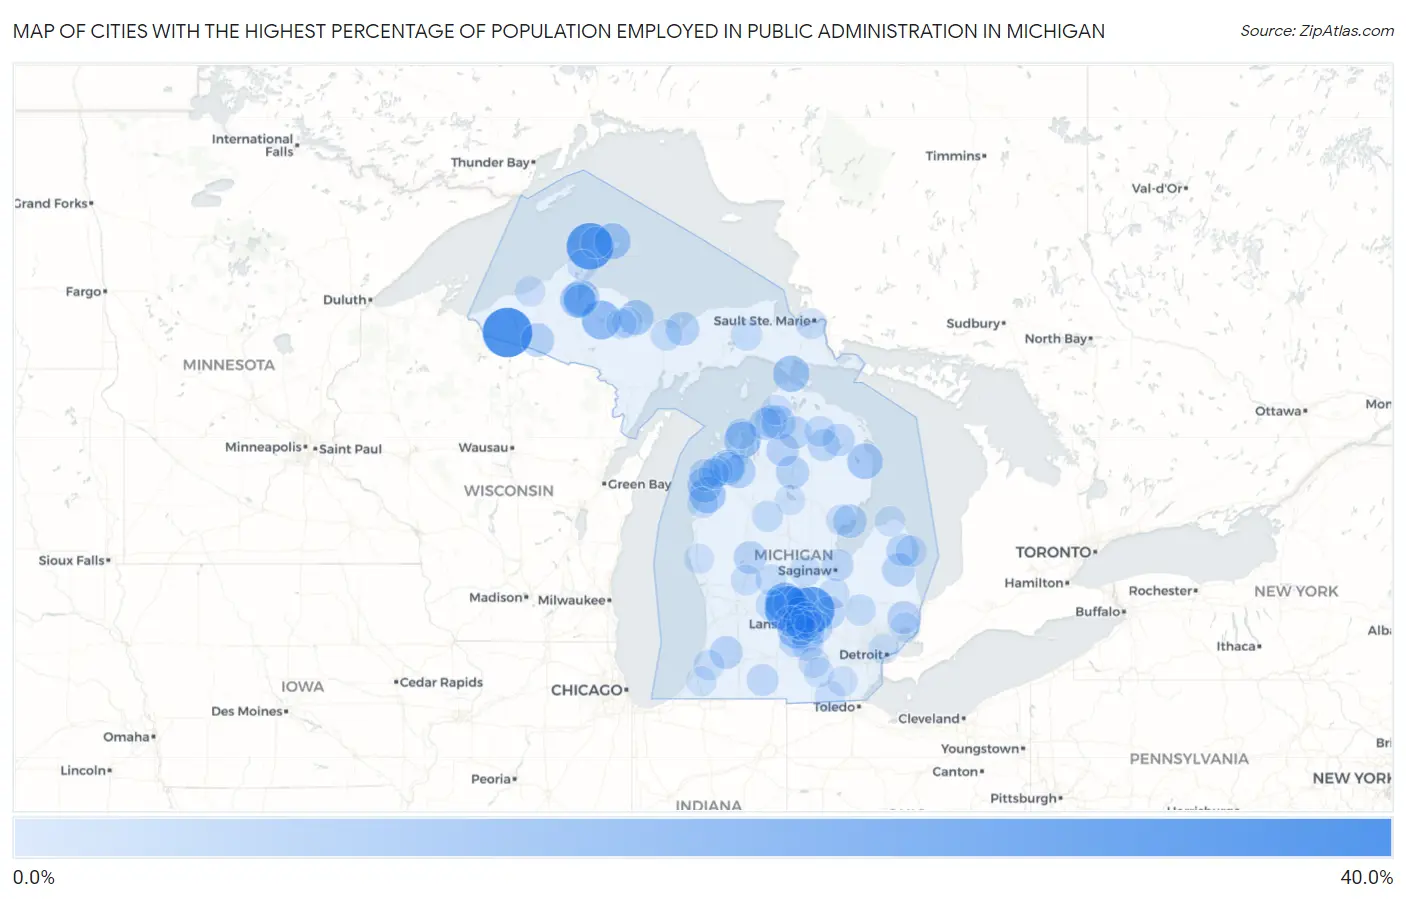
Map of Cities with the Highest Percentage of Population Employed in Public Administration in Michigan
0.0%
40.0%
Cities with the Highest Percentage of Population Employed in Public Administration in Michigan
| City | % Employed | vs State | vs National | |
| 1. | Marenisco | 32.5% | 3.5%(+29.0)#1 | 4.7%(+27.8)#401 |
| 2. | Pelkie | 31.6% | 3.5%(+28.1)#2 | 4.7%(+26.9)#428 |
| 3. | Eagle River | 28.6% | 3.5%(+25.1)#3 | 4.7%(+23.9)#538 |
| 4. | Lake Victoria | 28.2% | 3.5%(+24.8)#4 | 4.7%(+23.5)#551 |
| 5. | Brimley | 26.7% | 3.5%(+23.2)#5 | 4.7%(+22.0)#623 |
| 6. | Westphalia | 26.6% | 3.5%(+23.1)#6 | 4.7%(+21.9)#631 |
| 7. | Bergland | 23.4% | 3.5%(+19.9)#7 | 4.7%(+18.7)#867 |
| 8. | Pewamo | 19.5% | 3.5%(+16.1)#8 | 4.7%(+14.8)#1,263 |
| 9. | Rock | 19.1% | 3.5%(+15.6)#9 | 4.7%(+14.4)#1,319 |
| 10. | Michigamme | 18.3% | 3.5%(+14.8)#10 | 4.7%(+13.6)#1,425 |
| 11. | Grand Marais | 17.8% | 3.5%(+14.3)#11 | 4.7%(+13.1)#1,514 |
| 12. | Dimondale | 15.8% | 3.5%(+12.3)#12 | 4.7%(+11.1)#1,907 |
| 13. | Omena | 15.4% | 3.5%(+11.9)#13 | 4.7%(+10.7)#2,013 |
| 14. | St Ignace | 15.1% | 3.5%(+11.7)#14 | 4.7%(+10.5)#2,081 |
| 15. | Onekama | 15.1% | 3.5%(+11.6)#15 | 4.7%(+10.4)#2,104 |
| 16. | Copper Harbor | 14.8% | 3.5%(+11.4)#16 | 4.7%(+10.1)#2,180 |
| 17. | Maple Grove | 14.6% | 3.5%(+11.1)#17 | 4.7%(+9.91)#2,245 |
| 18. | Zeba | 14.3% | 3.5%(+10.8)#18 | 4.7%(+9.60)#2,348 |
| 19. | Lost Lake Woods | 14.3% | 3.5%(+10.8)#19 | 4.7%(+9.60)#2,350 |
| 20. | Mass | 14.3% | 3.5%(+10.8)#20 | 4.7%(+9.60)#2,361 |
| 21. | Dewitt | 13.9% | 3.5%(+10.5)#21 | 4.7%(+9.25)#2,485 |
| 22. | Baraga | 13.7% | 3.5%(+10.2)#22 | 4.7%(+9.00)#2,579 |
| 23. | Arcadia | 13.6% | 3.5%(+10.2)#23 | 4.7%(+8.95)#2,607 |
| 24. | Trowbridge Park | 13.6% | 3.5%(+10.1)#24 | 4.7%(+8.89)#2,630 |
| 25. | Bruce Crossing | 13.5% | 3.5%(+10.00)#25 | 4.7%(+8.78)#2,675 |
| 26. | Kincheloe | 13.3% | 3.5%(+9.86)#26 | 4.7%(+8.64)#2,742 |
| 27. | Waverly | 12.2% | 3.5%(+8.76)#27 | 4.7%(+7.54)#3,145 |
| 28. | Chums Corner | 12.0% | 3.5%(+8.53)#28 | 4.7%(+7.30)#3,270 |
| 29. | Walloon Lake | 11.8% | 3.5%(+8.34)#29 | 4.7%(+7.12)#3,360 |
| 30. | Watersmeet | 11.8% | 3.5%(+8.30)#30 | 4.7%(+7.08)#3,377 |
| 31. | Au Gres | 11.6% | 3.5%(+8.18)#31 | 4.7%(+6.96)#3,443 |
| 32. | Munising | 11.6% | 3.5%(+8.16)#32 | 4.7%(+6.94)#3,452 |
| 33. | L Anse | 11.6% | 3.5%(+8.14)#33 | 4.7%(+6.92)#3,469 |
| 34. | Fowler | 11.3% | 3.5%(+7.88)#34 | 4.7%(+6.66)#3,613 |
| 35. | Grayling | 11.3% | 3.5%(+7.82)#35 | 4.7%(+6.59)#3,646 |
| 36. | Sandusky | 11.2% | 3.5%(+7.78)#36 | 4.7%(+6.56)#3,666 |
| 37. | Richmond | 10.9% | 3.5%(+7.48)#37 | 4.7%(+6.26)#3,836 |
| 38. | Gobles | 10.9% | 3.5%(+7.40)#38 | 4.7%(+6.18)#3,886 |
| 39. | Lakes Of The North | 10.8% | 3.5%(+7.37)#39 | 4.7%(+6.15)#3,904 |
| 40. | Mason | 10.8% | 3.5%(+7.36)#40 | 4.7%(+6.13)#3,920 |
| 41. | Stanwood | 10.6% | 3.5%(+7.14)#41 | 4.7%(+5.92)#4,063 |
| 42. | Painesdale | 10.5% | 3.5%(+7.06)#42 | 4.7%(+5.84)#4,105 |
| 43. | St Johns | 10.5% | 3.5%(+7.06)#43 | 4.7%(+5.84)#4,126 |
| 44. | Vanderbilt | 10.5% | 3.5%(+7.00)#44 | 4.7%(+5.78)#4,165 |
| 45. | Minden City | 10.4% | 3.5%(+6.95)#45 | 4.7%(+5.73)#4,200 |
| 46. | Bancroft | 10.4% | 3.5%(+6.94)#46 | 4.7%(+5.71)#4,209 |
| 47. | Horton Bay | 10.3% | 3.5%(+6.86)#47 | 4.7%(+5.64)#4,256 |
| 48. | Williamston | 10.3% | 3.5%(+6.84)#48 | 4.7%(+5.62)#4,270 |
| 49. | Ironton | 10.3% | 3.5%(+6.79)#49 | 4.7%(+5.57)#4,301 |
| 50. | Hillman | 10.1% | 3.5%(+6.68)#50 | 4.7%(+5.46)#4,379 |
| 51. | Edgemont Park | 10.1% | 3.5%(+6.67)#51 | 4.7%(+5.45)#4,391 |
| 52. | Atlanta | 9.9% | 3.5%(+6.48)#52 | 4.7%(+5.26)#4,515 |
| 53. | Zilwaukee | 9.9% | 3.5%(+6.42)#53 | 4.7%(+5.19)#4,574 |
| 54. | Elberta | 9.7% | 3.5%(+6.26)#54 | 4.7%(+5.04)#4,700 |
| 55. | Sherwood | 9.6% | 3.5%(+6.17)#55 | 4.7%(+4.94)#4,771 |
| 56. | Leslie | 9.5% | 3.5%(+6.07)#56 | 4.7%(+4.85)#4,839 |
| 57. | Eaton Rapids | 9.3% | 3.5%(+5.88)#57 | 4.7%(+4.66)#5,006 |
| 58. | Eagle Harbor | 9.1% | 3.5%(+5.63)#58 | 4.7%(+4.41)#5,216 |
| 59. | Forestville | 9.1% | 3.5%(+5.63)#59 | 4.7%(+4.41)#5,217 |
| 60. | Ionia | 9.0% | 3.5%(+5.50)#60 | 4.7%(+4.27)#5,332 |
| 61. | Chatham | 8.9% | 3.5%(+5.43)#61 | 4.7%(+4.20)#5,404 |
| 62. | Haslett | 8.9% | 3.5%(+5.39)#62 | 4.7%(+4.17)#5,434 |
| 63. | Goodrich | 8.8% | 3.5%(+5.29)#63 | 4.7%(+4.07)#5,539 |
| 64. | Cannonsburg | 8.7% | 3.5%(+5.27)#64 | 4.7%(+4.05)#5,557 |
| 65. | Breckenridge | 8.7% | 3.5%(+5.27)#65 | 4.7%(+4.05)#5,561 |
| 66. | Newberry | 8.7% | 3.5%(+5.24)#66 | 4.7%(+4.02)#5,586 |
| 67. | Stanton | 8.6% | 3.5%(+5.16)#67 | 4.7%(+3.94)#5,670 |
| 68. | Honor | 8.6% | 3.5%(+5.16)#68 | 4.7%(+3.94)#5,676 |
| 69. | Parkdale | 8.6% | 3.5%(+5.15)#69 | 4.7%(+3.93)#5,687 |
| 70. | Marion | 8.5% | 3.5%(+5.08)#70 | 4.7%(+3.86)#5,755 |
| 71. | Canada Creek Ranch | 8.5% | 3.5%(+5.07)#71 | 4.7%(+3.85)#5,761 |
| 72. | Hardwood Acres | 8.5% | 3.5%(+5.05)#72 | 4.7%(+3.83)#5,788 |
| 73. | Northport | 8.5% | 3.5%(+5.03)#73 | 4.7%(+3.81)#5,808 |
| 74. | Sault Ste Marie | 8.4% | 3.5%(+4.95)#74 | 4.7%(+3.73)#5,901 |
| 75. | Omer | 8.3% | 3.5%(+4.87)#75 | 4.7%(+3.65)#5,996 |
| 76. | Cambria | 8.3% | 3.5%(+4.79)#76 | 4.7%(+3.57)#6,071 |
| 77. | New Lothrop | 8.2% | 3.5%(+4.76)#77 | 4.7%(+3.53)#6,106 |
| 78. | Hartford | 8.2% | 3.5%(+4.75)#78 | 4.7%(+3.53)#6,119 |
| 79. | Sand Lake | 8.2% | 3.5%(+4.74)#79 | 4.7%(+3.52)#6,133 |
| 80. | Holt | 8.2% | 3.5%(+4.72)#80 | 4.7%(+3.50)#6,163 |
| 81. | Michigan Center | 8.2% | 3.5%(+4.70)#81 | 4.7%(+3.48)#6,179 |
| 82. | Beulah | 8.2% | 3.5%(+4.70)#82 | 4.7%(+3.48)#6,184 |
| 83. | Negaunee | 8.1% | 3.5%(+4.66)#83 | 4.7%(+3.44)#6,221 |
| 84. | Jasper | 8.0% | 3.5%(+4.56)#84 | 4.7%(+3.34)#6,333 |
| 85. | West Ishpeming | 7.8% | 3.5%(+4.33)#85 | 4.7%(+3.11)#6,596 |
| 86. | Harbor Springs | 7.8% | 3.5%(+4.31)#86 | 4.7%(+3.08)#6,627 |
| 87. | Lansing | 7.8% | 3.5%(+4.30)#87 | 4.7%(+3.08)#6,630 |
| 88. | Lake Linden | 7.7% | 3.5%(+4.28)#88 | 4.7%(+3.06)#6,656 |
| 89. | Okemos | 7.7% | 3.5%(+4.28)#89 | 4.7%(+3.06)#6,657 |
| 90. | Highland Park | 7.7% | 3.5%(+4.28)#90 | 4.7%(+3.05)#6,672 |
| 91. | Grand Ledge | 7.7% | 3.5%(+4.26)#91 | 4.7%(+3.04)#6,691 |
| 92. | Bath | 7.7% | 3.5%(+4.22)#92 | 4.7%(+3.00)#6,767 |
| 93. | Port Austin | 7.6% | 3.5%(+4.18)#93 | 4.7%(+2.96)#6,809 |
| 94. | Ontonagon | 7.6% | 3.5%(+4.17)#94 | 4.7%(+2.95)#6,815 |
| 95. | New Era | 7.6% | 3.5%(+4.16)#95 | 4.7%(+2.94)#6,829 |
| 96. | Brooklyn | 7.5% | 3.5%(+4.08)#96 | 4.7%(+2.86)#6,932 |
| 97. | New Baltimore | 7.5% | 3.5%(+4.08)#97 | 4.7%(+2.85)#6,936 |
| 98. | Britton | 7.5% | 3.5%(+4.05)#98 | 4.7%(+2.82)#6,984 |
| 99. | Houghton Lake | 7.5% | 3.5%(+3.99)#99 | 4.7%(+2.77)#7,057 |
| 100. | Eau Claire | 7.4% | 3.5%(+3.96)#100 | 4.7%(+2.73)#7,088 |
Common Questions
What are the Top 10 Cities with the Highest Percentage of Population Employed in Public Administration in Michigan?
Top 10 Cities with the Highest Percentage of Population Employed in Public Administration in Michigan are:
#1
32.5%
#2
28.6%
#3
28.2%
#4
26.6%
#5
19.5%
#6
18.3%
#7
15.8%
#8
15.4%
#9
15.1%
#10
15.1%
What city has the Highest Percentage of Population Employed in Public Administration in Michigan?
Marenisco has the Highest Percentage of Population Employed in Public Administration in Michigan with 32.5%.
What is the Percentage of Population Employed in Public Administration in the State of Michigan?
Percentage of Population Employed in Public Administration in Michigan is 3.5%.
What is the Percentage of Population Employed in Public Administration in the United States?
Percentage of Population Employed in Public Administration in the United States is 4.7%.