Cities with the Highest Percentage of Population Employed in Public Administration in Pennsylvania
RELATED REPORTS & OPTIONS
Public Administration
Pennsylvania
Compare Cities
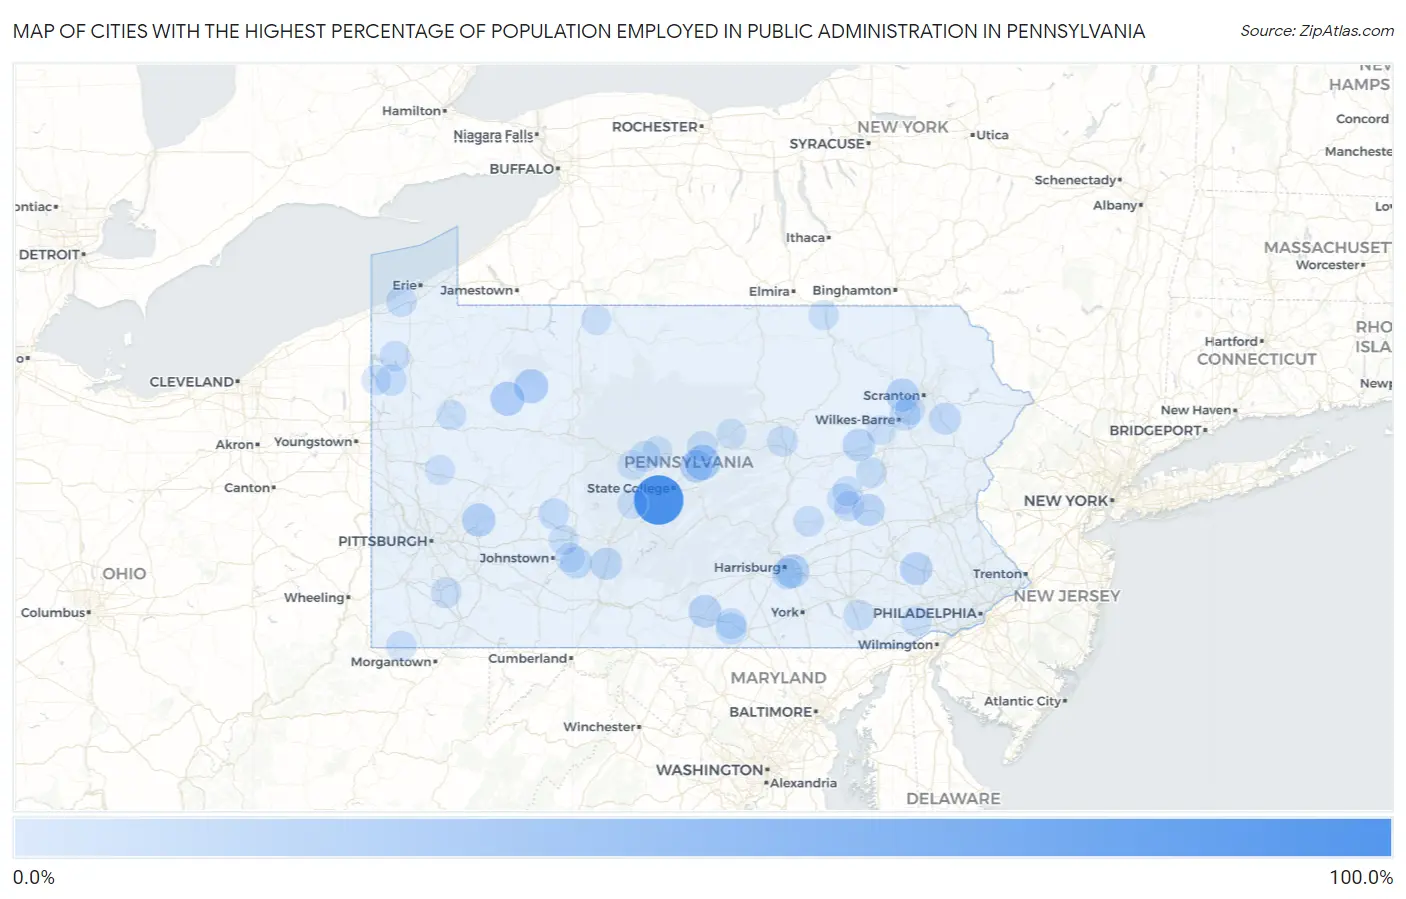
Map of Cities with the Highest Percentage of Population Employed in Public Administration in Pennsylvania
0.0%
100.0%
Cities with the Highest Percentage of Population Employed in Public Administration in Pennsylvania
| City | % Employed | vs State | vs National | |
| 1. | Baileyville | 100.0% | 4.0%(+96.0)#1 | 4.7%(+95.3)#6 |
| 2. | Roots | 73.8% | 4.0%(+69.8)#2 | 4.7%(+69.1)#50 |
| 3. | Hublersburg | 33.8% | 4.0%(+29.8)#3 | 4.7%(+29.1)#359 |
| 4. | Marienville | 29.1% | 4.0%(+25.1)#4 | 4.7%(+24.4)#515 |
| 5. | Tylersburg | 29.0% | 4.0%(+25.0)#5 | 4.7%(+24.3)#516 |
| 6. | Orangeville Borough | 28.1% | 4.0%(+24.1)#6 | 4.7%(+23.4)#558 |
| 7. | Oberlin | 27.8% | 4.0%(+23.8)#7 | 4.7%(+23.1)#575 |
| 8. | Clintondale | 27.5% | 4.0%(+23.5)#8 | 4.7%(+22.8)#592 |
| 9. | Clintonville Borough | 27.2% | 4.0%(+23.2)#9 | 4.7%(+22.5)#603 |
| 10. | Eagle Creek | 26.5% | 4.0%(+22.5)#10 | 4.7%(+21.8)#635 |
| 11. | Oklahoma | 26.2% | 4.0%(+22.2)#11 | 4.7%(+21.5)#653 |
| 12. | St Clairsville Borough | 25.6% | 4.0%(+21.6)#12 | 4.7%(+21.0)#685 |
| 13. | Upper Exeter | 24.7% | 4.0%(+20.6)#13 | 4.7%(+20.0)#765 |
| 14. | Scotland | 23.3% | 4.0%(+19.3)#14 | 4.7%(+18.7)#870 |
| 15. | Mingoville | 23.2% | 4.0%(+19.2)#15 | 4.7%(+18.5)#883 |
| 16. | Douglassville | 23.1% | 4.0%(+19.1)#16 | 4.7%(+18.4)#890 |
| 17. | Ohiopyle Borough | 22.7% | 4.0%(+18.7)#17 | 4.7%(+18.0)#914 |
| 18. | Reightown | 22.6% | 4.0%(+18.6)#18 | 4.7%(+17.9)#930 |
| 19. | Foundryville | 22.2% | 4.0%(+18.2)#19 | 4.7%(+17.5)#967 |
| 20. | Renningers | 21.0% | 4.0%(+17.0)#20 | 4.7%(+16.3)#1,084 |
| 21. | Claysburg | 20.7% | 4.0%(+16.6)#21 | 4.7%(+16.0)#1,112 |
| 22. | Holters Crossing | 20.3% | 4.0%(+16.2)#22 | 4.7%(+15.6)#1,157 |
| 23. | Big Bass Lake | 19.7% | 4.0%(+15.7)#23 | 4.7%(+15.0)#1,233 |
| 24. | Glen Hope Borough | 19.5% | 4.0%(+15.5)#24 | 4.7%(+14.8)#1,268 |
| 25. | Summerhill Borough | 19.4% | 4.0%(+15.4)#25 | 4.7%(+14.7)#1,281 |
| 26. | Dunlo | 19.0% | 4.0%(+15.0)#26 | 4.7%(+14.3)#1,331 |
| 27. | Berlin Borough | 18.5% | 4.0%(+14.5)#27 | 4.7%(+13.9)#1,393 |
| 28. | West Middletown Borough | 18.4% | 4.0%(+14.4)#28 | 4.7%(+13.7)#1,409 |
| 29. | Ramey Borough | 18.2% | 4.0%(+14.2)#29 | 4.7%(+13.5)#1,446 |
| 30. | Shelltown | 18.2% | 4.0%(+14.2)#30 | 4.7%(+13.5)#1,454 |
| 31. | Orrtanna | 18.2% | 4.0%(+14.2)#31 | 4.7%(+13.5)#1,455 |
| 32. | Gilberton Borough | 18.0% | 4.0%(+14.0)#32 | 4.7%(+13.3)#1,483 |
| 33. | Linds Crossing | 18.0% | 4.0%(+14.0)#33 | 4.7%(+13.3)#1,488 |
| 34. | New Baltimore Borough | 17.4% | 4.0%(+13.4)#34 | 4.7%(+12.8)#1,583 |
| 35. | New Market | 17.2% | 4.0%(+13.2)#35 | 4.7%(+12.6)#1,615 |
| 36. | Hudson | 16.7% | 4.0%(+12.7)#36 | 4.7%(+12.0)#1,715 |
| 37. | Tionesta Borough | 16.7% | 4.0%(+12.7)#37 | 4.7%(+12.0)#1,721 |
| 38. | Atlantic | 16.7% | 4.0%(+12.7)#38 | 4.7%(+12.0)#1,734 |
| 39. | Loop | 16.6% | 4.0%(+12.6)#39 | 4.7%(+11.9)#1,748 |
| 40. | Heilwood | 16.5% | 4.0%(+12.5)#40 | 4.7%(+11.8)#1,759 |
| 41. | Moosic Borough | 16.4% | 4.0%(+12.4)#41 | 4.7%(+11.7)#1,779 |
| 42. | Cooperstown Borough | 16.2% | 4.0%(+12.2)#42 | 4.7%(+11.5)#1,815 |
| 43. | Goldsboro Borough | 15.8% | 4.0%(+11.8)#43 | 4.7%(+11.2)#1,895 |
| 44. | Fairview | 15.6% | 4.0%(+11.6)#44 | 4.7%(+10.9)#1,960 |
| 45. | Armagh Borough | 15.6% | 4.0%(+11.5)#45 | 4.7%(+10.9)#1,972 |
| 46. | Allenwood | 15.5% | 4.0%(+11.5)#46 | 4.7%(+10.8)#1,983 |
| 47. | Yarnell | 15.5% | 4.0%(+11.4)#47 | 4.7%(+10.8)#1,993 |
| 48. | Blanchard | 15.4% | 4.0%(+11.4)#48 | 4.7%(+10.7)#2,004 |
| 49. | Milesburg Borough | 15.4% | 4.0%(+11.4)#49 | 4.7%(+10.7)#2,006 |
| 50. | Grassflat | 15.3% | 4.0%(+11.3)#50 | 4.7%(+10.6)#2,038 |
| 51. | Georgetown Cdp Luzerne County | 15.1% | 4.0%(+11.1)#51 | 4.7%(+10.4)#2,082 |
| 52. | Sheakleyville Borough | 15.1% | 4.0%(+11.1)#52 | 4.7%(+10.4)#2,101 |
| 53. | Brave | 15.0% | 4.0%(+11.0)#53 | 4.7%(+10.3)#2,125 |
| 54. | Cashtown | 15.0% | 4.0%(+10.9)#54 | 4.7%(+10.3)#2,135 |
| 55. | Refton | 14.9% | 4.0%(+10.9)#55 | 4.7%(+10.2)#2,147 |
| 56. | Saltillo Borough | 14.9% | 4.0%(+10.9)#56 | 4.7%(+10.2)#2,153 |
| 57. | Waynesburg Borough | 14.8% | 4.0%(+10.8)#57 | 4.7%(+10.1)#2,187 |
| 58. | Wiconsico | 14.6% | 4.0%(+10.6)#58 | 4.7%(+9.92)#2,242 |
| 59. | Sheppton | 14.5% | 4.0%(+10.5)#59 | 4.7%(+9.84)#2,269 |
| 60. | Beurys Lake | 14.3% | 4.0%(+10.3)#60 | 4.7%(+9.60)#2,370 |
| 61. | Fairfield Borough | 14.1% | 4.0%(+10.1)#61 | 4.7%(+9.44)#2,434 |
| 62. | Harmonsburg | 14.1% | 4.0%(+10.1)#62 | 4.7%(+9.40)#2,447 |
| 63. | Allenport | 14.1% | 4.0%(+10.1)#63 | 4.7%(+9.38)#2,452 |
| 64. | Cassville Borough | 14.1% | 4.0%(+10.0)#64 | 4.7%(+9.38)#2,454 |
| 65. | Laporte Borough | 13.9% | 4.0%(+9.87)#65 | 4.7%(+9.20)#2,511 |
| 66. | Foxburg Borough | 13.8% | 4.0%(+9.73)#66 | 4.7%(+9.06)#2,558 |
| 67. | Salladasburg Borough | 13.7% | 4.0%(+9.67)#67 | 4.7%(+9.00)#2,583 |
| 68. | Callimont Borough | 13.6% | 4.0%(+9.62)#68 | 4.7%(+8.95)#2,611 |
| 69. | Carroll Valley Borough | 13.6% | 4.0%(+9.57)#69 | 4.7%(+8.90)#2,627 |
| 70. | Camp Hill Borough | 13.4% | 4.0%(+9.43)#70 | 4.7%(+8.76)#2,684 |
| 71. | Marysville Borough | 13.4% | 4.0%(+9.43)#71 | 4.7%(+8.76)#2,686 |
| 72. | Northwood | 13.4% | 4.0%(+9.40)#72 | 4.7%(+8.73)#2,702 |
| 73. | Wilmore Borough | 13.3% | 4.0%(+9.32)#73 | 4.7%(+8.65)#2,730 |
| 74. | Branchdale | 13.1% | 4.0%(+9.12)#74 | 4.7%(+8.45)#2,805 |
| 75. | Unionville | 13.0% | 4.0%(+9.00)#75 | 4.7%(+8.33)#2,845 |
| 76. | Moshannon | 12.8% | 4.0%(+8.83)#76 | 4.7%(+8.16)#2,901 |
| 77. | Greens Landing | 12.8% | 4.0%(+8.78)#77 | 4.7%(+8.11)#2,914 |
| 78. | Kennerdell | 12.8% | 4.0%(+8.75)#78 | 4.7%(+8.08)#2,921 |
| 79. | Mundys Corner | 12.7% | 4.0%(+8.66)#79 | 4.7%(+7.99)#2,950 |
| 80. | New Alexandria Borough | 12.6% | 4.0%(+8.58)#80 | 4.7%(+7.91)#2,979 |
| 81. | Pine Grove Borough | 12.5% | 4.0%(+8.51)#81 | 4.7%(+7.84)#3,002 |
| 82. | Jackson Center Borough | 12.5% | 4.0%(+8.48)#82 | 4.7%(+7.81)#3,022 |
| 83. | Browntown | 12.5% | 4.0%(+8.43)#83 | 4.7%(+7.77)#3,052 |
| 84. | Sankertown Borough | 12.4% | 4.0%(+8.40)#84 | 4.7%(+7.73)#3,061 |
| 85. | Beavertown Borough | 12.3% | 4.0%(+8.31)#85 | 4.7%(+7.64)#3,095 |
| 86. | Mcelhattan | 12.2% | 4.0%(+8.20)#86 | 4.7%(+7.53)#3,150 |
| 87. | Wanamie | 12.2% | 4.0%(+8.19)#87 | 4.7%(+7.52)#3,155 |
| 88. | Fountain Springs | 12.2% | 4.0%(+8.16)#88 | 4.7%(+7.49)#3,185 |
| 89. | Brisbin Borough | 12.1% | 4.0%(+8.12)#89 | 4.7%(+7.45)#3,200 |
| 90. | Eagles Mere Borough | 12.1% | 4.0%(+8.11)#90 | 4.7%(+7.44)#3,214 |
| 91. | Paxtang Borough | 12.1% | 4.0%(+8.09)#91 | 4.7%(+7.42)#3,223 |
| 92. | Puzzletown | 12.1% | 4.0%(+8.05)#92 | 4.7%(+7.38)#3,242 |
| 93. | Lykens Borough | 11.9% | 4.0%(+7.93)#93 | 4.7%(+7.26)#3,290 |
| 94. | Shanor Northvue | 11.9% | 4.0%(+7.91)#94 | 4.7%(+7.24)#3,300 |
| 95. | Rew | 11.9% | 4.0%(+7.89)#95 | 4.7%(+7.22)#3,311 |
| 96. | Biglerville Borough | 11.9% | 4.0%(+7.87)#96 | 4.7%(+7.20)#3,316 |
| 97. | St Michael | 11.9% | 4.0%(+7.85)#97 | 4.7%(+7.18)#3,328 |
| 98. | Morrisdale | 11.9% | 4.0%(+7.84)#98 | 4.7%(+7.17)#3,333 |
| 99. | Pymatuning South | 11.9% | 4.0%(+7.84)#99 | 4.7%(+7.17)#3,334 |
| 100. | New Cumberland Borough | 11.8% | 4.0%(+7.82)#100 | 4.7%(+7.15)#3,348 |
Common Questions
What are the Top 10 Cities with the Highest Percentage of Population Employed in Public Administration in Pennsylvania?
Top 10 Cities with the Highest Percentage of Population Employed in Public Administration in Pennsylvania are:
#1
100.0%
#2
33.8%
#3
29.1%
#4
29.0%
#5
27.8%
#6
26.2%
#7
24.7%
#8
23.3%
#9
23.2%
#10
23.1%
What city has the Highest Percentage of Population Employed in Public Administration in Pennsylvania?
Baileyville has the Highest Percentage of Population Employed in Public Administration in Pennsylvania with 100.0%.
What is the Percentage of Population Employed in Public Administration in the State of Pennsylvania?
Percentage of Population Employed in Public Administration in Pennsylvania is 4.0%.
What is the Percentage of Population Employed in Public Administration in the United States?
Percentage of Population Employed in Public Administration in the United States is 4.7%.