Cities with the Highest Percentage of Population Employed in Firefighting & Prevention in Oregon
RELATED REPORTS & OPTIONS
Firefighting & Prevention
Oregon
Compare Cities
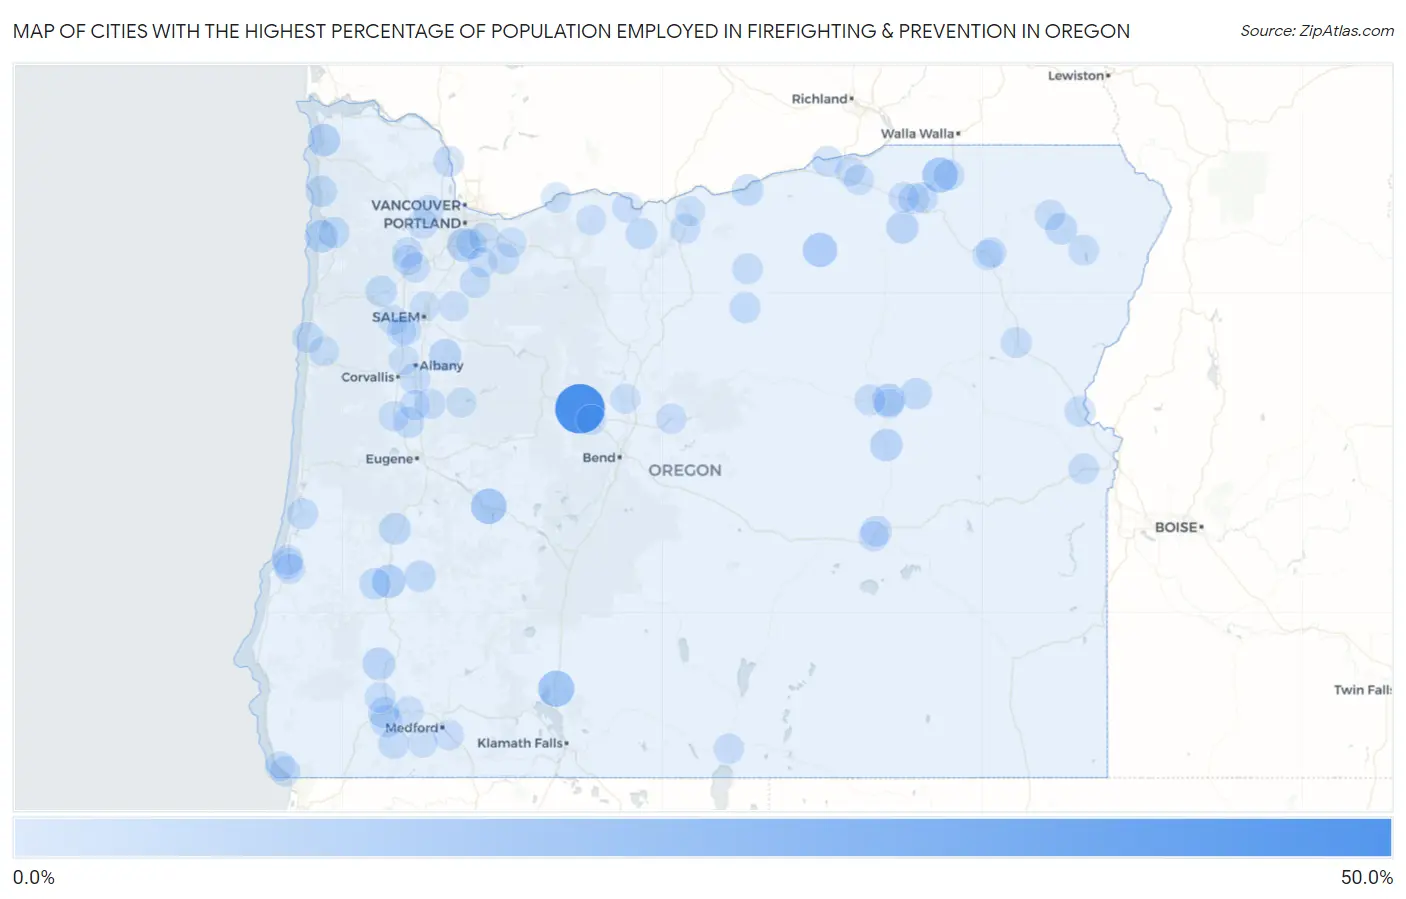
Map of Cities with the Highest Percentage of Population Employed in Firefighting & Prevention in Oregon
0.0%
50.0%
Cities with the Highest Percentage of Population Employed in Firefighting & Prevention in Oregon
| City | % Employed | vs State | vs National | |
| 1. | Black Butte Ranch | 50.0% | 1.1%(+48.9)#1 | 1.2%(+48.8)#16 |
| 2. | Chiloquin | 16.3% | 1.1%(+15.2)#2 | 1.2%(+15.1)#169 |
| 3. | Neotsu | 15.0% | 1.1%(+13.9)#3 | 1.2%(+13.8)#205 |
| 4. | Oakridge | 14.3% | 1.1%(+13.2)#4 | 1.2%(+13.1)#220 |
| 5. | Bayshore | 13.9% | 1.1%(+12.8)#5 | 1.2%(+12.7)#238 |
| 6. | Athena | 13.7% | 1.1%(+12.6)#6 | 1.2%(+12.5)#248 |
| 7. | Heppner | 11.6% | 1.1%(+10.5)#7 | 1.2%(+10.4)#335 |
| 8. | Roseburg North | 9.6% | 1.1%(+8.53)#8 | 1.2%(+8.42)#450 |
| 9. | Stafford | 9.4% | 1.1%(+8.30)#9 | 1.2%(+8.18)#465 |
| 10. | Pleasant Valley | 9.1% | 1.1%(+8.02)#10 | 1.2%(+7.91)#489 |
| 11. | Cheshire | 8.0% | 1.1%(+6.97)#11 | 1.2%(+6.85)#615 |
| 12. | Gearhart | 7.8% | 1.1%(+6.70)#12 | 1.2%(+6.58)#649 |
| 13. | John Day | 7.7% | 1.1%(+6.61)#13 | 1.2%(+6.50)#665 |
| 14. | Glendale | 7.6% | 1.1%(+6.51)#14 | 1.2%(+6.39)#672 |
| 15. | Netarts | 7.4% | 1.1%(+6.37)#15 | 1.2%(+6.25)#691 |
| 16. | Seneca | 6.9% | 1.1%(+5.83)#16 | 1.2%(+5.71)#777 |
| 17. | Scio | 6.3% | 1.1%(+5.23)#17 | 1.2%(+5.11)#894 |
| 18. | Pilot Rock | 6.1% | 1.1%(+5.05)#18 | 1.2%(+4.93)#921 |
| 19. | New Hope | 5.7% | 1.1%(+4.64)#19 | 1.2%(+4.52)#1,043 |
| 20. | Yoncalla | 5.6% | 1.1%(+4.52)#20 | 1.2%(+4.40)#1,071 |
| 21. | Lostine | 5.4% | 1.1%(+4.34)#21 | 1.2%(+4.22)#1,126 |
| 22. | Elmira | 5.0% | 1.1%(+3.93)#22 | 1.2%(+3.81)#1,274 |
| 23. | Melrose | 4.8% | 1.1%(+3.78)#23 | 1.2%(+3.66)#1,330 |
| 24. | Arlington | 4.8% | 1.1%(+3.78)#24 | 1.2%(+3.66)#1,334 |
| 25. | Manzanita | 4.7% | 1.1%(+3.60)#25 | 1.2%(+3.48)#1,414 |
| 26. | Prairie City | 4.6% | 1.1%(+3.56)#26 | 1.2%(+3.45)#1,429 |
| 27. | Sheridan | 4.6% | 1.1%(+3.50)#27 | 1.2%(+3.38)#1,461 |
| 28. | Tillamook | 4.5% | 1.1%(+3.39)#28 | 1.2%(+3.27)#1,520 |
| 29. | Glide | 4.4% | 1.1%(+3.32)#29 | 1.2%(+3.21)#1,567 |
| 30. | Fossil | 4.1% | 1.1%(+3.00)#30 | 1.2%(+2.88)#1,748 |
| 31. | Reedsport | 4.0% | 1.1%(+2.96)#31 | 1.2%(+2.84)#1,779 |
| 32. | Dufur | 4.0% | 1.1%(+2.94)#32 | 1.2%(+2.83)#1,787 |
| 33. | Harrisburg | 4.0% | 1.1%(+2.93)#33 | 1.2%(+2.81)#1,803 |
| 34. | Redwood | 3.6% | 1.1%(+2.58)#34 | 1.2%(+2.46)#2,073 |
| 35. | Yamhill | 3.5% | 1.1%(+2.40)#35 | 1.2%(+2.29)#2,232 |
| 36. | Burns | 3.4% | 1.1%(+2.37)#36 | 1.2%(+2.25)#2,265 |
| 37. | Columbia City | 3.4% | 1.1%(+2.37)#37 | 1.2%(+2.25)#2,269 |
| 38. | Mount Vernon | 3.3% | 1.1%(+2.26)#38 | 1.2%(+2.15)#2,376 |
| 39. | Baker City | 3.3% | 1.1%(+2.21)#39 | 1.2%(+2.09)#2,443 |
| 40. | Molalla | 3.3% | 1.1%(+2.21)#40 | 1.2%(+2.09)#2,444 |
| 41. | Huntington | 3.3% | 1.1%(+2.20)#41 | 1.2%(+2.09)#2,453 |
| 42. | River Road | 3.3% | 1.1%(+2.19)#42 | 1.2%(+2.07)#2,473 |
| 43. | Depoe Bay | 3.2% | 1.1%(+2.13)#43 | 1.2%(+2.01)#2,542 |
| 44. | Weston | 3.2% | 1.1%(+2.11)#44 | 1.2%(+1.99)#2,560 |
| 45. | Condon | 3.1% | 1.1%(+2.01)#45 | 1.2%(+1.89)#2,661 |
| 46. | Estacada | 3.1% | 1.1%(+2.00)#46 | 1.2%(+1.89)#2,669 |
| 47. | Irrigon | 3.0% | 1.1%(+1.93)#47 | 1.2%(+1.82)#2,764 |
| 48. | Tangent | 2.9% | 1.1%(+1.85)#48 | 1.2%(+1.73)#2,893 |
| 49. | Joseph | 2.9% | 1.1%(+1.84)#49 | 1.2%(+1.72)#2,903 |
| 50. | Wallowa | 2.8% | 1.1%(+1.78)#50 | 1.2%(+1.66)#2,979 |
| 51. | Vale | 2.8% | 1.1%(+1.77)#51 | 1.2%(+1.66)#2,983 |
| 52. | Williams | 2.8% | 1.1%(+1.76)#52 | 1.2%(+1.64)#3,009 |
| 53. | Gopher Flats | 2.8% | 1.1%(+1.73)#53 | 1.2%(+1.61)#3,043 |
| 54. | Kirkpatrick | 2.8% | 1.1%(+1.71)#54 | 1.2%(+1.59)#3,080 |
| 55. | Cornelius | 2.7% | 1.1%(+1.62)#55 | 1.2%(+1.50)#3,212 |
| 56. | Chenoweth | 2.7% | 1.1%(+1.59)#56 | 1.2%(+1.48)#3,251 |
| 57. | Merlin | 2.6% | 1.1%(+1.57)#57 | 1.2%(+1.45)#3,285 |
| 58. | Coos Bay | 2.6% | 1.1%(+1.57)#58 | 1.2%(+1.45)#3,287 |
| 59. | Harbor | 2.6% | 1.1%(+1.56)#59 | 1.2%(+1.44)#3,307 |
| 60. | Monroe | 2.6% | 1.1%(+1.50)#60 | 1.2%(+1.38)#3,409 |
| 61. | Prineville | 2.5% | 1.1%(+1.48)#61 | 1.2%(+1.36)#3,456 |
| 62. | Hines | 2.5% | 1.1%(+1.44)#62 | 1.2%(+1.32)#3,547 |
| 63. | Lakeview | 2.5% | 1.1%(+1.40)#63 | 1.2%(+1.28)#3,619 |
| 64. | Pendleton | 2.5% | 1.1%(+1.39)#64 | 1.2%(+1.27)#3,648 |
| 65. | Brownsville | 2.4% | 1.1%(+1.30)#65 | 1.2%(+1.18)#3,820 |
| 66. | North Bend | 2.4% | 1.1%(+1.29)#66 | 1.2%(+1.17)#3,856 |
| 67. | Boring | 2.3% | 1.1%(+1.26)#67 | 1.2%(+1.14)#3,901 |
| 68. | Bunker Hill | 2.3% | 1.1%(+1.24)#68 | 1.2%(+1.13)#3,945 |
| 69. | Halsey | 2.2% | 1.1%(+1.17)#69 | 1.2%(+1.05)#4,124 |
| 70. | Cherry Grove | 2.2% | 1.1%(+1.14)#70 | 1.2%(+1.02)#4,180 |
| 71. | Jennings Lodge | 2.2% | 1.1%(+1.14)#71 | 1.2%(+1.02)#4,181 |
| 72. | La Grande | 2.2% | 1.1%(+1.10)#72 | 1.2%(+0.985)#4,263 |
| 73. | Phoenix | 2.2% | 1.1%(+1.08)#73 | 1.2%(+0.965)#4,314 |
| 74. | Sisters | 2.1% | 1.1%(+1.06)#74 | 1.2%(+0.942)#4,375 |
| 75. | Independence | 2.1% | 1.1%(+1.01)#75 | 1.2%(+0.897)#4,491 |
| 76. | Stanfield | 2.1% | 1.1%(+1.01)#76 | 1.2%(+0.893)#4,503 |
| 77. | Island City | 2.1% | 1.1%(+1.01)#77 | 1.2%(+0.893)#4,504 |
| 78. | Siletz | 2.0% | 1.1%(+0.972)#78 | 1.2%(+0.855)#4,609 |
| 79. | Lafayette | 2.0% | 1.1%(+0.962)#79 | 1.2%(+0.844)#4,638 |
| 80. | North Plains | 2.0% | 1.1%(+0.919)#80 | 1.2%(+0.802)#4,781 |
| 81. | Moro | 2.0% | 1.1%(+0.892)#81 | 1.2%(+0.775)#4,869 |
| 82. | Brookings | 1.9% | 1.1%(+0.849)#82 | 1.2%(+0.732)#4,994 |
| 83. | Adair Village | 1.8% | 1.1%(+0.774)#83 | 1.2%(+0.657)#5,246 |
| 84. | Dallas | 1.8% | 1.1%(+0.699)#84 | 1.2%(+0.581)#5,506 |
| 85. | Silverton | 1.8% | 1.1%(+0.699)#85 | 1.2%(+0.581)#5,507 |
| 86. | Cascade Locks | 1.7% | 1.1%(+0.649)#86 | 1.2%(+0.532)#5,674 |
| 87. | Ruch | 1.7% | 1.1%(+0.629)#87 | 1.2%(+0.512)#5,746 |
| 88. | Happy Valley | 1.7% | 1.1%(+0.622)#88 | 1.2%(+0.505)#5,780 |
| 89. | Canyon City | 1.7% | 1.1%(+0.584)#89 | 1.2%(+0.467)#5,929 |
| 90. | Sandy | 1.6% | 1.1%(+0.574)#90 | 1.2%(+0.457)#5,962 |
| 91. | Crooked River Ranch | 1.6% | 1.1%(+0.558)#91 | 1.2%(+0.440)#6,024 |
| 92. | Keizer | 1.6% | 1.1%(+0.556)#92 | 1.2%(+0.438)#6,032 |
| 93. | Carlton | 1.6% | 1.1%(+0.550)#93 | 1.2%(+0.433)#6,048 |
| 94. | Monmouth | 1.6% | 1.1%(+0.500)#94 | 1.2%(+0.383)#6,244 |
| 95. | Rogue River | 1.6% | 1.1%(+0.499)#95 | 1.2%(+0.382)#6,246 |
| 96. | Mount Hood | 1.6% | 1.1%(+0.499)#96 | 1.2%(+0.381)#6,254 |
| 97. | Beavercreek | 1.6% | 1.1%(+0.495)#97 | 1.2%(+0.377)#6,275 |
| 98. | Wasco | 1.6% | 1.1%(+0.494)#98 | 1.2%(+0.377)#6,282 |
| 99. | Sweet Home | 1.5% | 1.1%(+0.477)#99 | 1.2%(+0.360)#6,353 |
| 100. | Hermiston | 1.5% | 1.1%(+0.461)#100 | 1.2%(+0.344)#6,421 |
Common Questions
What are the Top 10 Cities with the Highest Percentage of Population Employed in Firefighting & Prevention in Oregon?
Top 10 Cities with the Highest Percentage of Population Employed in Firefighting & Prevention in Oregon are:
#1
50.0%
#2
16.3%
#3
14.3%
#4
13.7%
#5
11.6%
#6
9.6%
#7
9.4%
#8
7.8%
#9
7.7%
#10
7.6%
What city has the Highest Percentage of Population Employed in Firefighting & Prevention in Oregon?
Black Butte Ranch has the Highest Percentage of Population Employed in Firefighting & Prevention in Oregon with 50.0%.
What is the Percentage of Population Employed in Firefighting & Prevention in the State of Oregon?
Percentage of Population Employed in Firefighting & Prevention in Oregon is 1.1%.
What is the Percentage of Population Employed in Firefighting & Prevention in the United States?
Percentage of Population Employed in Firefighting & Prevention in the United States is 1.2%.