Cities with the Highest Percentage of Population Employed in Firefighting & Prevention in New York
RELATED REPORTS & OPTIONS
Firefighting & Prevention
New York
Compare Cities
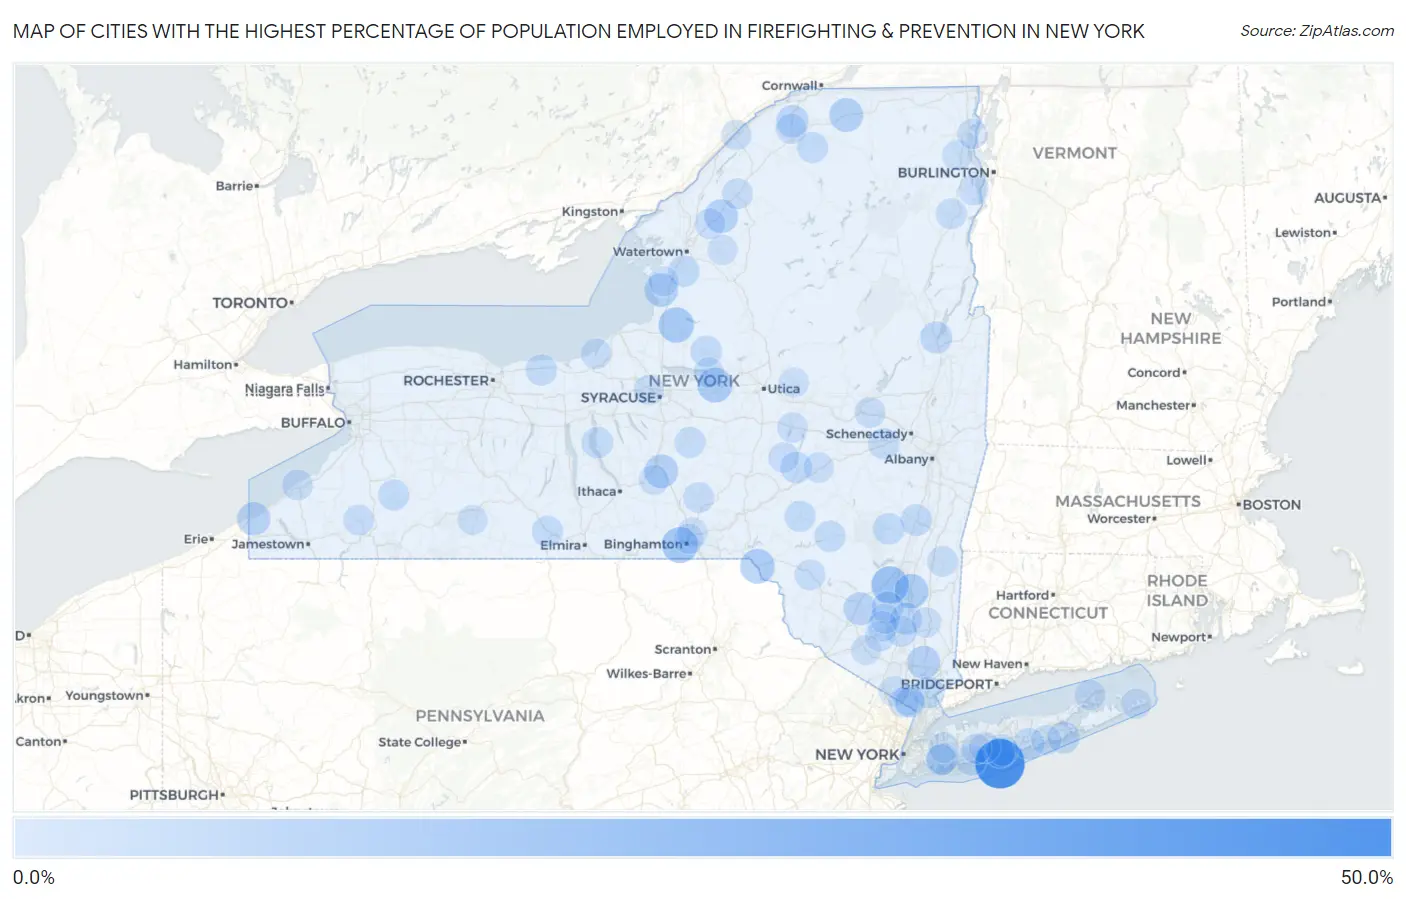
Map of Cities with the Highest Percentage of Population Employed in Firefighting & Prevention in New York
0.0%
50.0%
Cities with the Highest Percentage of Population Employed in Firefighting & Prevention in New York
| City | % Employed | vs State | vs National | |
| 1. | Ocean Beach | 50.0% | 1.6%(+48.4)#1 | 1.2%(+48.8)#19 |
| 2. | High Falls | 20.0% | 1.6%(+18.4)#2 | 1.2%(+18.8)#113 |
| 3. | Binghamton University | 16.9% | 1.6%(+15.3)#3 | 1.2%(+15.7)#156 |
| 4. | Altmar | 15.4% | 1.6%(+13.8)#4 | 1.2%(+14.2)#192 |
| 5. | Durhamville | 14.5% | 1.6%(+12.9)#5 | 1.2%(+13.3)#217 |
| 6. | Hancock | 13.9% | 1.6%(+12.3)#6 | 1.2%(+12.7)#235 |
| 7. | Mclean | 13.9% | 1.6%(+12.3)#7 | 1.2%(+12.7)#239 |
| 8. | Hyde Park | 13.4% | 1.6%(+11.9)#8 | 1.2%(+12.2)#257 |
| 9. | Brushton | 12.0% | 1.6%(+10.4)#9 | 1.2%(+10.8)#307 |
| 10. | Blodgett Mills | 11.5% | 1.6%(+9.94)#10 | 1.2%(+10.3)#340 |
| 11. | Antwerp | 11.4% | 1.6%(+9.79)#11 | 1.2%(+10.2)#349 |
| 12. | Ellisburg | 11.1% | 1.6%(+9.54)#12 | 1.2%(+9.93)#362 |
| 13. | Ripley | 10.7% | 1.6%(+9.11)#13 | 1.2%(+9.50)#381 |
| 14. | Walworth | 10.2% | 1.6%(+8.64)#14 | 1.2%(+9.03)#409 |
| 15. | Shrub Oak | 10.2% | 1.6%(+8.61)#15 | 1.2%(+9.00)#410 |
| 16. | Cragsmoor | 9.8% | 1.6%(+8.25)#16 | 1.2%(+8.64)#430 |
| 17. | North Granville | 9.1% | 1.6%(+7.57)#17 | 1.2%(+7.96)#486 |
| 18. | Norfolk | 8.9% | 1.6%(+7.33)#18 | 1.2%(+7.72)#516 |
| 19. | Gardiner | 8.2% | 1.6%(+6.63)#19 | 1.2%(+7.02)#592 |
| 20. | Chelsea Cove | 7.8% | 1.6%(+6.20)#20 | 1.2%(+6.59)#648 |
| 21. | Lake George | 7.7% | 1.6%(+6.13)#21 | 1.2%(+6.52)#655 |
| 22. | Quogue | 7.5% | 1.6%(+5.91)#22 | 1.2%(+6.30)#680 |
| 23. | Marlboro | 7.5% | 1.6%(+5.90)#23 | 1.2%(+6.29)#682 |
| 24. | Highland-On-The-Lake | 7.5% | 1.6%(+5.89)#24 | 1.2%(+6.28)#684 |
| 25. | New Hamburg | 7.1% | 1.6%(+5.51)#25 | 1.2%(+5.90)#745 |
| 26. | Thornwood | 6.8% | 1.6%(+5.27)#26 | 1.2%(+5.66)#786 |
| 27. | Tannersville | 6.8% | 1.6%(+5.23)#27 | 1.2%(+5.62)#790 |
| 28. | Brookhaven | 6.7% | 1.6%(+5.10)#28 | 1.2%(+5.49)#817 |
| 29. | Milford | 6.5% | 1.6%(+4.95)#29 | 1.2%(+5.34)#844 |
| 30. | Leeds | 6.5% | 1.6%(+4.89)#30 | 1.2%(+5.28)#858 |
| 31. | Burlington Flats | 6.5% | 1.6%(+4.88)#31 | 1.2%(+5.27)#864 |
| 32. | Rodman | 6.4% | 1.6%(+4.83)#32 | 1.2%(+5.22)#870 |
| 33. | Oakdale | 6.1% | 1.6%(+4.50)#33 | 1.2%(+4.89)#933 |
| 34. | Malverne Park Oaks | 6.0% | 1.6%(+4.47)#34 | 1.2%(+4.86)#945 |
| 35. | Margaretville | 6.0% | 1.6%(+4.44)#35 | 1.2%(+4.83)#955 |
| 36. | Amityville | 6.0% | 1.6%(+4.40)#36 | 1.2%(+4.79)#960 |
| 37. | Aurora | 5.9% | 1.6%(+4.32)#37 | 1.2%(+4.71)#986 |
| 38. | Grahamsville | 5.8% | 1.6%(+4.23)#38 | 1.2%(+4.62)#1,015 |
| 39. | Camden | 5.8% | 1.6%(+4.19)#39 | 1.2%(+4.58)#1,023 |
| 40. | Williamson | 5.8% | 1.6%(+4.19)#40 | 1.2%(+4.58)#1,025 |
| 41. | Coopers Plains | 5.6% | 1.6%(+4.02)#41 | 1.2%(+4.41)#1,068 |
| 42. | Delhi | 5.6% | 1.6%(+4.02)#42 | 1.2%(+4.41)#1,069 |
| 43. | Parishville | 5.6% | 1.6%(+4.00)#43 | 1.2%(+4.39)#1,078 |
| 44. | North Lynbrook | 5.6% | 1.6%(+3.98)#44 | 1.2%(+4.37)#1,084 |
| 45. | Delanson | 5.6% | 1.6%(+3.98)#45 | 1.2%(+4.37)#1,085 |
| 46. | Machias | 5.5% | 1.6%(+3.91)#46 | 1.2%(+4.30)#1,103 |
| 47. | Deruyter | 5.4% | 1.6%(+3.79)#47 | 1.2%(+4.18)#1,141 |
| 48. | Balmville | 5.3% | 1.6%(+3.74)#48 | 1.2%(+4.13)#1,164 |
| 49. | Baywood | 5.2% | 1.6%(+3.65)#49 | 1.2%(+4.04)#1,198 |
| 50. | Mount Vision | 5.0% | 1.6%(+3.42)#50 | 1.2%(+3.81)#1,277 |
| 51. | Livingston Manor | 4.9% | 1.6%(+3.31)#51 | 1.2%(+3.70)#1,312 |
| 52. | Jefferson | 4.8% | 1.6%(+3.26)#52 | 1.2%(+3.65)#1,341 |
| 53. | Elizabethtown | 4.8% | 1.6%(+3.26)#53 | 1.2%(+3.65)#1,346 |
| 54. | Tribes Hill | 4.7% | 1.6%(+3.17)#54 | 1.2%(+3.56)#1,378 |
| 55. | Gouverneur | 4.7% | 1.6%(+3.17)#55 | 1.2%(+3.56)#1,383 |
| 56. | Pine Plains | 4.7% | 1.6%(+3.13)#56 | 1.2%(+3.52)#1,401 |
| 57. | Dunkirk | 4.7% | 1.6%(+3.09)#57 | 1.2%(+3.48)#1,412 |
| 58. | Little Valley | 4.7% | 1.6%(+3.08)#58 | 1.2%(+3.47)#1,420 |
| 59. | Smithville Flats | 4.7% | 1.6%(+3.08)#59 | 1.2%(+3.47)#1,423 |
| 60. | Blauvelt | 4.6% | 1.6%(+3.06)#60 | 1.2%(+3.45)#1,426 |
| 61. | Willsboro | 4.6% | 1.6%(+3.00)#61 | 1.2%(+3.39)#1,457 |
| 62. | Wells Bridge | 4.5% | 1.6%(+2.97)#62 | 1.2%(+3.36)#1,472 |
| 63. | Richfield Springs | 4.5% | 1.6%(+2.93)#63 | 1.2%(+3.32)#1,500 |
| 64. | Siena College | 4.5% | 1.6%(+2.91)#64 | 1.2%(+3.30)#1,512 |
| 65. | Sylvan Beach | 4.4% | 1.6%(+2.85)#65 | 1.2%(+3.24)#1,539 |
| 66. | Peru | 4.4% | 1.6%(+2.84)#66 | 1.2%(+3.23)#1,541 |
| 67. | Cumberland Head | 4.4% | 1.6%(+2.82)#67 | 1.2%(+3.21)#1,556 |
| 68. | Philadelphia | 4.4% | 1.6%(+2.80)#68 | 1.2%(+3.19)#1,573 |
| 69. | Norwood | 4.4% | 1.6%(+2.78)#69 | 1.2%(+3.17)#1,582 |
| 70. | East Worcester | 4.3% | 1.6%(+2.77)#70 | 1.2%(+3.16)#1,590 |
| 71. | Pearl River | 4.3% | 1.6%(+2.73)#71 | 1.2%(+3.12)#1,618 |
| 72. | Nazareth College | 4.3% | 1.6%(+2.73)#72 | 1.2%(+3.12)#1,622 |
| 73. | Hartwick | 4.2% | 1.6%(+2.67)#73 | 1.2%(+3.06)#1,647 |
| 74. | Greenport West | 4.2% | 1.6%(+2.66)#74 | 1.2%(+3.05)#1,650 |
| 75. | Fair Haven | 4.2% | 1.6%(+2.59)#75 | 1.2%(+2.98)#1,682 |
| 76. | Brewster Heights | 4.1% | 1.6%(+2.53)#76 | 1.2%(+2.92)#1,722 |
| 77. | Lakeland | 4.1% | 1.6%(+2.52)#77 | 1.2%(+2.91)#1,731 |
| 78. | Worcester | 4.0% | 1.6%(+2.45)#78 | 1.2%(+2.84)#1,781 |
| 79. | Walden | 3.9% | 1.6%(+2.32)#79 | 1.2%(+2.71)#1,855 |
| 80. | Ogdensburg | 3.9% | 1.6%(+2.31)#80 | 1.2%(+2.70)#1,865 |
| 81. | Great River | 3.9% | 1.6%(+2.28)#81 | 1.2%(+2.67)#1,881 |
| 82. | Williston Park | 3.8% | 1.6%(+2.24)#82 | 1.2%(+2.63)#1,916 |
| 83. | Viola | 3.8% | 1.6%(+2.22)#83 | 1.2%(+2.61)#1,930 |
| 84. | Montauk | 3.8% | 1.6%(+2.22)#84 | 1.2%(+2.61)#1,932 |
| 85. | Chenango Bridge | 3.8% | 1.6%(+2.21)#85 | 1.2%(+2.60)#1,935 |
| 86. | Middleville | 3.8% | 1.6%(+2.19)#86 | 1.2%(+2.58)#1,953 |
| 87. | Port Dickinson | 3.8% | 1.6%(+2.18)#87 | 1.2%(+2.57)#1,961 |
| 88. | Carthage | 3.7% | 1.6%(+2.13)#88 | 1.2%(+2.52)#2,005 |
| 89. | Maybrook | 3.7% | 1.6%(+2.13)#89 | 1.2%(+2.52)#2,006 |
| 90. | East Moriches | 3.7% | 1.6%(+2.12)#90 | 1.2%(+2.51)#2,029 |
| 91. | Springfield Center | 3.7% | 1.6%(+2.08)#91 | 1.2%(+2.47)#2,060 |
| 92. | Orangeburg | 3.6% | 1.6%(+2.03)#92 | 1.2%(+2.42)#2,117 |
| 93. | Virgil | 3.6% | 1.6%(+2.02)#93 | 1.2%(+2.41)#2,122 |
| 94. | Fort Covington | 3.6% | 1.6%(+2.00)#94 | 1.2%(+2.39)#2,138 |
| 95. | Wallkill | 3.6% | 1.6%(+1.98)#95 | 1.2%(+2.37)#2,154 |
| 96. | Hopewell Junction | 3.6% | 1.6%(+1.97)#96 | 1.2%(+2.36)#2,160 |
| 97. | Belleville | 3.5% | 1.6%(+1.96)#97 | 1.2%(+2.35)#2,168 |
| 98. | Goshen | 3.5% | 1.6%(+1.95)#98 | 1.2%(+2.34)#2,182 |
| 99. | Alfred | 3.5% | 1.6%(+1.92)#99 | 1.2%(+2.31)#2,207 |
| 100. | Wyandanch | 3.5% | 1.6%(+1.90)#100 | 1.2%(+2.29)#2,222 |
Common Questions
What are the Top 10 Cities with the Highest Percentage of Population Employed in Firefighting & Prevention in New York?
Top 10 Cities with the Highest Percentage of Population Employed in Firefighting & Prevention in New York are:
#1
50.0%
#2
20.0%
#3
16.9%
#4
15.4%
#5
14.5%
#6
13.9%
#7
13.4%
#8
12.0%
#9
11.5%
#10
11.4%
What city has the Highest Percentage of Population Employed in Firefighting & Prevention in New York?
Ocean Beach has the Highest Percentage of Population Employed in Firefighting & Prevention in New York with 50.0%.
What is the Percentage of Population Employed in Firefighting & Prevention in the State of New York?
Percentage of Population Employed in Firefighting & Prevention in New York is 1.6%.
What is the Percentage of Population Employed in Firefighting & Prevention in the United States?
Percentage of Population Employed in Firefighting & Prevention in the United States is 1.2%.