Cities with the Highest Percentage of Population Employed in Firefighting & Prevention in Connecticut
RELATED REPORTS & OPTIONS
Firefighting & Prevention
Connecticut
Compare Cities
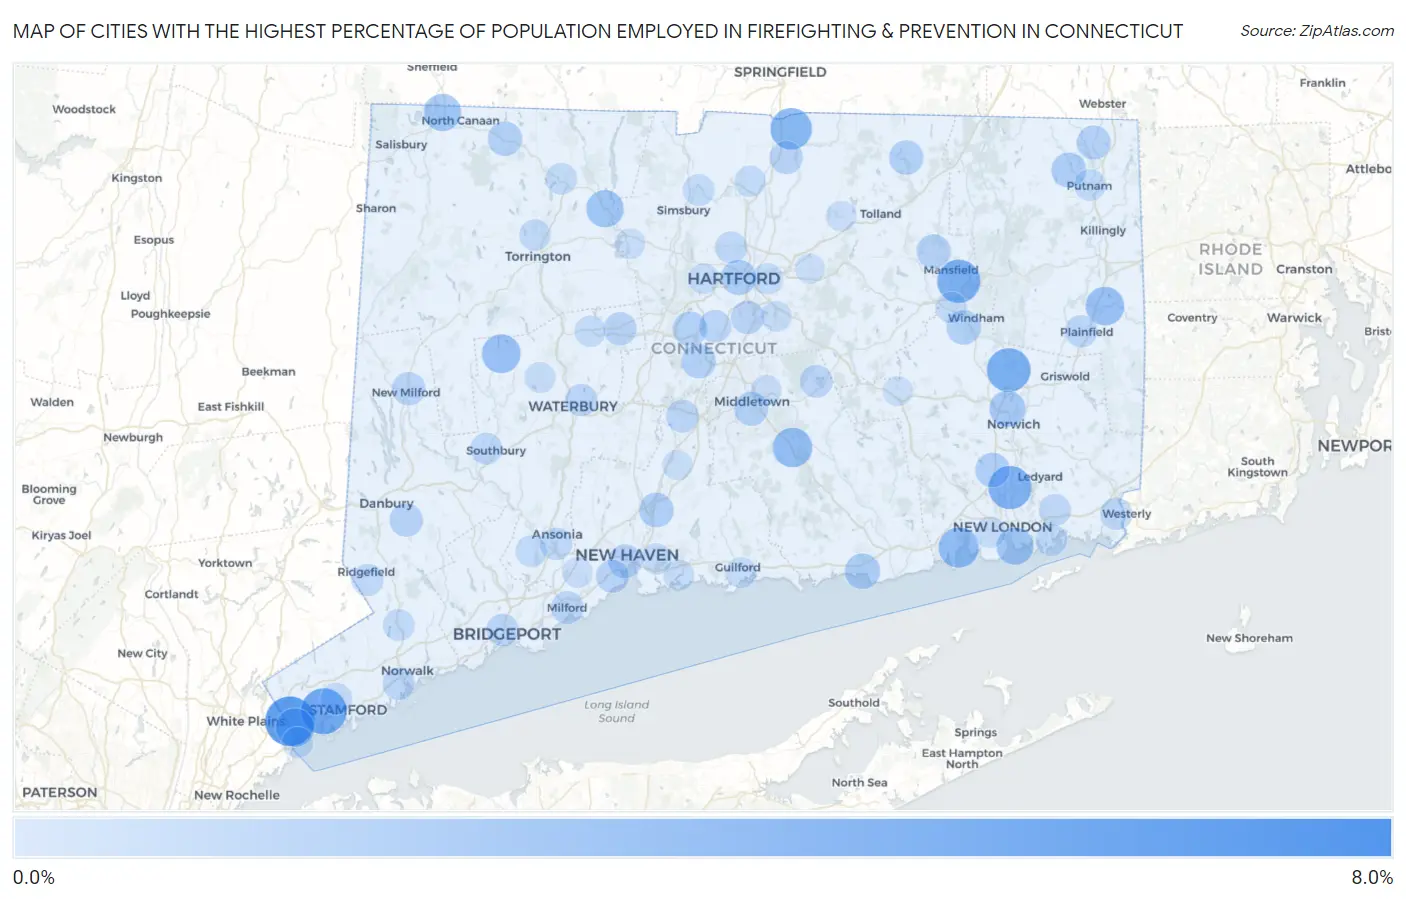
Map of Cities with the Highest Percentage of Population Employed in Firefighting & Prevention in Connecticut
0.0%
8.0%
Cities with the Highest Percentage of Population Employed in Firefighting & Prevention in Connecticut
| City | % Employed | vs State | vs National | |
| 1. | Dayville | 7.0% | 1.1%(+5.90)#1 | 1.2%(+5.78)#767 |
| 2. | Glenville | 6.2% | 1.1%(+5.17)#2 | 1.2%(+5.04)#903 |
| 3. | Cos Cob | 5.1% | 1.1%(+4.03)#3 | 1.2%(+3.90)#1,236 |
| 4. | Sacred Heart University | 4.7% | 1.1%(+3.68)#4 | 1.2%(+3.55)#1,385 |
| 5. | Gaylordsville | 4.5% | 1.1%(+3.42)#5 | 1.2%(+3.29)#1,514 |
| 6. | Baltic | 4.4% | 1.1%(+3.38)#6 | 1.2%(+3.26)#1,530 |
| 7. | Mansfield Center | 4.3% | 1.1%(+3.26)#7 | 1.2%(+3.13)#1,611 |
| 8. | Gales Ferry | 4.3% | 1.1%(+3.25)#8 | 1.2%(+3.13)#1,614 |
| 9. | Weston | 4.3% | 1.1%(+3.20)#9 | 1.2%(+3.07)#1,639 |
| 10. | Sherwood Manor | 3.8% | 1.1%(+2.73)#10 | 1.2%(+2.61)#1,933 |
| 11. | Newtown Borough | 3.7% | 1.1%(+2.61)#11 | 1.2%(+2.48)#2,053 |
| 12. | Niantic | 3.4% | 1.1%(+2.35)#12 | 1.2%(+2.22)#2,304 |
| 13. | Higganum | 3.2% | 1.1%(+2.16)#13 | 1.2%(+2.03)#2,523 |
| 14. | Bethlehem Village | 3.0% | 1.1%(+1.90)#14 | 1.2%(+1.77)#2,845 |
| 15. | Moosup | 2.9% | 1.1%(+1.87)#15 | 1.2%(+1.74)#2,885 |
| 16. | Pemberwick | 2.9% | 1.1%(+1.84)#16 | 1.2%(+1.72)#2,908 |
| 17. | Botsford | 2.9% | 1.1%(+1.82)#17 | 1.2%(+1.70)#2,931 |
| 18. | New Hartford Center | 2.6% | 1.1%(+1.52)#18 | 1.2%(+1.39)#3,394 |
| 19. | Canaan | 2.5% | 1.1%(+1.46)#19 | 1.2%(+1.33)#3,529 |
| 20. | Groton | 2.5% | 1.1%(+1.44)#20 | 1.2%(+1.31)#3,578 |
| 21. | Noroton Heights | 2.5% | 1.1%(+1.43)#21 | 1.2%(+1.31)#3,584 |
| 22. | East | 2.4% | 1.1%(+1.33)#22 | 1.2%(+1.21)#3,767 |
| 23. | Litchfield Borough | 2.3% | 1.1%(+1.22)#23 | 1.2%(+1.09)#4,013 |
| 24. | Quinnipiac University | 2.3% | 1.1%(+1.21)#24 | 1.2%(+1.08)#4,044 |
| 25. | Norwich | 2.2% | 1.1%(+1.14)#25 | 1.2%(+1.01)#4,195 |
| 26. | Lakes West | 2.1% | 1.1%(+1.04)#26 | 1.2%(+0.909)#4,457 |
| 27. | Saybrook Manor | 2.0% | 1.1%(+0.946)#27 | 1.2%(+0.820)#4,712 |
| 28. | Hartford | 1.9% | 1.1%(+0.883)#28 | 1.2%(+0.756)#4,916 |
| 29. | Stepney | 1.9% | 1.1%(+0.875)#29 | 1.2%(+0.748)#4,942 |
| 30. | South Woodstock | 1.8% | 1.1%(+0.779)#30 | 1.2%(+0.653)#5,262 |
| 31. | North Haven | 1.8% | 1.1%(+0.735)#31 | 1.2%(+0.609)#5,416 |
| 32. | Oxoboxo River | 1.7% | 1.1%(+0.668)#32 | 1.2%(+0.541)#5,642 |
| 33. | Norfolk | 1.7% | 1.1%(+0.650)#33 | 1.2%(+0.524)#5,703 |
| 34. | South Windham | 1.7% | 1.1%(+0.640)#34 | 1.2%(+0.514)#5,739 |
| 35. | New Britain | 1.7% | 1.1%(+0.627)#35 | 1.2%(+0.501)#5,794 |
| 36. | Stafford Springs | 1.7% | 1.1%(+0.608)#36 | 1.2%(+0.482)#5,873 |
| 37. | Kensington | 1.7% | 1.1%(+0.605)#37 | 1.2%(+0.478)#5,889 |
| 38. | Storrs | 1.6% | 1.1%(+0.528)#38 | 1.2%(+0.402)#6,164 |
| 39. | Brookfield Center | 1.6% | 1.1%(+0.528)#39 | 1.2%(+0.402)#6,174 |
| 40. | North Grosvenor Dale | 1.6% | 1.1%(+0.508)#40 | 1.2%(+0.382)#6,247 |
| 41. | Middletown | 1.5% | 1.1%(+0.487)#41 | 1.2%(+0.361)#6,348 |
| 42. | New Haven | 1.5% | 1.1%(+0.446)#42 | 1.2%(+0.320)#6,532 |
| 43. | Bethel | 1.4% | 1.1%(+0.364)#43 | 1.2%(+0.238)#6,889 |
| 44. | Wethersfield | 1.4% | 1.1%(+0.337)#44 | 1.2%(+0.211)#7,010 |
| 45. | New Milford | 1.4% | 1.1%(+0.304)#45 | 1.2%(+0.178)#7,173 |
| 46. | Bristol | 1.3% | 1.1%(+0.288)#46 | 1.2%(+0.162)#7,281 |
| 47. | Northford | 1.3% | 1.1%(+0.276)#47 | 1.2%(+0.150)#7,351 |
| 48. | Naugatuck Borough | 1.3% | 1.1%(+0.276)#48 | 1.2%(+0.150)#7,352 |
| 49. | Southwood Acres | 1.3% | 1.1%(+0.258)#49 | 1.2%(+0.132)#7,456 |
| 50. | West Haven | 1.3% | 1.1%(+0.242)#50 | 1.2%(+0.116)#7,544 |
| 51. | Lake Pocotopaug | 1.2% | 1.1%(+0.185)#51 | 1.2%(+0.059)#7,866 |
| 52. | Meriden | 1.2% | 1.1%(+0.169)#52 | 1.2%(+0.043)#7,968 |
| 53. | Milford City Balance | 1.2% | 1.1%(+0.153)#53 | 1.2%(+0.027)#8,063 |
| 54. | Bridgeport | 1.2% | 1.1%(+0.095)#54 | 1.2%(-0.031)#8,421 |
| 55. | Pawcatuck | 1.1% | 1.1%(+0.087)#55 | 1.2%(-0.039)#8,467 |
| 56. | Newington | 1.1% | 1.1%(+0.055)#56 | 1.2%(-0.071)#8,670 |
| 57. | Waterbury | 1.1% | 1.1%(+0.037)#57 | 1.2%(-0.089)#8,794 |
| 58. | Norwalk | 1.1% | 1.1%(+0.029)#58 | 1.2%(-0.097)#8,838 |
| 59. | Plainfield Village | 1.1% | 1.1%(+0.025)#59 | 1.2%(-0.101)#8,875 |
| 60. | Derby | 1.1% | 1.1%(+0.009)#60 | 1.2%(-0.117)#8,974 |
| 61. | Compo | 1.1% | 1.1%(+0.007)#61 | 1.2%(-0.119)#8,983 |
| 62. | Ball Pond | 1.0% | 1.1%(-0.022)#62 | 1.2%(-0.148)#9,172 |
| 63. | Blue Hills | 0.99% | 1.1%(-0.066)#63 | 1.2%(-0.192)#9,438 |
| 64. | Ridgefield | 0.99% | 1.1%(-0.072)#64 | 1.2%(-0.198)#9,482 |
| 65. | Old Mystic | 0.98% | 1.1%(-0.075)#65 | 1.2%(-0.201)#9,509 |
| 66. | Heritage Village | 0.98% | 1.1%(-0.077)#66 | 1.2%(-0.203)#9,518 |
| 67. | Danielson Borough | 0.95% | 1.1%(-0.105)#67 | 1.2%(-0.231)#9,735 |
| 68. | Stamford | 0.94% | 1.1%(-0.120)#68 | 1.2%(-0.246)#9,843 |
| 69. | Wilton Center | 0.94% | 1.1%(-0.123)#69 | 1.2%(-0.249)#9,863 |
| 70. | Noank | 0.93% | 1.1%(-0.129)#70 | 1.2%(-0.255)#9,904 |
| 71. | Tariffville | 0.92% | 1.1%(-0.137)#71 | 1.2%(-0.263)#9,963 |
| 72. | Winsted | 0.91% | 1.1%(-0.146)#72 | 1.2%(-0.272)#10,022 |
| 73. | Putnam | 0.90% | 1.1%(-0.158)#73 | 1.2%(-0.284)#10,104 |
| 74. | Shelton | 0.90% | 1.1%(-0.161)#74 | 1.2%(-0.287)#10,131 |
| 75. | Torrington | 0.87% | 1.1%(-0.191)#75 | 1.2%(-0.317)#10,313 |
| 76. | East Hartford | 0.85% | 1.1%(-0.213)#76 | 1.2%(-0.339)#10,479 |
| 77. | Willimantic | 0.80% | 1.1%(-0.265)#77 | 1.2%(-0.391)#10,848 |
| 78. | Terryville | 0.79% | 1.1%(-0.266)#78 | 1.2%(-0.392)#10,865 |
| 79. | Windsor Locks | 0.77% | 1.1%(-0.286)#79 | 1.2%(-0.412)#11,010 |
| 80. | Byram | 0.77% | 1.1%(-0.294)#80 | 1.2%(-0.420)#11,074 |
| 81. | Daniels Farm | 0.75% | 1.1%(-0.313)#81 | 1.2%(-0.440)#11,195 |
| 82. | New Canaan | 0.73% | 1.1%(-0.326)#82 | 1.2%(-0.452)#11,296 |
| 83. | East Haven | 0.72% | 1.1%(-0.341)#83 | 1.2%(-0.468)#11,403 |
| 84. | Waterford | 0.70% | 1.1%(-0.359)#84 | 1.2%(-0.485)#11,529 |
| 85. | Branford Center | 0.70% | 1.1%(-0.362)#85 | 1.2%(-0.488)#11,554 |
| 86. | Watertown | 0.68% | 1.1%(-0.379)#86 | 1.2%(-0.505)#11,678 |
| 87. | West Hartford | 0.66% | 1.1%(-0.396)#87 | 1.2%(-0.523)#11,831 |
| 88. | Glastonbury Center | 0.65% | 1.1%(-0.414)#88 | 1.2%(-0.540)#11,980 |
| 89. | Guilford Center | 0.64% | 1.1%(-0.417)#89 | 1.2%(-0.543)#11,996 |
| 90. | Orange | 0.61% | 1.1%(-0.454)#90 | 1.2%(-0.580)#12,269 |
| 91. | Trumbull Center | 0.60% | 1.1%(-0.462)#91 | 1.2%(-0.588)#12,332 |
| 92. | Rockville | 0.58% | 1.1%(-0.477)#92 | 1.2%(-0.603)#12,424 |
| 93. | Bantam Borough | 0.58% | 1.1%(-0.482)#93 | 1.2%(-0.608)#12,451 |
| 94. | Collinsville | 0.57% | 1.1%(-0.488)#94 | 1.2%(-0.614)#12,488 |
| 95. | Portland | 0.57% | 1.1%(-0.493)#95 | 1.2%(-0.619)#12,537 |
| 96. | Wallingford Center | 0.56% | 1.1%(-0.497)#96 | 1.2%(-0.623)#12,562 |
| 97. | Tashua | 0.54% | 1.1%(-0.518)#97 | 1.2%(-0.644)#12,715 |
| 98. | Lordship | 0.53% | 1.1%(-0.528)#98 | 1.2%(-0.655)#12,794 |
| 99. | Manchester | 0.49% | 1.1%(-0.570)#99 | 1.2%(-0.696)#13,090 |
| 100. | Colchester | 0.48% | 1.1%(-0.580)#100 | 1.2%(-0.706)#13,155 |
Common Questions
What are the Top 10 Cities with the Highest Percentage of Population Employed in Firefighting & Prevention in Connecticut?
Top 10 Cities with the Highest Percentage of Population Employed in Firefighting & Prevention in Connecticut are:
#1
6.2%
#2
5.1%
#3
4.4%
#4
4.3%
#5
4.3%
#6
3.8%
#7
3.4%
#8
3.2%
#9
3.0%
#10
2.9%
What city has the Highest Percentage of Population Employed in Firefighting & Prevention in Connecticut?
Glenville has the Highest Percentage of Population Employed in Firefighting & Prevention in Connecticut with 6.2%.
What is the Percentage of Population Employed in Firefighting & Prevention in the State of Connecticut?
Percentage of Population Employed in Firefighting & Prevention in Connecticut is 1.1%.
What is the Percentage of Population Employed in Firefighting & Prevention in the United States?
Percentage of Population Employed in Firefighting & Prevention in the United States is 1.2%.