Cities with the Highest Percentage of Population Employed in Firefighting & Prevention in Maine

RELATED REPORTS & OPTIONS

Firefighting & Prevention
Population
Families and Households
Female Fertility
Female Fertility (Unmarried)
Race (Community Size)
Race (Percentage)
Ancestry (Community Size)
AfghanAfricanAlaska NativeAlaskan AthabascanAlbanianAleutAlsatianAmericanApacheArabArapahoArgentineanArmenianAssyrian / Chaldean / SyriacAustralianAustrianBahamianBangladeshiBarbadianBasqueBelgianBelizeanBermudanBhutaneseBlackfeetBolivianBrazilianBritishBritish West IndianBulgarianBurmeseCajunCambodianCanadianCape VerdeanCarpatho RusynCelticCentral AmericanCentral American IndianCherokeeCheyenneChickasawChileanChineseChippewaChoctawColombianColvilleComancheCosta RicanCreeCreekCroatianCrowCubanCypriotCzechCzechoslovakianDanishDelawareDominicanDutchDutch West IndianEastern EuropeanEcuadorianEgyptianEnglishEstonianEthiopianEuropeanFijianFilipinoFinnishFrenchFrench American IndianFrench CanadianGermanGerman RussianGhanaianGreekGuamanian / ChamorroGuatemalanGuyaneseHaitianHmongHonduranHopiHoumaHungarianIcelanderIndian (Asian)IndonesianInupiatIranianIraqiIrishIroquoisIsraeliItalianJamaicanJapaneseJordanianKenyanKiowaKoreanLaotianLatvianLebaneseLiberianLithuanianLumbeeLuxembourgerMacedonianMalaysianMalteseMarshalleseMenomineeMexicanMexican American IndianMongolianMoroccanNative HawaiianNavajoNepaleseNew ZealanderNicaraguanNigerianNorthern EuropeanNorwegianOkinawanOsageOttawaPaiutePakistaniPalestinianPanamanianParaguayanPennsylvania GermanPeruvianPimaPolishPortuguesePotawatomiPuebloPuerto RicanPuget Sound SalishRomanianRussianSalvadoranSamoanScandinavianScotch-IrishScottishSeminoleSenegaleseSerbianShoshoneSierra LeoneanSiouxSlavicSlovakSloveneSomaliSouth AfricanSouth AmericanSouth American IndianSoviet UnionSpaniardSpanishSpanish AmericanSpanish American IndianSri LankanSubsaharan AfricanSudaneseSwedishSwissSyrianTaiwaneseThaiTlingit-HaidaTohono O'OdhamTonganTrinidadian and TobagonianTsimshianTurkishU.S. Virgin IslanderUgandanUkrainianUruguayanUteVenezuelanVietnameseWelshWest IndianYakamaYaquiYugoslavianYumanYup'ikZimbabwean
Ancestry (Percentage)
AfghanAfricanAlaska NativeAlaskan AthabascanAlbanianAleutAlsatianAmericanApacheArabArapahoArgentineanArmenianAssyrian / Chaldean / SyriacAustralianAustrianBahamianBangladeshiBarbadianBasqueBelgianBelizeanBermudanBhutaneseBlackfeetBolivianBrazilianBritishBritish West IndianBulgarianBurmeseCajunCambodianCanadianCape VerdeanCarpatho RusynCelticCentral AmericanCentral American IndianCherokeeCheyenneChickasawChileanChineseChippewaChoctawColombianColvilleComancheCosta RicanCreeCreekCroatianCrowCubanCypriotCzechCzechoslovakianDanishDelawareDominicanDutchDutch West IndianEastern EuropeanEcuadorianEgyptianEnglishEstonianEthiopianEuropeanFijianFilipinoFinnishFrenchFrench American IndianFrench CanadianGermanGerman RussianGhanaianGreekGuamanian / ChamorroGuatemalanGuyaneseHaitianHmongHonduranHopiHoumaHungarianIcelanderIndian (Asian)IndonesianInupiatIranianIraqiIrishIroquoisIsraeliItalianJamaicanJapaneseJordanianKenyanKiowaKoreanLaotianLatvianLebaneseLiberianLithuanianLumbeeLuxembourgerMacedonianMalaysianMalteseMarshalleseMenomineeMexicanMexican American IndianMongolianMoroccanNative HawaiianNavajoNepaleseNew ZealanderNicaraguanNigerianNorthern EuropeanNorwegianOkinawanOsageOttawaPaiutePakistaniPalestinianPanamanianParaguayanPennsylvania GermanPeruvianPimaPolishPortuguesePotawatomiPuebloPuerto RicanPuget Sound SalishRomanianRussianSalvadoranSamoanScandinavianScotch-IrishScottishSeminoleSenegaleseSerbianShoshoneSierra LeoneanSiouxSlavicSlovakSloveneSomaliSouth AfricanSouth AmericanSouth American IndianSoviet UnionSpaniardSpanishSpanish AmericanSpanish American IndianSri LankanSubsaharan AfricanSudaneseSwedishSwissSyrianTaiwaneseThaiTlingit-HaidaTohono O'OdhamTonganTrinidadian and TobagonianTsimshianTurkishU.S. Virgin IslanderUgandanUkrainianUruguayanUteVenezuelanVietnameseWelshWest IndianYakamaYaquiYugoslavianYumanYup'ikZimbabwean
Immigrant Origin (Total)
AfghanistanAfricaAlbaniaArgentinaArmeniaAsiaAustraliaAustriaAzoresBahamasBangladeshBarbadosBelarusBelgiumBelizeBoliviaBosnia and HerzegovinaBrazilBulgariaBurma / MyanmarCabo VerdeCambodiaCameroonCanadaCaribbeanCentral AmericaChileChinaColombiaCongoCosta RicaCroatiaCubaCzechoslovakiaDenmarkDominicaDominican RepublicEastern AfricaEastern AsiaEastern EuropeEcuadorEgyptEl SalvadorEnglandEritreaEthiopiaEuropeFijiFranceGermanyGhanaGreeceGrenadaGuatemalaGuyanaHaitiHondurasHong KongHungaryIndiaIndonesiaIranIraqIrelandIsraelItalyJamaicaJapanJordanKazakhstanKenyaKoreaKuwaitLaosLatin AmericaLatviaLebanonLiberiaLithuaniaMalaysiaMexicoMicronesiaMiddle AfricaMoldovaMoroccoNepalNetherlandsNicaraguaNigeriaNorth MacedoniaNorthern AfricaNorthern EuropeNorwayOceaniaPakistanPanamaPeruPhilippinesPolandPortugalRomaniaRussiaSaudi ArabiaScotlandSenegalSerbiaSierra LeoneSingaporeSomaliaSouth AfricaSouth AmericaSouth Central AsiaSouth Eastern AsiaSouthern EuropeSpainSri LankaSt. Vincent and the GrenadinesSudanSwedenSwitzerlandSyriaTaiwanThailandTrinidad and TobagoTurkeyUgandaUkraineUruguayUzbekistanVenezuelaVietnamWest IndiesWestern AfricaWestern AsiaWestern EuropeYemenZaireZimbabwe
Immigrant Origin (Percentage)
AfghanistanAfricaAlbaniaArgentinaArmeniaAsiaAustraliaAustriaAzoresBahamasBangladeshBarbadosBelarusBelgiumBelizeBoliviaBosnia and HerzegovinaBrazilBulgariaBurma / MyanmarCabo VerdeCambodiaCameroonCanadaCaribbeanCentral AmericaChileChinaColombiaCongoCosta RicaCroatiaCubaCzechoslovakiaDenmarkDominicaDominican RepublicEastern AfricaEastern AsiaEastern EuropeEcuadorEgyptEl SalvadorEnglandEritreaEthiopiaEuropeFijiFranceGermanyGhanaGreeceGrenadaGuatemalaGuyanaHaitiHondurasHong KongHungaryIndiaIndonesiaIranIraqIrelandIsraelItalyJamaicaJapanJordanKazakhstanKenyaKoreaKuwaitLaosLatin AmericaLatviaLebanonLiberiaLithuaniaMalaysiaMexicoMicronesiaMiddle AfricaMoldovaMoroccoNepalNetherlandsNicaraguaNigeriaNorth MacedoniaNorthern AfricaNorthern EuropeNorwayOceaniaPakistanPanamaPeruPhilippinesPolandPortugalRomaniaRussiaSaudi ArabiaScotlandSenegalSerbiaSierra LeoneSingaporeSomaliaSouth AfricaSouth AmericaSouth Central AsiaSouth Eastern AsiaSouthern EuropeSpainSri LankaSt. Vincent and the GrenadinesSudanSwedenSwitzerlandSyriaTaiwanThailandTrinidad and TobagoTurkeyUgandaUkraineUruguayUzbekistanVenezuelaVietnamWest IndiesWestern AfricaWestern AsiaWestern EuropeYemenZaireZimbabwe
Income
Income (Families)
Income (Households)
Poverty
Poverty (Families)
Unemployment
Employment Occupations
Employment Industries
Employer Class
Commute Time
Commute Means
School Enrollment
Education by Degree Field
Occupancy
Finances
Physical Characteristics
Maine
Compare Cities
Comparison Subject

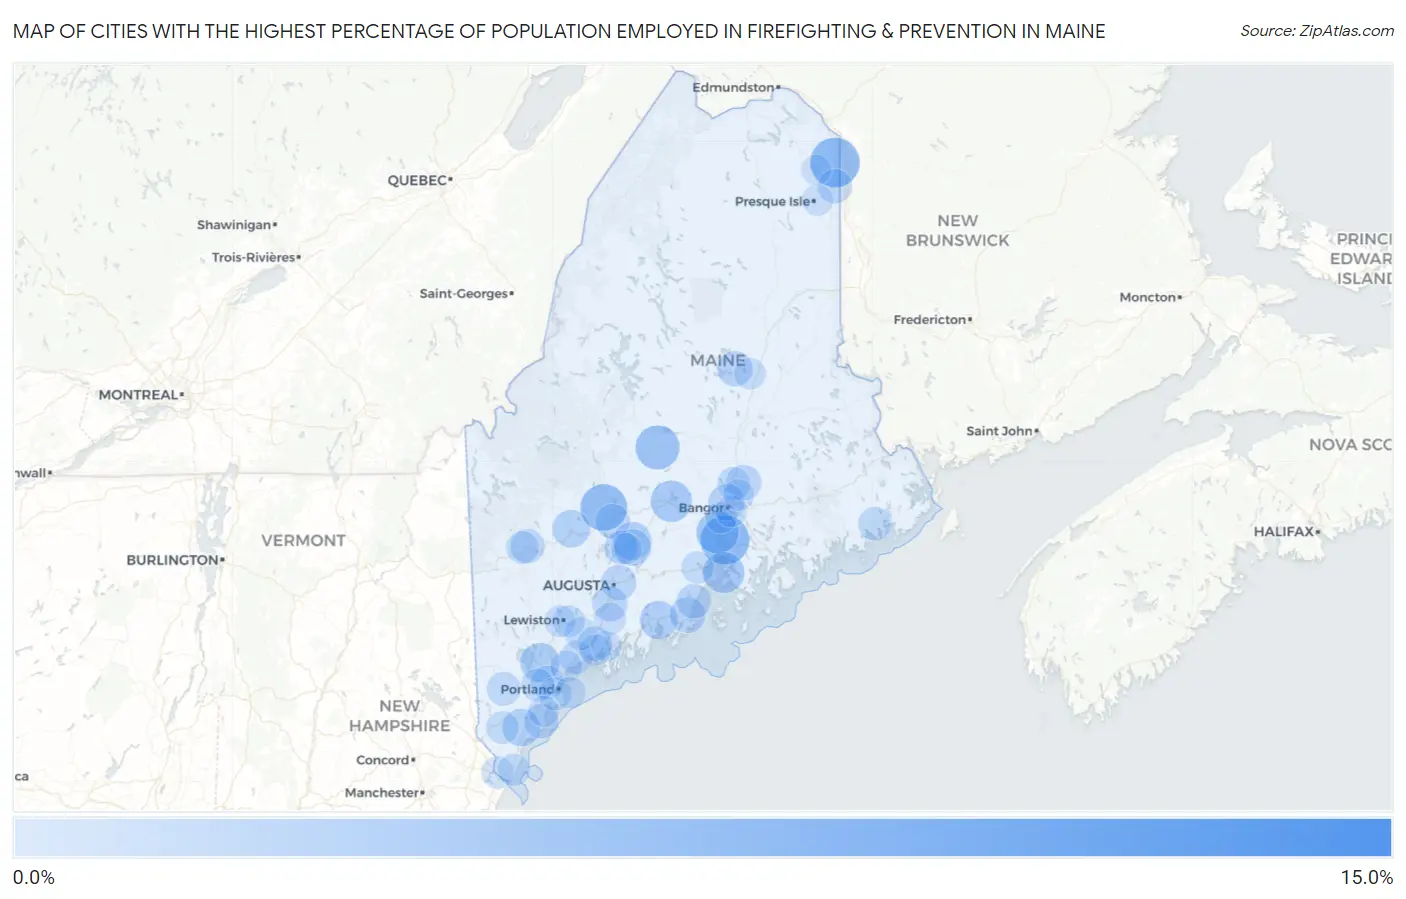
Map of Cities with the Highest Percentage of Population Employed in Firefighting & Prevention in Maine

0.0%
15.0%
Cities with the Highest Percentage of Population Employed in Firefighting & Prevention in Maine Map

Cities with the Highest Percentage of Population Employed in Firefighting & Prevention in Maine

City % Employed vs State vs National
1.Mattawamkeag13.7%0.82%(+12.9)#11.2%(+12.5)#249
2.Lisbon11.4%0.82%(+10.5)#21.2%(+10.2)#348
3.Limestone6.7%0.82%(+5.90)#31.2%(+5.53)#808
4.Bucksport6.4%0.82%(+5.62)#41.2%(+5.25)#865
5.Madison5.7%0.82%(+4.93)#51.2%(+4.56)#1,027
6.Guilford4.8%0.82%(+3.99)#61.2%(+3.62)#1,355
7.Winterport4.2%0.82%(+3.38)#71.2%(+3.01)#1,670
8.Newport3.8%0.82%(+3.03)#81.2%(+2.66)#1,884
9.Castine3.8%0.82%(+3.01)#91.2%(+2.64)#1,907
10.Bethel3.7%0.82%(+2.90)#101.2%(+2.54)#1,992
11.Bradley3.2%0.82%(+2.40)#111.2%(+2.03)#2,524
12.North Windham3.2%0.82%(+2.36)#121.2%(+1.99)#2,565
13.Jonesport3.0%0.82%(+2.22)#131.2%(+1.85)#2,714
14.Fairfield2.8%0.82%(+1.94)#141.2%(+1.57)#3,110
15.Waldoboro2.7%0.82%(+1.93)#151.2%(+1.56)#3,122
16.Farmington2.6%0.82%(+1.79)#161.2%(+1.42)#3,337
17.West Kennebunk2.5%0.82%(+1.72)#171.2%(+1.36)#3,471
18.Kingfield2.4%0.82%(+1.57)#181.2%(+1.20)#3,778
19.Winslow2.3%0.82%(+1.47)#191.2%(+1.10)#3,997
20.Bangor2.1%0.82%(+1.26)#201.2%(+0.890)#4,511
21.Rockland1.9%0.82%(+1.10)#211.2%(+0.736)#4,982
22.Millinocket1.8%0.82%(+1.01)#221.2%(+0.641)#5,304
23.Augusta1.8%0.82%(+0.935)#231.2%(+0.567)#5,555
24.Gardiner1.7%0.82%(+0.927)#241.2%(+0.559)#5,582
25.Milford1.7%0.82%(+0.913)#251.2%(+0.546)#5,624
26.Norridgewock1.6%0.82%(+0.750)#261.2%(+0.382)#6,248
27.Camden1.5%0.82%(+0.704)#271.2%(+0.336)#6,453
28.Topsham1.5%0.82%(+0.684)#281.2%(+0.316)#6,547
29.Biddeford1.5%0.82%(+0.673)#291.2%(+0.305)#6,600
30.Fort Fairfield1.4%0.82%(+0.593)#301.2%(+0.225)#6,949
31.Mexico1.4%0.82%(+0.582)#311.2%(+0.215)#6,995
32.Oak Hill1.3%0.82%(+0.522)#321.2%(+0.155)#7,323
33.Oakland1.3%0.82%(+0.444)#331.2%(+0.076)#7,775
34.Lake Arrowhead1.3%0.82%(+0.437)#341.2%(+0.070)#7,815
35.Freeport1.2%0.82%(+0.338)#351.2%(-0.030)#8,409
36.Machias1.2%0.82%(+0.337)#361.2%(-0.031)#8,418
37.Westbrook1.1%0.82%(+0.314)#371.2%(-0.054)#8,565
38.Old Town1.1%0.82%(+0.258)#381.2%(-0.110)#8,921
39.Gorham0.96%0.82%(+0.139)#391.2%(-0.229)#9,716
40.Lisbon Falls0.96%0.82%(+0.138)#401.2%(-0.230)#9,726
41.South Portland0.94%0.82%(+0.125)#411.2%(-0.243)#9,819
42.Sanford0.91%0.82%(+0.095)#421.2%(-0.272)#10,023
43.Rumford0.86%0.82%(+0.046)#431.2%(-0.322)#10,354
44.Cornish0.86%0.82%(+0.039)#441.2%(-0.329)#10,404
45.South Eliot0.81%0.82%(-0.012)#451.2%(-0.380)#10,770
46.Belfast0.79%0.82%(-0.030)#461.2%(-0.398)#10,906
47.Lewiston0.77%0.82%(-0.049)#471.2%(-0.416)#11,028
48.York Harbor0.74%0.82%(-0.081)#481.2%(-0.449)#11,271
49.Richmond0.66%0.82%(-0.157)#491.2%(-0.524)#11,857
50.Oakfield0.64%0.82%(-0.181)#501.2%(-0.549)#12,038
51.Auburn0.62%0.82%(-0.196)#511.2%(-0.564)#12,141
52.Hampden0.56%0.82%(-0.255)#521.2%(-0.623)#12,561
53.Yarmouth0.56%0.82%(-0.263)#531.2%(-0.630)#12,619
54.Portland0.52%0.82%(-0.297)#541.2%(-0.664)#12,865
55.Brewer0.51%0.82%(-0.308)#551.2%(-0.675)#12,939
56.East Millinocket0.50%0.82%(-0.317)#561.2%(-0.685)#13,014
57.Brunswick0.41%0.82%(-0.405)#571.2%(-0.773)#13,608
58.Presque Isle0.41%0.82%(-0.406)#581.2%(-0.773)#13,609
59.Orono0.38%0.82%(-0.434)#591.2%(-0.801)#13,804
60.Waterville0.33%0.82%(-0.486)#601.2%(-0.854)#14,133
61.Saco0.29%0.82%(-0.527)#611.2%(-0.894)#14,315
62.Bath0.28%0.82%(-0.541)#621.2%(-0.909)#14,404
63.Caribou0.12%0.82%(-0.702)#631.2%(-1.07)#14,923

Common Questions

What are the Top 10 Cities with the Highest Percentage of Population Employed in Firefighting & Prevention in Maine?
Top 10 Cities with the Highest Percentage of Population Employed in Firefighting & Prevention in Maine are:
#1
6.7%
#2
6.4%
#3
5.7%
#4
4.8%
#5
4.2%
#6
3.8%
#7
3.8%
#8
3.2%
#9
2.8%
#10
2.7%
What city has the Highest Percentage of Population Employed in Firefighting & Prevention in Maine?
Limestone has the Highest Percentage of Population Employed in Firefighting & Prevention in Maine with 6.7%.
What is the Percentage of Population Employed in Firefighting & Prevention in the State of Maine?
Percentage of Population Employed in Firefighting & Prevention in Maine is 0.82%.
What is the Percentage of Population Employed in Firefighting & Prevention in the United States?
Percentage of Population Employed in Firefighting & Prevention in the United States is 1.2%.