Cities with the Highest Percentage of Population Employed in Firefighting & Prevention in Idaho
RELATED REPORTS & OPTIONS
Firefighting & Prevention
Idaho
Compare Cities
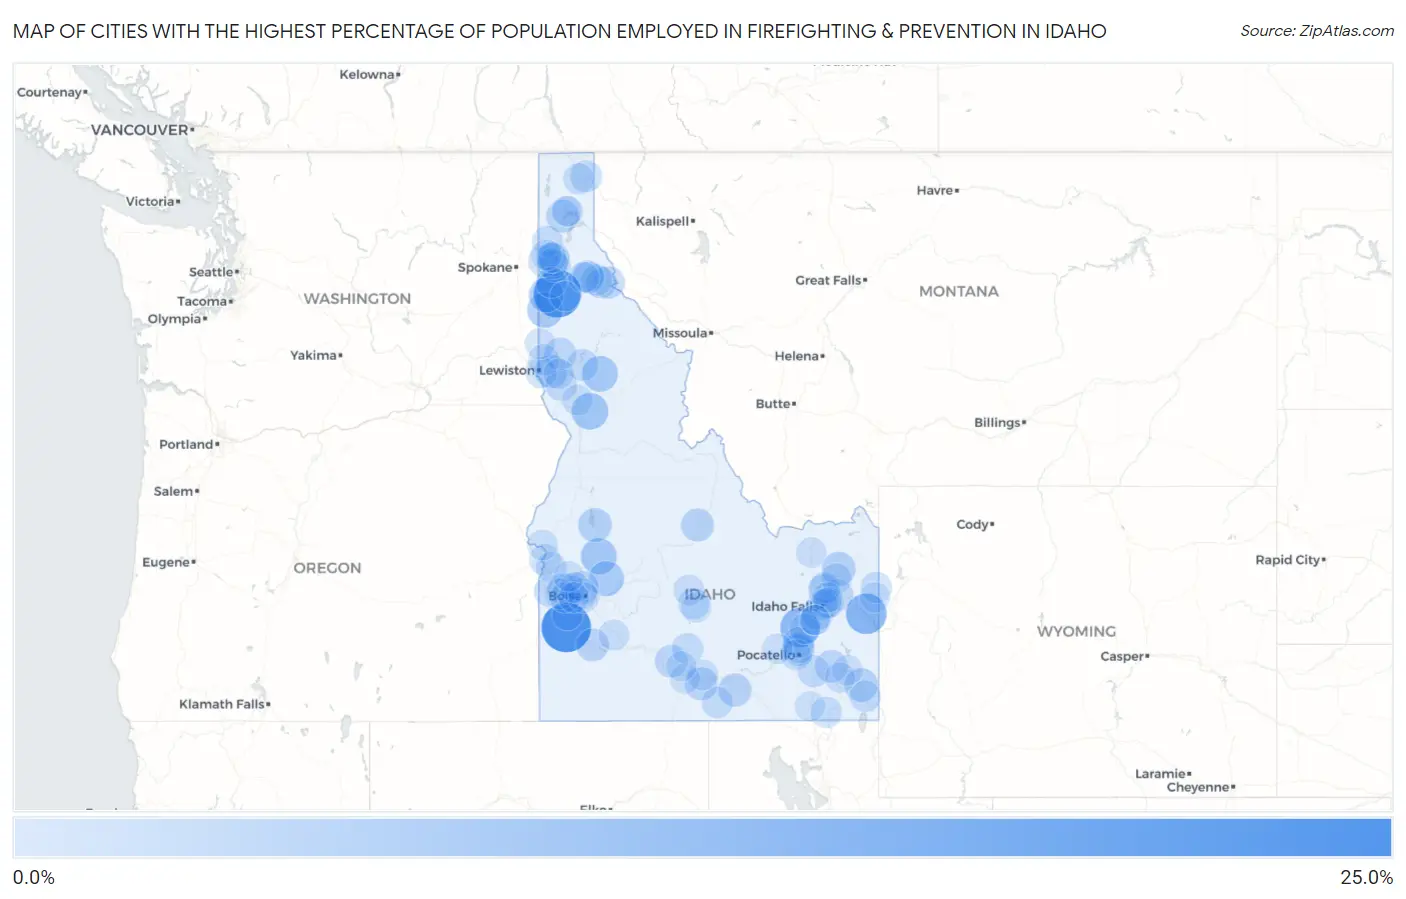
Map of Cities with the Highest Percentage of Population Employed in Firefighting & Prevention in Idaho
0.0%
25.0%
Cities with the Highest Percentage of Population Employed in Firefighting & Prevention in Idaho
| City | % Employed | vs State | vs National | |
| 1. | Murphy | 20.7% | 0.91%(+19.8)#1 | 1.2%(+19.5)#104 |
| 2. | Parkline | 18.5% | 0.91%(+17.6)#2 | 1.2%(+17.3)#133 |
| 3. | Irwin | 11.1% | 0.91%(+10.2)#3 | 1.2%(+9.93)#361 |
| 4. | Moreland | 9.9% | 0.91%(+9.01)#4 | 1.2%(+8.74)#422 |
| 5. | Grangeville | 6.9% | 0.91%(+6.02)#5 | 1.2%(+5.75)#770 |
| 6. | Crouch | 6.3% | 0.91%(+5.39)#6 | 1.2%(+5.12)#890 |
| 7. | Weippe | 6.1% | 0.91%(+5.23)#7 | 1.2%(+4.95)#913 |
| 8. | De Smet | 5.7% | 0.91%(+4.80)#8 | 1.2%(+4.53)#1,040 |
| 9. | Idaho City | 5.4% | 0.91%(+4.49)#9 | 1.2%(+4.22)#1,125 |
| 10. | Plummer | 5.0% | 0.91%(+4.09)#10 | 1.2%(+3.81)#1,269 |
| 11. | Parker | 4.1% | 0.91%(+3.21)#11 | 1.2%(+2.94)#1,711 |
| 12. | Cascade | 4.0% | 0.91%(+3.12)#12 | 1.2%(+2.85)#1,769 |
| 13. | Georgetown | 3.8% | 0.91%(+2.88)#13 | 1.2%(+2.60)#1,934 |
| 14. | Avimor | 3.5% | 0.91%(+2.60)#14 | 1.2%(+2.33)#2,184 |
| 15. | Albion | 3.4% | 0.91%(+2.49)#15 | 1.2%(+2.22)#2,309 |
| 16. | Lapwai | 3.3% | 0.91%(+2.35)#16 | 1.2%(+2.08)#2,460 |
| 17. | Challis | 3.3% | 0.91%(+2.35)#17 | 1.2%(+2.08)#2,462 |
| 18. | Murtaugh | 3.2% | 0.91%(+2.28)#18 | 1.2%(+2.01)#2,551 |
| 19. | Grand View | 3.0% | 0.91%(+2.13)#19 | 1.2%(+1.86)#2,704 |
| 20. | Hidden Springs | 3.0% | 0.91%(+2.05)#20 | 1.2%(+1.78)#2,838 |
| 21. | Dover | 2.9% | 0.91%(+2.03)#21 | 1.2%(+1.76)#2,865 |
| 22. | Wendell | 2.9% | 0.91%(+1.96)#22 | 1.2%(+1.68)#2,945 |
| 23. | Bancroft | 2.9% | 0.91%(+1.94)#23 | 1.2%(+1.67)#2,964 |
| 24. | Kendrick | 2.5% | 0.91%(+1.54)#24 | 1.2%(+1.27)#3,635 |
| 25. | Mullan | 2.4% | 0.91%(+1.50)#25 | 1.2%(+1.22)#3,732 |
| 26. | Mccammon | 2.2% | 0.91%(+1.25)#26 | 1.2%(+0.979)#4,279 |
| 27. | Shelley | 2.1% | 0.91%(+1.23)#27 | 1.2%(+0.960)#4,329 |
| 28. | Dalton Gardens | 2.1% | 0.91%(+1.23)#28 | 1.2%(+0.956)#4,346 |
| 29. | Smelterville | 2.1% | 0.91%(+1.16)#29 | 1.2%(+0.887)#4,521 |
| 30. | Ririe | 2.1% | 0.91%(+1.15)#30 | 1.2%(+0.883)#4,528 |
| 31. | Chubbuck | 2.0% | 0.91%(+1.13)#31 | 1.2%(+0.863)#4,587 |
| 32. | Winchester | 2.0% | 0.91%(+1.13)#32 | 1.2%(+0.855)#4,612 |
| 33. | Orofino | 2.0% | 0.91%(+1.12)#33 | 1.2%(+0.846)#4,632 |
| 34. | Moyie Springs | 2.0% | 0.91%(+1.07)#34 | 1.2%(+0.794)#4,808 |
| 35. | Fernan Lake Village | 1.9% | 0.91%(+0.937)#35 | 1.2%(+0.666)#5,218 |
| 36. | Greenleaf | 1.8% | 0.91%(+0.930)#36 | 1.2%(+0.658)#5,241 |
| 37. | Wallace | 1.8% | 0.91%(+0.891)#37 | 1.2%(+0.620)#5,371 |
| 38. | Payette | 1.8% | 0.91%(+0.868)#38 | 1.2%(+0.597)#5,456 |
| 39. | Osburn | 1.7% | 0.91%(+0.810)#39 | 1.2%(+0.538)#5,648 |
| 40. | Kellogg | 1.7% | 0.91%(+0.806)#40 | 1.2%(+0.534)#5,661 |
| 41. | Oakley | 1.7% | 0.91%(+0.786)#41 | 1.2%(+0.515)#5,737 |
| 42. | Shoshone | 1.7% | 0.91%(+0.756)#42 | 1.2%(+0.485)#5,859 |
| 43. | Lewisville | 1.6% | 0.91%(+0.698)#43 | 1.2%(+0.427)#6,073 |
| 44. | Montpelier | 1.6% | 0.91%(+0.690)#44 | 1.2%(+0.418)#6,097 |
| 45. | Post Falls | 1.6% | 0.91%(+0.688)#45 | 1.2%(+0.417)#6,107 |
| 46. | Tyhee | 1.6% | 0.91%(+0.659)#46 | 1.2%(+0.388)#6,227 |
| 47. | Garden City | 1.5% | 0.91%(+0.598)#47 | 1.2%(+0.326)#6,502 |
| 48. | Dayton | 1.4% | 0.91%(+0.462)#48 | 1.2%(+0.190)#7,100 |
| 49. | Hayden Lake | 1.4% | 0.91%(+0.460)#49 | 1.2%(+0.189)#7,109 |
| 50. | Driggs | 1.4% | 0.91%(+0.460)#50 | 1.2%(+0.189)#7,112 |
| 51. | Bonners Ferry | 1.4% | 0.91%(+0.453)#51 | 1.2%(+0.182)#7,148 |
| 52. | Lewiston | 1.3% | 0.91%(+0.416)#52 | 1.2%(+0.145)#7,382 |
| 53. | Menan | 1.3% | 0.91%(+0.414)#53 | 1.2%(+0.143)#7,396 |
| 54. | Fort Hall | 1.3% | 0.91%(+0.412)#54 | 1.2%(+0.141)#7,411 |
| 55. | Hailey | 1.3% | 0.91%(+0.408)#55 | 1.2%(+0.137)#7,434 |
| 56. | Genesee | 1.3% | 0.91%(+0.367)#56 | 1.2%(+0.096)#7,668 |
| 57. | Spirit Lake | 1.2% | 0.91%(+0.300)#57 | 1.2%(+0.029)#8,048 |
| 58. | Rexburg | 1.2% | 0.91%(+0.242)#58 | 1.2%(-0.029)#8,403 |
| 59. | Hazelton | 1.1% | 0.91%(+0.213)#59 | 1.2%(-0.058)#8,589 |
| 60. | Pocatello | 1.1% | 0.91%(+0.204)#60 | 1.2%(-0.067)#8,639 |
| 61. | Idaho Falls | 1.1% | 0.91%(+0.171)#61 | 1.2%(-0.101)#8,873 |
| 62. | Coeur D Alene | 1.1% | 0.91%(+0.168)#62 | 1.2%(-0.103)#8,892 |
| 63. | Cottonwood | 1.1% | 0.91%(+0.158)#63 | 1.2%(-0.113)#8,944 |
| 64. | New Plymouth | 1.0% | 0.91%(+0.133)#64 | 1.2%(-0.138)#9,109 |
| 65. | Harrison | 1.0% | 0.91%(+0.106)#65 | 1.2%(-0.165)#9,283 |
| 66. | Middleton | 1.0% | 0.91%(+0.098)#66 | 1.2%(-0.173)#9,324 |
| 67. | Ketchum | 1.0% | 0.91%(+0.085)#67 | 1.2%(-0.186)#9,393 |
| 68. | Iona | 1.00% | 0.91%(+0.084)#68 | 1.2%(-0.187)#9,403 |
| 69. | Star | 1.00% | 0.91%(+0.083)#69 | 1.2%(-0.188)#9,413 |
| 70. | Rathdrum | 0.96% | 0.91%(+0.048)#70 | 1.2%(-0.223)#9,668 |
| 71. | Mountain Home | 0.90% | 0.91%(-0.012)#71 | 1.2%(-0.283)#10,099 |
| 72. | Lincoln | 0.90% | 0.91%(-0.015)#72 | 1.2%(-0.287)#10,124 |
| 73. | Caldwell | 0.85% | 0.91%(-0.060)#73 | 1.2%(-0.332)#10,430 |
| 74. | Weiser | 0.85% | 0.91%(-0.063)#74 | 1.2%(-0.334)#10,450 |
| 75. | Pinehurst | 0.85% | 0.91%(-0.066)#75 | 1.2%(-0.337)#10,467 |
| 76. | Melba | 0.84% | 0.91%(-0.078)#76 | 1.2%(-0.349)#10,547 |
| 77. | Aberdeen | 0.83% | 0.91%(-0.087)#77 | 1.2%(-0.358)#10,614 |
| 78. | Boise City | 0.79% | 0.91%(-0.120)#78 | 1.2%(-0.391)#10,850 |
| 79. | Moscow | 0.74% | 0.91%(-0.174)#79 | 1.2%(-0.445)#11,237 |
| 80. | Blackfoot | 0.72% | 0.91%(-0.195)#80 | 1.2%(-0.466)#11,385 |
| 81. | Dubois | 0.70% | 0.91%(-0.218)#81 | 1.2%(-0.489)#11,564 |
| 82. | Ponderay | 0.69% | 0.91%(-0.226)#82 | 1.2%(-0.497)#11,626 |
| 83. | Nampa | 0.69% | 0.91%(-0.227)#83 | 1.2%(-0.498)#11,632 |
| 84. | Eagle | 0.69% | 0.91%(-0.227)#84 | 1.2%(-0.498)#11,636 |
| 85. | Meridian | 0.69% | 0.91%(-0.229)#85 | 1.2%(-0.500)#11,645 |
| 86. | Culdesac | 0.66% | 0.91%(-0.252)#86 | 1.2%(-0.524)#11,846 |
| 87. | Soda Springs | 0.61% | 0.91%(-0.305)#87 | 1.2%(-0.576)#12,238 |
| 88. | Grace | 0.58% | 0.91%(-0.332)#88 | 1.2%(-0.604)#12,427 |
| 89. | Emmett | 0.54% | 0.91%(-0.377)#89 | 1.2%(-0.648)#12,754 |
| 90. | Kootenai | 0.51% | 0.91%(-0.405)#90 | 1.2%(-0.676)#12,953 |
| 91. | Hayden | 0.51% | 0.91%(-0.409)#91 | 1.2%(-0.680)#12,980 |
| 92. | Twin Falls | 0.50% | 0.91%(-0.413)#92 | 1.2%(-0.684)#13,013 |
| 93. | Firth | 0.50% | 0.91%(-0.417)#93 | 1.2%(-0.688)#13,044 |
| 94. | Bellevue | 0.49% | 0.91%(-0.427)#94 | 1.2%(-0.698)#13,099 |
| 95. | Basalt | 0.47% | 0.91%(-0.445)#95 | 1.2%(-0.716)#13,238 |
| 96. | St Maries | 0.41% | 0.91%(-0.506)#96 | 1.2%(-0.777)#13,635 |
| 97. | Malad City | 0.41% | 0.91%(-0.509)#97 | 1.2%(-0.780)#13,655 |
| 98. | Victor | 0.40% | 0.91%(-0.514)#98 | 1.2%(-0.785)#13,687 |
| 99. | Jerome | 0.40% | 0.91%(-0.517)#99 | 1.2%(-0.788)#13,709 |
| 100. | Ucon | 0.36% | 0.91%(-0.550)#100 | 1.2%(-0.821)#13,933 |
Common Questions
What are the Top 10 Cities with the Highest Percentage of Population Employed in Firefighting & Prevention in Idaho?
Top 10 Cities with the Highest Percentage of Population Employed in Firefighting & Prevention in Idaho are:
#1
20.7%
#2
18.5%
#3
11.1%
#4
9.9%
#5
6.9%
#6
6.3%
#7
6.1%
#8
5.7%
#9
5.4%
#10
5.0%
What city has the Highest Percentage of Population Employed in Firefighting & Prevention in Idaho?
Murphy has the Highest Percentage of Population Employed in Firefighting & Prevention in Idaho with 20.7%.
What is the Percentage of Population Employed in Firefighting & Prevention in the State of Idaho?
Percentage of Population Employed in Firefighting & Prevention in Idaho is 0.91%.
What is the Percentage of Population Employed in Firefighting & Prevention in the United States?
Percentage of Population Employed in Firefighting & Prevention in the United States is 1.2%.