Cities with the Highest Percentage of Population Employed in Firefighting & Prevention in Alabama
RELATED REPORTS & OPTIONS
Firefighting & Prevention
Alabama
Compare Cities
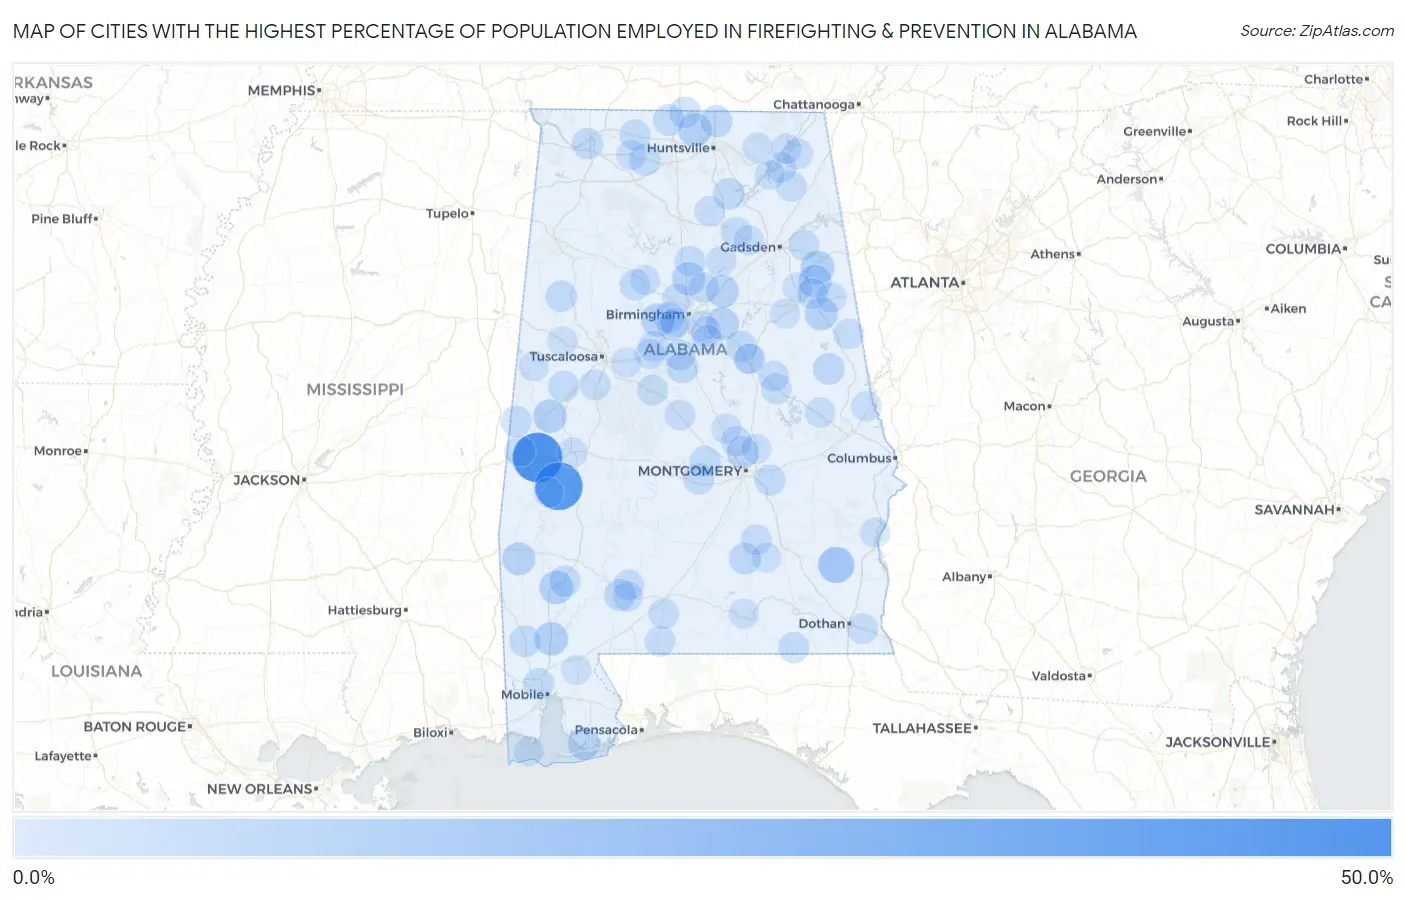
Map of Cities with the Highest Percentage of Population Employed in Firefighting & Prevention in Alabama
0.0%
50.0%
Cities with the Highest Percentage of Population Employed in Firefighting & Prevention in Alabama
| City | % Employed | vs State | vs National | |
| 1. | Bellamy | 40.7% | 1.2%(+39.5)#1 | 1.2%(+39.6)#32 |
| 2. | Myrtlewood | 37.1% | 1.2%(+35.9)#2 | 1.2%(+35.9)#37 |
| 3. | Blue Springs | 13.6% | 1.2%(+12.4)#3 | 1.2%(+12.5)#250 |
| 4. | Leroy | 8.8% | 1.2%(+7.58)#4 | 1.2%(+7.62)#525 |
| 5. | Mount Vernon | 8.8% | 1.2%(+7.53)#5 | 1.2%(+7.57)#528 |
| 6. | Nances Creek | 8.6% | 1.2%(+7.39)#6 | 1.2%(+7.43)#539 |
| 7. | Boligee | 8.5% | 1.2%(+7.28)#7 | 1.2%(+7.32)#557 |
| 8. | Harvest | 8.5% | 1.2%(+7.24)#8 | 1.2%(+7.29)#559 |
| 9. | Rock Creek | 7.9% | 1.2%(+6.71)#9 | 1.2%(+6.76)#626 |
| 10. | Kimberly | 7.8% | 1.2%(+6.58)#10 | 1.2%(+6.63)#646 |
| 11. | White Plains | 7.7% | 1.2%(+6.52)#11 | 1.2%(+6.56)#652 |
| 12. | Cullomburg | 7.5% | 1.2%(+6.31)#12 | 1.2%(+6.36)#674 |
| 13. | Hollis Crossroads | 7.5% | 1.2%(+6.30)#13 | 1.2%(+6.35)#676 |
| 14. | Vandiver | 7.0% | 1.2%(+5.78)#14 | 1.2%(+5.83)#753 |
| 15. | Argo | 6.9% | 1.2%(+5.65)#15 | 1.2%(+5.70)#781 |
| 16. | Bon Secour | 6.3% | 1.2%(+5.07)#16 | 1.2%(+5.12)#893 |
| 17. | Coosada | 6.1% | 1.2%(+4.85)#17 | 1.2%(+4.90)#931 |
| 18. | Hazel Green | 5.4% | 1.2%(+4.19)#18 | 1.2%(+4.24)#1,121 |
| 19. | Wadley | 5.3% | 1.2%(+4.07)#19 | 1.2%(+4.12)#1,168 |
| 20. | Frisco City | 5.3% | 1.2%(+4.03)#20 | 1.2%(+4.08)#1,178 |
| 21. | Montevallo | 5.1% | 1.2%(+3.88)#21 | 1.2%(+3.93)#1,229 |
| 22. | Rutledge | 5.0% | 1.2%(+3.72)#22 | 1.2%(+3.76)#1,292 |
| 23. | Hillsboro | 4.8% | 1.2%(+3.59)#23 | 1.2%(+3.63)#1,350 |
| 24. | Citronelle | 4.8% | 1.2%(+3.53)#24 | 1.2%(+3.58)#1,365 |
| 25. | Belk | 4.7% | 1.2%(+3.48)#25 | 1.2%(+3.53)#1,396 |
| 26. | Ardmore | 4.5% | 1.2%(+3.30)#26 | 1.2%(+3.34)#1,485 |
| 27. | Sheffield | 4.4% | 1.2%(+3.18)#27 | 1.2%(+3.23)#1,543 |
| 28. | White Hall | 4.4% | 1.2%(+3.18)#28 | 1.2%(+3.23)#1,547 |
| 29. | Childersburg | 4.4% | 1.2%(+3.14)#29 | 1.2%(+3.18)#1,576 |
| 30. | Union Grove | 4.3% | 1.2%(+3.11)#30 | 1.2%(+3.16)#1,597 |
| 31. | Brantleyville | 4.3% | 1.2%(+3.10)#31 | 1.2%(+3.15)#1,602 |
| 32. | Jackson | 4.3% | 1.2%(+3.08)#32 | 1.2%(+3.13)#1,610 |
| 33. | Elkmont | 4.2% | 1.2%(+2.98)#33 | 1.2%(+3.03)#1,662 |
| 34. | Lake View | 4.0% | 1.2%(+2.78)#34 | 1.2%(+2.83)#1,786 |
| 35. | Autaugaville | 4.0% | 1.2%(+2.76)#35 | 1.2%(+2.80)#1,807 |
| 36. | Snead | 4.0% | 1.2%(+2.72)#36 | 1.2%(+2.77)#1,819 |
| 37. | Rogersville | 3.9% | 1.2%(+2.68)#37 | 1.2%(+2.73)#1,841 |
| 38. | Parrish | 3.9% | 1.2%(+2.65)#38 | 1.2%(+2.70)#1,864 |
| 39. | Union | 3.8% | 1.2%(+2.61)#39 | 1.2%(+2.66)#1,889 |
| 40. | Hayden | 3.8% | 1.2%(+2.59)#40 | 1.2%(+2.64)#1,911 |
| 41. | Geneva | 3.7% | 1.2%(+2.51)#41 | 1.2%(+2.56)#1,969 |
| 42. | Pike Road | 3.7% | 1.2%(+2.50)#42 | 1.2%(+2.55)#1,981 |
| 43. | Prichard | 3.7% | 1.2%(+2.49)#43 | 1.2%(+2.54)#1,990 |
| 44. | Emelle | 3.7% | 1.2%(+2.47)#44 | 1.2%(+2.52)#2,019 |
| 45. | Pleasant Grove | 3.6% | 1.2%(+2.34)#45 | 1.2%(+2.38)#2,150 |
| 46. | East Brewton | 3.5% | 1.2%(+2.30)#46 | 1.2%(+2.34)#2,175 |
| 47. | Mignon | 3.5% | 1.2%(+2.28)#47 | 1.2%(+2.32)#2,193 |
| 48. | Avon | 3.5% | 1.2%(+2.25)#48 | 1.2%(+2.30)#2,219 |
| 49. | York | 3.5% | 1.2%(+2.23)#49 | 1.2%(+2.28)#2,241 |
| 50. | Ballplay | 3.5% | 1.2%(+2.22)#50 | 1.2%(+2.27)#2,249 |
| 51. | Moundville | 3.4% | 1.2%(+2.19)#51 | 1.2%(+2.24)#2,278 |
| 52. | Brookside | 3.4% | 1.2%(+2.14)#52 | 1.2%(+2.19)#2,344 |
| 53. | Kellyton | 3.4% | 1.2%(+2.14)#53 | 1.2%(+2.18)#2,348 |
| 54. | Choccolocco | 3.3% | 1.2%(+2.07)#54 | 1.2%(+2.12)#2,406 |
| 55. | Centreville | 3.2% | 1.2%(+2.01)#55 | 1.2%(+2.06)#2,486 |
| 56. | Monroeville | 3.2% | 1.2%(+1.99)#56 | 1.2%(+2.04)#2,504 |
| 57. | Petrey | 3.2% | 1.2%(+1.99)#57 | 1.2%(+2.04)#2,515 |
| 58. | Fyffe | 3.1% | 1.2%(+1.88)#58 | 1.2%(+1.93)#2,614 |
| 59. | Brighton | 3.1% | 1.2%(+1.85)#59 | 1.2%(+1.90)#2,653 |
| 60. | Castleberry | 3.1% | 1.2%(+1.84)#60 | 1.2%(+1.89)#2,663 |
| 61. | Pisgah | 3.1% | 1.2%(+1.83)#61 | 1.2%(+1.88)#2,685 |
| 62. | Deatsville | 3.0% | 1.2%(+1.78)#62 | 1.2%(+1.83)#2,739 |
| 63. | Pinson | 3.0% | 1.2%(+1.78)#63 | 1.2%(+1.83)#2,740 |
| 64. | Goodwater | 3.0% | 1.2%(+1.76)#64 | 1.2%(+1.80)#2,792 |
| 65. | Section | 3.0% | 1.2%(+1.72)#65 | 1.2%(+1.77)#2,850 |
| 66. | Maplesville | 2.9% | 1.2%(+1.69)#66 | 1.2%(+1.74)#2,887 |
| 67. | Woodland | 2.9% | 1.2%(+1.68)#67 | 1.2%(+1.73)#2,897 |
| 68. | Camp Hill | 2.9% | 1.2%(+1.67)#68 | 1.2%(+1.72)#2,905 |
| 69. | Excel | 2.9% | 1.2%(+1.64)#69 | 1.2%(+1.69)#2,939 |
| 70. | Baileyton | 2.8% | 1.2%(+1.60)#70 | 1.2%(+1.65)#2,996 |
| 71. | Woodstock | 2.8% | 1.2%(+1.57)#71 | 1.2%(+1.62)#3,030 |
| 72. | Hollywood | 2.8% | 1.2%(+1.56)#72 | 1.2%(+1.60)#3,056 |
| 73. | Brook Highland | 2.8% | 1.2%(+1.52)#73 | 1.2%(+1.57)#3,117 |
| 74. | Highland Lakes | 2.7% | 1.2%(+1.50)#74 | 1.2%(+1.55)#3,150 |
| 75. | North Courtland | 2.7% | 1.2%(+1.48)#75 | 1.2%(+1.53)#3,168 |
| 76. | Chelsea | 2.6% | 1.2%(+1.36)#76 | 1.2%(+1.41)#3,368 |
| 77. | Allgood | 2.5% | 1.2%(+1.32)#77 | 1.2%(+1.36)#3,449 |
| 78. | Heflin | 2.4% | 1.2%(+1.18)#78 | 1.2%(+1.23)#3,720 |
| 79. | Walnut Grove | 2.4% | 1.2%(+1.14)#79 | 1.2%(+1.19)#3,810 |
| 80. | Midfield | 2.3% | 1.2%(+1.10)#80 | 1.2%(+1.14)#3,896 |
| 81. | Huguley | 2.3% | 1.2%(+1.04)#81 | 1.2%(+1.09)#4,026 |
| 82. | Demopolis | 2.2% | 1.2%(+0.988)#82 | 1.2%(+1.04)#4,158 |
| 83. | Babbie | 2.2% | 1.2%(+0.965)#83 | 1.2%(+1.01)#4,199 |
| 84. | Goshen | 2.2% | 1.2%(+0.965)#84 | 1.2%(+1.01)#4,200 |
| 85. | Munford | 2.2% | 1.2%(+0.932)#85 | 1.2%(+0.980)#4,274 |
| 86. | Pennington | 2.2% | 1.2%(+0.929)#86 | 1.2%(+0.976)#4,286 |
| 87. | Langston | 2.2% | 1.2%(+0.917)#87 | 1.2%(+0.965)#4,319 |
| 88. | Wetumpka | 2.1% | 1.2%(+0.916)#88 | 1.2%(+0.963)#4,323 |
| 89. | Coaling | 2.1% | 1.2%(+0.908)#89 | 1.2%(+0.956)#4,347 |
| 90. | Aliceville | 2.1% | 1.2%(+0.908)#90 | 1.2%(+0.955)#4,349 |
| 91. | Gordo | 2.1% | 1.2%(+0.901)#91 | 1.2%(+0.949)#4,361 |
| 92. | Dauphin Island | 2.1% | 1.2%(+0.901)#92 | 1.2%(+0.948)#4,362 |
| 93. | Bay Minette | 2.1% | 1.2%(+0.870)#93 | 1.2%(+0.917)#4,442 |
| 94. | Pleasant Groves | 2.1% | 1.2%(+0.842)#94 | 1.2%(+0.889)#4,519 |
| 95. | Sylacauga | 2.1% | 1.2%(+0.822)#95 | 1.2%(+0.869)#4,567 |
| 96. | Eufaula | 2.0% | 1.2%(+0.783)#96 | 1.2%(+0.830)#4,680 |
| 97. | Cordova | 2.0% | 1.2%(+0.780)#97 | 1.2%(+0.828)#4,687 |
| 98. | Mount Olive Cdp Jefferson County | 2.0% | 1.2%(+0.772)#98 | 1.2%(+0.819)#4,716 |
| 99. | Marbury | 2.0% | 1.2%(+0.717)#99 | 1.2%(+0.764)#4,893 |
| 100. | Saks | 1.9% | 1.2%(+0.680)#100 | 1.2%(+0.727)#5,013 |
Common Questions
What are the Top 10 Cities with the Highest Percentage of Population Employed in Firefighting & Prevention in Alabama?
Top 10 Cities with the Highest Percentage of Population Employed in Firefighting & Prevention in Alabama are:
#1
40.7%
#2
37.1%
#3
13.6%
#4
8.8%
#5
8.8%
#6
8.6%
#7
8.5%
#8
8.5%
#9
7.9%
#10
7.8%
What city has the Highest Percentage of Population Employed in Firefighting & Prevention in Alabama?
Bellamy has the Highest Percentage of Population Employed in Firefighting & Prevention in Alabama with 40.7%.
What is the Percentage of Population Employed in Firefighting & Prevention in the State of Alabama?
Percentage of Population Employed in Firefighting & Prevention in Alabama is 1.2%.
What is the Percentage of Population Employed in Firefighting & Prevention in the United States?
Percentage of Population Employed in Firefighting & Prevention in the United States is 1.2%.