Cities with the Highest Percentage of Population Employed in Firefighting & Prevention in Maryland
RELATED REPORTS & OPTIONS
Firefighting & Prevention
Maryland
Compare Cities
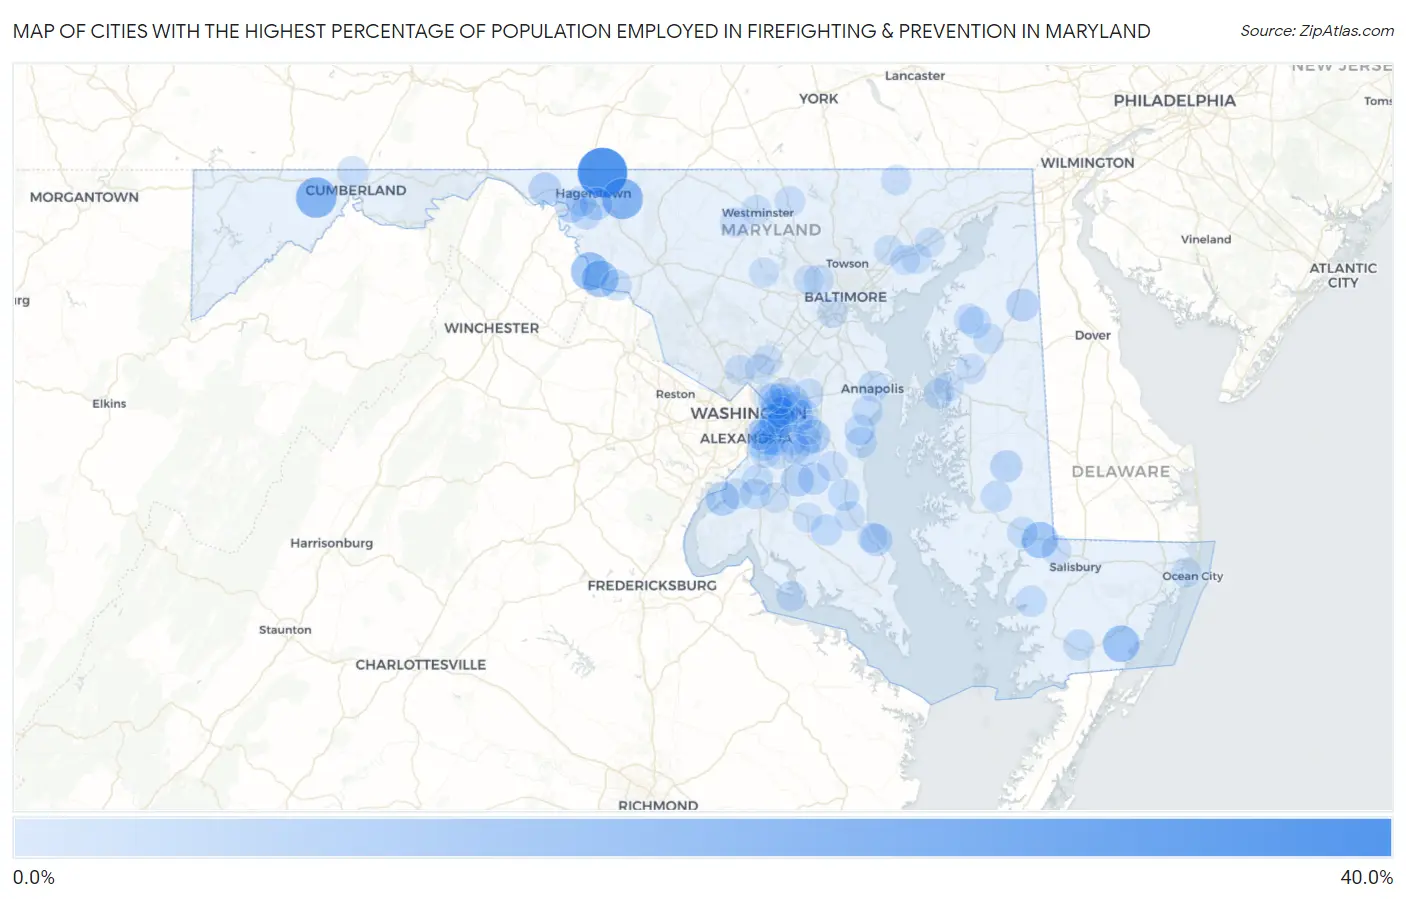
Map of Cities with the Highest Percentage of Population Employed in Firefighting & Prevention in Maryland
0.0%
40.0%
Cities with the Highest Percentage of Population Employed in Firefighting & Prevention in Maryland
| City | % Employed | vs State | vs National | |
| 1. | Reid | 36.1% | 1.6%(+34.5)#1 | 1.2%(+34.9)#39 |
| 2. | Pondsville | 20.6% | 1.6%(+19.0)#2 | 1.2%(+19.4)#106 |
| 3. | Shaft | 20.1% | 1.6%(+18.5)#3 | 1.2%(+18.9)#111 |
| 4. | Dargan | 15.6% | 1.6%(+14.0)#4 | 1.2%(+14.4)#188 |
| 5. | Garretts Mill | 13.8% | 1.6%(+12.2)#5 | 1.2%(+12.6)#242 |
| 6. | Girdletree | 13.4% | 1.6%(+11.8)#6 | 1.2%(+12.2)#258 |
| 7. | Mardela Springs | 12.8% | 1.6%(+11.2)#7 | 1.2%(+11.6)#280 |
| 8. | Temple Hills | 9.8% | 1.6%(+8.22)#8 | 1.2%(+8.62)#435 |
| 9. | Largo | 9.0% | 1.6%(+7.40)#9 | 1.2%(+7.81)#509 |
| 10. | Indian Head | 8.5% | 1.6%(+6.95)#10 | 1.2%(+7.36)#552 |
| 11. | Upper Marlboro | 7.6% | 1.6%(+6.04)#11 | 1.2%(+6.44)#666 |
| 12. | Cedarville | 7.5% | 1.6%(+5.90)#12 | 1.2%(+6.30)#679 |
| 13. | Millington | 6.9% | 1.6%(+5.31)#13 | 1.2%(+5.71)#775 |
| 14. | Clear Spring | 6.8% | 1.6%(+5.20)#14 | 1.2%(+5.60)#795 |
| 15. | Williamsport | 6.8% | 1.6%(+5.19)#15 | 1.2%(+5.59)#796 |
| 16. | Funkstown | 6.7% | 1.6%(+5.15)#16 | 1.2%(+5.56)#801 |
| 17. | Long Beach | 6.2% | 1.6%(+4.61)#17 | 1.2%(+5.01)#907 |
| 18. | Preston | 6.0% | 1.6%(+4.45)#18 | 1.2%(+4.85)#949 |
| 19. | Baden | 5.9% | 1.6%(+4.31)#19 | 1.2%(+4.72)#985 |
| 20. | Fairmount Heights | 5.6% | 1.6%(+4.03)#20 | 1.2%(+4.43)#1,063 |
| 21. | Suitland | 5.6% | 1.6%(+3.97)#21 | 1.2%(+4.38)#1,079 |
| 22. | Springdale | 5.5% | 1.6%(+3.89)#22 | 1.2%(+4.30)#1,107 |
| 23. | Wildewood | 5.3% | 1.6%(+3.71)#23 | 1.2%(+4.11)#1,171 |
| 24. | Silver Hill | 5.0% | 1.6%(+3.40)#24 | 1.2%(+3.80)#1,278 |
| 25. | Golden Beach | 4.9% | 1.6%(+3.35)#25 | 1.2%(+3.75)#1,295 |
| 26. | Walker Mill | 4.9% | 1.6%(+3.32)#26 | 1.2%(+3.73)#1,307 |
| 27. | St James | 4.9% | 1.6%(+3.31)#27 | 1.2%(+3.71)#1,310 |
| 28. | Cedar Heights | 4.9% | 1.6%(+3.29)#28 | 1.2%(+3.69)#1,314 |
| 29. | Kingstown | 4.8% | 1.6%(+3.24)#29 | 1.2%(+3.65)#1,343 |
| 30. | Romancoke | 4.8% | 1.6%(+3.21)#30 | 1.2%(+3.62)#1,356 |
| 31. | Queensland | 4.6% | 1.6%(+2.97)#31 | 1.2%(+3.38)#1,463 |
| 32. | Bladensburg | 4.5% | 1.6%(+2.92)#32 | 1.2%(+3.33)#1,494 |
| 33. | Huntingtown | 4.5% | 1.6%(+2.90)#33 | 1.2%(+3.31)#1,507 |
| 34. | Oxon Hill | 4.4% | 1.6%(+2.83)#34 | 1.2%(+3.23)#1,540 |
| 35. | Mount Vernon | 4.3% | 1.6%(+2.72)#35 | 1.2%(+3.13)#1,612 |
| 36. | Naval Academy | 4.3% | 1.6%(+2.72)#36 | 1.2%(+3.12)#1,620 |
| 37. | Accokeek | 4.3% | 1.6%(+2.66)#37 | 1.2%(+3.07)#1,643 |
| 38. | Secretary | 4.2% | 1.6%(+2.66)#38 | 1.2%(+3.06)#1,646 |
| 39. | Summerfield | 4.2% | 1.6%(+2.64)#39 | 1.2%(+3.05)#1,653 |
| 40. | Deale | 4.2% | 1.6%(+2.64)#40 | 1.2%(+3.05)#1,657 |
| 41. | Hillcrest Heights | 4.2% | 1.6%(+2.58)#41 | 1.2%(+2.98)#1,692 |
| 42. | West Pocomoke | 4.1% | 1.6%(+2.53)#42 | 1.2%(+2.93)#1,716 |
| 43. | Camp Springs | 4.0% | 1.6%(+2.44)#43 | 1.2%(+2.85)#1,770 |
| 44. | Rosemont | 4.0% | 1.6%(+2.44)#44 | 1.2%(+2.85)#1,772 |
| 45. | Friendly | 4.0% | 1.6%(+2.39)#45 | 1.2%(+2.79)#1,812 |
| 46. | Galesville | 4.0% | 1.6%(+2.37)#46 | 1.2%(+2.77)#1,820 |
| 47. | Vienna | 3.9% | 1.6%(+2.35)#47 | 1.2%(+2.76)#1,826 |
| 48. | Landover | 3.9% | 1.6%(+2.31)#48 | 1.2%(+2.71)#1,854 |
| 49. | Kettering | 3.8% | 1.6%(+2.23)#49 | 1.2%(+2.64)#1,909 |
| 50. | Lake Arbor | 3.8% | 1.6%(+2.18)#50 | 1.2%(+2.58)#1,952 |
| 51. | Peppermill Village | 3.7% | 1.6%(+2.13)#51 | 1.2%(+2.53)#1,993 |
| 52. | Seat Pleasant | 3.7% | 1.6%(+2.13)#52 | 1.2%(+2.53)#1,996 |
| 53. | Cheverly | 3.7% | 1.6%(+2.12)#53 | 1.2%(+2.52)#2,003 |
| 54. | Church Hill | 3.7% | 1.6%(+2.11)#54 | 1.2%(+2.51)#2,025 |
| 55. | Halfway | 3.7% | 1.6%(+2.09)#55 | 1.2%(+2.49)#2,042 |
| 56. | Bryans Road | 3.7% | 1.6%(+2.06)#56 | 1.2%(+2.47)#2,064 |
| 57. | Coral Hills | 3.6% | 1.6%(+2.05)#57 | 1.2%(+2.45)#2,080 |
| 58. | Lansdowne | 3.6% | 1.6%(+2.02)#58 | 1.2%(+2.43)#2,113 |
| 59. | Grasonville | 3.6% | 1.6%(+2.00)#59 | 1.2%(+2.40)#2,126 |
| 60. | District Heights | 3.5% | 1.6%(+1.94)#60 | 1.2%(+2.34)#2,180 |
| 61. | Mayo | 3.5% | 1.6%(+1.92)#61 | 1.2%(+2.32)#2,188 |
| 62. | Cobb Island | 3.5% | 1.6%(+1.92)#62 | 1.2%(+2.32)#2,196 |
| 63. | Bensville | 3.5% | 1.6%(+1.88)#63 | 1.2%(+2.28)#2,237 |
| 64. | Brown Station | 3.4% | 1.6%(+1.86)#64 | 1.2%(+2.26)#2,263 |
| 65. | Ellerslie | 3.4% | 1.6%(+1.82)#65 | 1.2%(+2.22)#2,299 |
| 66. | Melwood | 3.3% | 1.6%(+1.69)#66 | 1.2%(+2.09)#2,435 |
| 67. | Fairwood | 3.2% | 1.6%(+1.62)#67 | 1.2%(+2.03)#2,531 |
| 68. | Green Valley | 3.2% | 1.6%(+1.57)#68 | 1.2%(+1.98)#2,573 |
| 69. | Landover Hills | 3.1% | 1.6%(+1.49)#69 | 1.2%(+1.90)#2,656 |
| 70. | New Windsor | 3.1% | 1.6%(+1.48)#70 | 1.2%(+1.89)#2,670 |
| 71. | Dunkirk | 3.1% | 1.6%(+1.46)#71 | 1.2%(+1.87)#2,697 |
| 72. | Edgewood | 3.0% | 1.6%(+1.44)#72 | 1.2%(+1.84)#2,734 |
| 73. | Hampstead | 3.0% | 1.6%(+1.42)#73 | 1.2%(+1.83)#2,745 |
| 74. | Hebron | 2.9% | 1.6%(+1.34)#74 | 1.2%(+1.75)#2,882 |
| 75. | St Leonard | 2.9% | 1.6%(+1.34)#75 | 1.2%(+1.74)#2,886 |
| 76. | Centreville | 2.9% | 1.6%(+1.33)#76 | 1.2%(+1.73)#2,899 |
| 77. | Chestertown | 2.9% | 1.6%(+1.31)#77 | 1.2%(+1.71)#2,911 |
| 78. | Pylesville | 2.9% | 1.6%(+1.28)#78 | 1.2%(+1.68)#2,947 |
| 79. | Marlton | 2.9% | 1.6%(+1.27)#79 | 1.2%(+1.68)#2,951 |
| 80. | New Carrollton | 2.9% | 1.6%(+1.27)#80 | 1.2%(+1.67)#2,972 |
| 81. | Rosaryville | 2.8% | 1.6%(+1.24)#81 | 1.2%(+1.65)#2,998 |
| 82. | North Kensington | 2.8% | 1.6%(+1.21)#82 | 1.2%(+1.61)#3,036 |
| 83. | Lochearn | 2.7% | 1.6%(+1.15)#83 | 1.2%(+1.55)#3,140 |
| 84. | Glassmanor | 2.7% | 1.6%(+1.15)#84 | 1.2%(+1.55)#3,141 |
| 85. | Westminster | 2.7% | 1.6%(+1.12)#85 | 1.2%(+1.53)#3,175 |
| 86. | White Oak | 2.6% | 1.6%(+1.02)#86 | 1.2%(+1.42)#3,335 |
| 87. | Kingsville | 2.6% | 1.6%(+1.02)#87 | 1.2%(+1.42)#3,336 |
| 88. | West Ocean City | 2.6% | 1.6%(+1.02)#88 | 1.2%(+1.42)#3,343 |
| 89. | Milford Mill | 2.6% | 1.6%(+1.01)#89 | 1.2%(+1.41)#3,360 |
| 90. | Queenstown | 2.6% | 1.6%(+0.987)#90 | 1.2%(+1.39)#3,395 |
| 91. | Joppatowne | 2.6% | 1.6%(+0.985)#91 | 1.2%(+1.39)#3,402 |
| 92. | Brentwood | 2.6% | 1.6%(+0.968)#92 | 1.2%(+1.37)#3,432 |
| 93. | Fairland | 2.5% | 1.6%(+0.954)#93 | 1.2%(+1.36)#3,460 |
| 94. | Clinton | 2.5% | 1.6%(+0.942)#94 | 1.2%(+1.35)#3,489 |
| 95. | Marlboro Village | 2.5% | 1.6%(+0.911)#95 | 1.2%(+1.32)#3,557 |
| 96. | Hughesville | 2.5% | 1.6%(+0.906)#96 | 1.2%(+1.31)#3,575 |
| 97. | Waldorf | 2.5% | 1.6%(+0.893)#97 | 1.2%(+1.30)#3,595 |
| 98. | Riverside | 2.5% | 1.6%(+0.881)#98 | 1.2%(+1.28)#3,617 |
| 99. | Prince Frederick | 2.4% | 1.6%(+0.849)#99 | 1.2%(+1.25)#3,667 |
| 100. | Sykesville | 2.4% | 1.6%(+0.835)#100 | 1.2%(+1.24)#3,697 |
Common Questions
What are the Top 10 Cities with the Highest Percentage of Population Employed in Firefighting & Prevention in Maryland?
Top 10 Cities with the Highest Percentage of Population Employed in Firefighting & Prevention in Maryland are:
#1
36.1%
#2
20.6%
#3
20.1%
#4
15.6%
#5
13.8%
#6
13.4%
#7
12.8%
#8
9.8%
#9
9.0%
#10
8.5%
What city has the Highest Percentage of Population Employed in Firefighting & Prevention in Maryland?
Reid has the Highest Percentage of Population Employed in Firefighting & Prevention in Maryland with 36.1%.
What is the Percentage of Population Employed in Firefighting & Prevention in the State of Maryland?
Percentage of Population Employed in Firefighting & Prevention in Maryland is 1.6%.
What is the Percentage of Population Employed in Firefighting & Prevention in the United States?
Percentage of Population Employed in Firefighting & Prevention in the United States is 1.2%.