Cities with the Highest Percentage of Population Employed in Firefighting & Prevention in Georgia
RELATED REPORTS & OPTIONS
Firefighting & Prevention
Georgia
Compare Cities
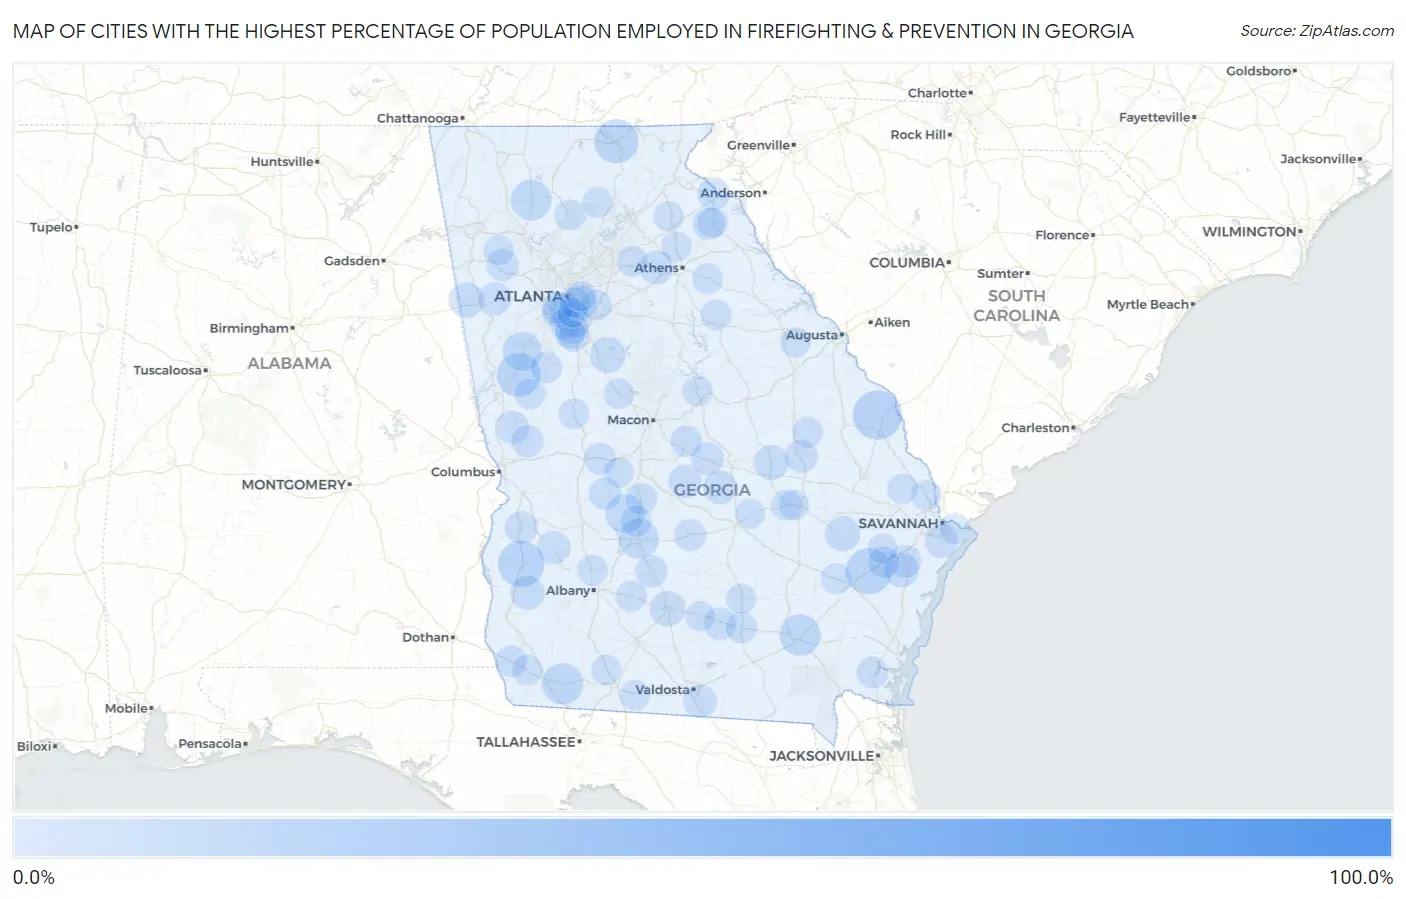
Map of Cities with the Highest Percentage of Population Employed in Firefighting & Prevention in Georgia
0.0%
100.0%
Cities with the Highest Percentage of Population Employed in Firefighting & Prevention in Georgia
| City | % Employed | vs State | vs National | |
| 1. | Millwood | 100.0% | 1.2%(+98.8)#1 | 1.2%(+98.8)#3 |
| 2. | Juliette | 25.0% | 1.2%(+23.8)#2 | 1.2%(+23.8)#75 |
| 3. | Box Springs | 20.0% | 1.2%(+18.8)#3 | 1.2%(+18.8)#115 |
| 4. | Hiltonia | 15.1% | 1.2%(+13.9)#4 | 1.2%(+13.9)#202 |
| 5. | Cuthbert | 13.1% | 1.2%(+11.9)#5 | 1.2%(+11.9)#270 |
| 6. | Ludowici | 13.0% | 1.2%(+11.8)#6 | 1.2%(+11.8)#275 |
| 7. | Blairsville | 11.7% | 1.2%(+10.5)#7 | 1.2%(+10.5)#328 |
| 8. | Lone Oak | 11.4% | 1.2%(+10.2)#8 | 1.2%(+10.2)#344 |
| 9. | Sunnyside | 9.8% | 1.2%(+8.63)#9 | 1.2%(+8.64)#431 |
| 10. | Climax | 9.7% | 1.2%(+8.48)#10 | 1.2%(+8.49)#446 |
| 11. | Fairmount | 9.5% | 1.2%(+8.26)#11 | 1.2%(+8.27)#458 |
| 12. | Faceville | 9.2% | 1.2%(+8.04)#12 | 1.2%(+8.04)#478 |
| 13. | Cordele | 8.9% | 1.2%(+7.69)#13 | 1.2%(+7.70)#519 |
| 14. | East Newnan | 8.4% | 1.2%(+7.19)#14 | 1.2%(+7.20)#566 |
| 15. | Lilly | 8.1% | 1.2%(+6.91)#15 | 1.2%(+6.92)#606 |
| 16. | Smarr | 6.5% | 1.2%(+5.31)#16 | 1.2%(+5.32)#849 |
| 17. | Jenkinsburg | 6.2% | 1.2%(+4.97)#17 | 1.2%(+4.98)#910 |
| 18. | Unionville | 5.9% | 1.2%(+4.72)#18 | 1.2%(+4.73)#978 |
| 19. | Tallapoosa | 5.8% | 1.2%(+4.65)#19 | 1.2%(+4.66)#1,006 |
| 20. | Mendes | 5.7% | 1.2%(+4.52)#20 | 1.2%(+4.53)#1,036 |
| 21. | Adrian | 5.5% | 1.2%(+4.28)#21 | 1.2%(+4.29)#1,108 |
| 22. | Riceboro | 5.4% | 1.2%(+4.20)#22 | 1.2%(+4.21)#1,129 |
| 23. | Morrow | 5.4% | 1.2%(+4.20)#23 | 1.2%(+4.21)#1,133 |
| 24. | Edison | 5.1% | 1.2%(+3.90)#24 | 1.2%(+3.91)#1,234 |
| 25. | Panthersville | 4.9% | 1.2%(+3.73)#25 | 1.2%(+3.73)#1,301 |
| 26. | Statham | 4.8% | 1.2%(+3.57)#26 | 1.2%(+3.58)#1,367 |
| 27. | Cadwell | 4.7% | 1.2%(+3.53)#27 | 1.2%(+3.54)#1,392 |
| 28. | Hamilton | 4.6% | 1.2%(+3.40)#28 | 1.2%(+3.41)#1,448 |
| 29. | Montgomery | 4.6% | 1.2%(+3.38)#29 | 1.2%(+3.39)#1,453 |
| 30. | Parrott | 4.5% | 1.2%(+3.35)#30 | 1.2%(+3.36)#1,476 |
| 31. | Cochran | 4.5% | 1.2%(+3.34)#31 | 1.2%(+3.35)#1,482 |
| 32. | Dasher | 4.5% | 1.2%(+3.27)#32 | 1.2%(+3.28)#1,518 |
| 33. | Jonesboro | 4.4% | 1.2%(+3.23)#33 | 1.2%(+3.24)#1,537 |
| 34. | Lumpkin | 4.2% | 1.2%(+2.97)#34 | 1.2%(+2.98)#1,683 |
| 35. | Antioch | 4.2% | 1.2%(+2.96)#35 | 1.2%(+2.97)#1,696 |
| 36. | Temple | 4.1% | 1.2%(+2.95)#36 | 1.2%(+2.96)#1,703 |
| 37. | Willacoochee | 4.1% | 1.2%(+2.91)#37 | 1.2%(+2.92)#1,720 |
| 38. | Swainsboro | 4.1% | 1.2%(+2.89)#38 | 1.2%(+2.90)#1,736 |
| 39. | Midway | 4.0% | 1.2%(+2.85)#39 | 1.2%(+2.86)#1,763 |
| 40. | Montrose | 4.0% | 1.2%(+2.81)#40 | 1.2%(+2.81)#1,795 |
| 41. | Waverly Hall | 3.8% | 1.2%(+2.65)#41 | 1.2%(+2.66)#1,885 |
| 42. | Gumlog | 3.8% | 1.2%(+2.64)#42 | 1.2%(+2.65)#1,900 |
| 43. | Oglethorpe | 3.8% | 1.2%(+2.63)#43 | 1.2%(+2.64)#1,912 |
| 44. | Ashburn | 3.8% | 1.2%(+2.57)#44 | 1.2%(+2.58)#1,954 |
| 45. | Braswell | 3.7% | 1.2%(+2.46)#45 | 1.2%(+2.47)#2,058 |
| 46. | Reynolds | 3.6% | 1.2%(+2.42)#46 | 1.2%(+2.43)#2,098 |
| 47. | Abbeville | 3.6% | 1.2%(+2.42)#47 | 1.2%(+2.43)#2,103 |
| 48. | Franklin Springs | 3.6% | 1.2%(+2.41)#48 | 1.2%(+2.42)#2,121 |
| 49. | Woodbine | 3.4% | 1.2%(+2.23)#49 | 1.2%(+2.24)#2,288 |
| 50. | Hapeville | 3.3% | 1.2%(+2.15)#50 | 1.2%(+2.16)#2,368 |
| 51. | Haralson | 3.3% | 1.2%(+2.14)#51 | 1.2%(+2.15)#2,380 |
| 52. | Jeffersonville | 3.3% | 1.2%(+2.13)#52 | 1.2%(+2.14)#2,394 |
| 53. | Allenhurst | 3.3% | 1.2%(+2.12)#53 | 1.2%(+2.13)#2,397 |
| 54. | East Point | 3.3% | 1.2%(+2.09)#54 | 1.2%(+2.10)#2,431 |
| 55. | Unadilla | 3.2% | 1.2%(+2.05)#55 | 1.2%(+2.06)#2,484 |
| 56. | Donalsonville | 3.2% | 1.2%(+2.02)#56 | 1.2%(+2.03)#2,530 |
| 57. | Pearson | 3.2% | 1.2%(+1.99)#57 | 1.2%(+2.00)#2,552 |
| 58. | Cusseta Chattahoochee County Unified Government | 3.1% | 1.2%(+1.88)#58 | 1.2%(+1.89)#2,659 |
| 59. | Riverdale | 3.1% | 1.2%(+1.86)#59 | 1.2%(+1.87)#2,690 |
| 60. | Sylvester | 3.0% | 1.2%(+1.84)#60 | 1.2%(+1.85)#2,721 |
| 61. | Vienna | 3.0% | 1.2%(+1.82)#61 | 1.2%(+1.83)#2,748 |
| 62. | Stonecrest | 3.0% | 1.2%(+1.81)#62 | 1.2%(+1.82)#2,765 |
| 63. | Odum | 3.0% | 1.2%(+1.77)#63 | 1.2%(+1.78)#2,840 |
| 64. | Union Point | 2.9% | 1.2%(+1.70)#64 | 1.2%(+1.71)#2,913 |
| 65. | Summertown | 2.9% | 1.2%(+1.70)#65 | 1.2%(+1.71)#2,915 |
| 66. | Ball Ground | 2.9% | 1.2%(+1.70)#66 | 1.2%(+1.71)#2,917 |
| 67. | Talahi Island | 2.9% | 1.2%(+1.68)#67 | 1.2%(+1.69)#2,938 |
| 68. | Fairfield Plantation | 2.8% | 1.2%(+1.66)#68 | 1.2%(+1.66)#2,977 |
| 69. | Brinson | 2.8% | 1.2%(+1.64)#69 | 1.2%(+1.64)#3,002 |
| 70. | Bonanza | 2.8% | 1.2%(+1.62)#70 | 1.2%(+1.63)#3,015 |
| 71. | Greenville | 2.8% | 1.2%(+1.61)#71 | 1.2%(+1.62)#3,031 |
| 72. | Crawford | 2.8% | 1.2%(+1.60)#72 | 1.2%(+1.61)#3,040 |
| 73. | Carl | 2.7% | 1.2%(+1.53)#73 | 1.2%(+1.54)#3,154 |
| 74. | Royston | 2.7% | 1.2%(+1.48)#74 | 1.2%(+1.49)#3,235 |
| 75. | Rincon | 2.6% | 1.2%(+1.45)#75 | 1.2%(+1.46)#3,271 |
| 76. | Thomaston | 2.6% | 1.2%(+1.43)#76 | 1.2%(+1.44)#3,304 |
| 77. | Dawsonville | 2.6% | 1.2%(+1.43)#77 | 1.2%(+1.43)#3,314 |
| 78. | Leesburg | 2.6% | 1.2%(+1.42)#78 | 1.2%(+1.43)#3,323 |
| 79. | Guyton | 2.6% | 1.2%(+1.39)#79 | 1.2%(+1.39)#3,391 |
| 80. | Taylorsville | 2.5% | 1.2%(+1.35)#80 | 1.2%(+1.36)#3,465 |
| 81. | Higgston | 2.5% | 1.2%(+1.34)#81 | 1.2%(+1.35)#3,492 |
| 82. | Forsyth | 2.5% | 1.2%(+1.33)#82 | 1.2%(+1.34)#3,508 |
| 83. | Gresham Park | 2.5% | 1.2%(+1.30)#83 | 1.2%(+1.31)#3,585 |
| 84. | Vidalia | 2.4% | 1.2%(+1.25)#84 | 1.2%(+1.25)#3,665 |
| 85. | Augusta-Richmond County Consolidated Government (Balance) | 2.4% | 1.2%(+1.24)#85 | 1.2%(+1.24)#3,690 |
| 86. | Boston | 2.4% | 1.2%(+1.23)#86 | 1.2%(+1.24)#3,692 |
| 87. | Homer | 2.4% | 1.2%(+1.21)#87 | 1.2%(+1.22)#3,740 |
| 88. | College Park | 2.4% | 1.2%(+1.21)#88 | 1.2%(+1.22)#3,744 |
| 89. | Douglas | 2.4% | 1.2%(+1.20)#89 | 1.2%(+1.21)#3,754 |
| 90. | Nicholson | 2.4% | 1.2%(+1.20)#90 | 1.2%(+1.21)#3,757 |
| 91. | Ochlocknee | 2.4% | 1.2%(+1.19)#91 | 1.2%(+1.20)#3,795 |
| 92. | Irondale | 2.4% | 1.2%(+1.18)#92 | 1.2%(+1.19)#3,808 |
| 93. | Alapaha | 2.4% | 1.2%(+1.18)#93 | 1.2%(+1.19)#3,815 |
| 94. | Hardwick | 2.4% | 1.2%(+1.16)#94 | 1.2%(+1.17)#3,847 |
| 95. | Fort Stewart | 2.3% | 1.2%(+1.15)#95 | 1.2%(+1.16)#3,868 |
| 96. | Conley | 2.3% | 1.2%(+1.14)#96 | 1.2%(+1.15)#3,890 |
| 97. | Marshallville | 2.3% | 1.2%(+1.13)#97 | 1.2%(+1.13)#3,929 |
| 98. | Dearing | 2.3% | 1.2%(+1.10)#98 | 1.2%(+1.11)#3,984 |
| 99. | Belvedere Park | 2.3% | 1.2%(+1.09)#99 | 1.2%(+1.10)#4,008 |
| 100. | Alamo | 2.3% | 1.2%(+1.07)#100 | 1.2%(+1.08)#4,051 |
Common Questions
What are the Top 10 Cities with the Highest Percentage of Population Employed in Firefighting & Prevention in Georgia?
Top 10 Cities with the Highest Percentage of Population Employed in Firefighting & Prevention in Georgia are:
#1
15.1%
#2
13.1%
#3
13.0%
#4
11.7%
#5
11.4%
#6
9.8%
#7
9.7%
#8
9.5%
#9
8.9%
#10
8.4%
What city has the Highest Percentage of Population Employed in Firefighting & Prevention in Georgia?
Hiltonia has the Highest Percentage of Population Employed in Firefighting & Prevention in Georgia with 15.1%.
What is the Percentage of Population Employed in Firefighting & Prevention in the State of Georgia?
Percentage of Population Employed in Firefighting & Prevention in Georgia is 1.2%.
What is the Percentage of Population Employed in Firefighting & Prevention in the United States?
Percentage of Population Employed in Firefighting & Prevention in the United States is 1.2%.