Cities with the Highest Percentage of Population Employed in Firefighting & Prevention in Oklahoma
RELATED REPORTS & OPTIONS
Firefighting & Prevention
Oklahoma
Compare Cities
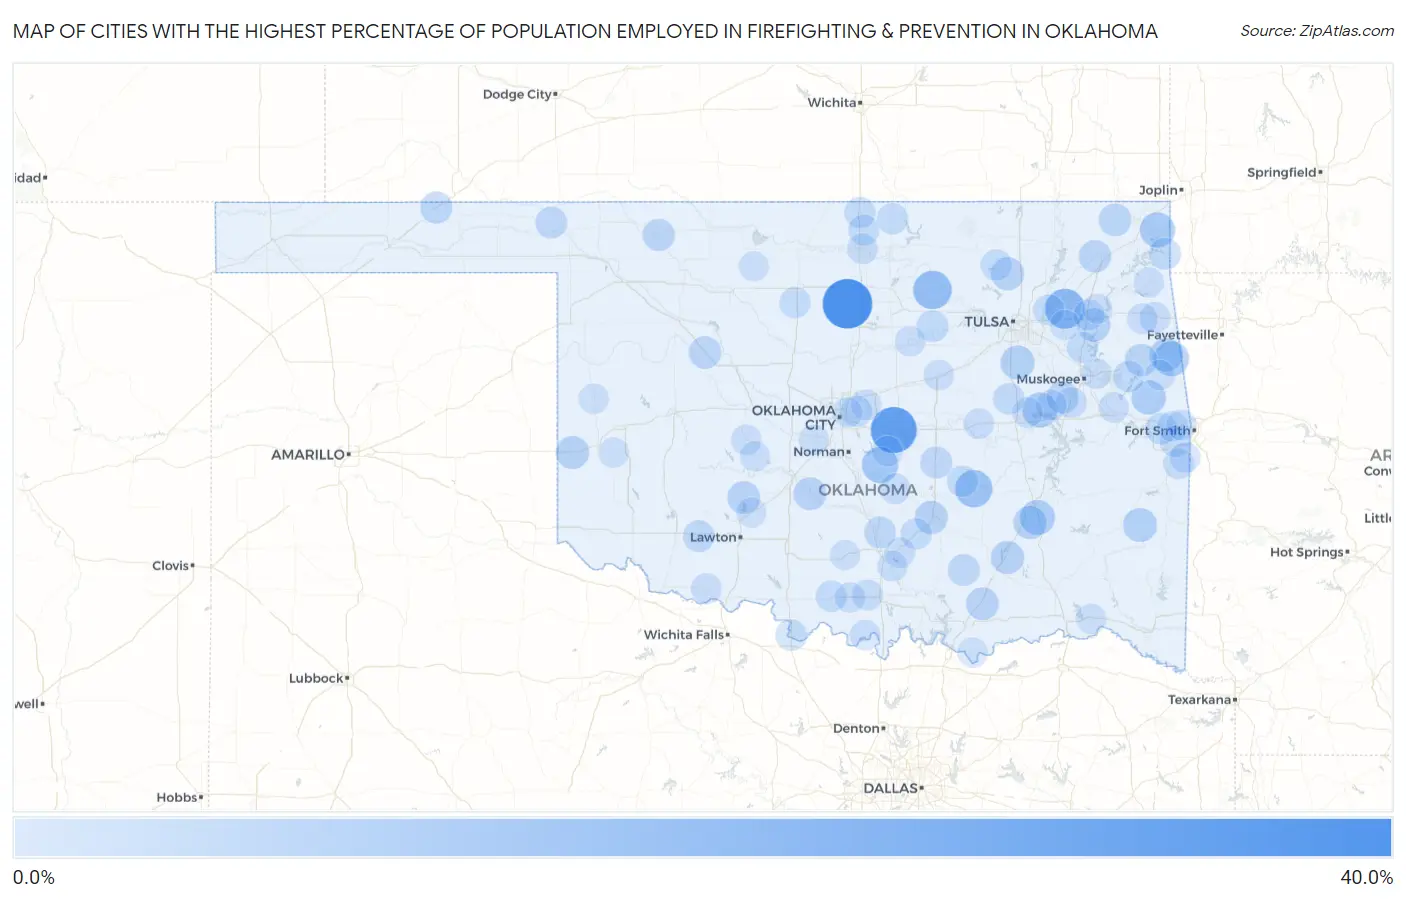
Map of Cities with the Highest Percentage of Population Employed in Firefighting & Prevention in Oklahoma
0.0%
40.0%
Cities with the Highest Percentage of Population Employed in Firefighting & Prevention in Oklahoma
| City | % Employed | vs State | vs National | |
| 1. | Lucien | 30.9% | 1.1%(+29.8)#1 | 1.2%(+29.7)#52 |
| 2. | Dale | 25.4% | 1.1%(+24.4)#2 | 1.2%(+24.2)#73 |
| 3. | Tiawah | 16.3% | 1.1%(+15.2)#3 | 1.2%(+15.1)#166 |
| 4. | Greenville | 15.4% | 1.1%(+14.3)#4 | 1.2%(+14.2)#193 |
| 5. | Little Rock | 14.3% | 1.1%(+13.2)#5 | 1.2%(+13.1)#224 |
| 6. | Skedee | 14.3% | 1.1%(+13.2)#6 | 1.2%(+13.1)#227 |
| 7. | Atwood | 12.5% | 1.1%(+11.4)#7 | 1.2%(+11.3)#295 |
| 8. | Etowah | 11.1% | 1.1%(+10.0)#8 | 1.2%(+9.93)#364 |
| 9. | Peavine | 9.5% | 1.1%(+8.42)#9 | 1.2%(+8.30)#456 |
| 10. | Wyandotte | 9.3% | 1.1%(+8.21)#10 | 1.2%(+8.09)#473 |
| 11. | Blanco | 9.1% | 1.1%(+8.02)#11 | 1.2%(+7.91)#497 |
| 12. | Hitchita | 9.1% | 1.1%(+8.02)#12 | 1.2%(+7.91)#499 |
| 13. | Flute Springs | 8.3% | 1.1%(+7.26)#13 | 1.2%(+7.15)#574 |
| 14. | Shady Grove Cdp Mcintosh County | 7.8% | 1.1%(+6.77)#14 | 1.2%(+6.66)#639 |
| 15. | Whitesboro | 7.7% | 1.1%(+6.62)#15 | 1.2%(+6.51)#660 |
| 16. | Liberty | 7.6% | 1.1%(+6.55)#16 | 1.2%(+6.43)#668 |
| 17. | Cave Spring | 7.1% | 1.1%(+6.07)#17 | 1.2%(+5.96)#736 |
| 18. | West Peavine | 7.0% | 1.1%(+5.97)#18 | 1.2%(+5.86)#752 |
| 19. | Pittsburg | 6.8% | 1.1%(+5.71)#19 | 1.2%(+5.59)#798 |
| 20. | Stringtown | 6.7% | 1.1%(+5.67)#20 | 1.2%(+5.56)#803 |
| 21. | Pin Oak Acres | 6.7% | 1.1%(+5.62)#21 | 1.2%(+5.50)#814 |
| 22. | Erick | 6.7% | 1.1%(+5.62)#22 | 1.2%(+5.50)#815 |
| 23. | Avant | 6.5% | 1.1%(+5.45)#23 | 1.2%(+5.34)#846 |
| 24. | Latta | 6.5% | 1.1%(+5.39)#24 | 1.2%(+5.27)#859 |
| 25. | Caddo | 6.1% | 1.1%(+5.06)#25 | 1.2%(+4.95)#916 |
| 26. | White Eagle | 6.1% | 1.1%(+5.04)#26 | 1.2%(+4.93)#922 |
| 27. | Alex | 6.1% | 1.1%(+5.02)#27 | 1.2%(+4.90)#929 |
| 28. | Apache | 6.1% | 1.1%(+4.99)#28 | 1.2%(+4.87)#938 |
| 29. | Oakwood | 5.7% | 1.1%(+4.64)#29 | 1.2%(+4.53)#1,041 |
| 30. | White Oak | 5.6% | 1.1%(+4.56)#30 | 1.2%(+4.45)#1,061 |
| 31. | Welch | 5.6% | 1.1%(+4.51)#31 | 1.2%(+4.40)#1,073 |
| 32. | Welling | 5.5% | 1.1%(+4.44)#32 | 1.2%(+4.32)#1,093 |
| 33. | Freedom | 5.3% | 1.1%(+4.25)#33 | 1.2%(+4.13)#1,162 |
| 34. | Whitehorn Cove | 5.1% | 1.1%(+4.08)#34 | 1.2%(+3.96)#1,221 |
| 35. | Wainwright | 5.1% | 1.1%(+4.06)#35 | 1.2%(+3.94)#1,226 |
| 36. | Tyrone | 5.0% | 1.1%(+3.93)#36 | 1.2%(+3.81)#1,270 |
| 37. | Bowlegs | 4.8% | 1.1%(+3.77)#37 | 1.2%(+3.65)#1,340 |
| 38. | Wapanucka | 4.8% | 1.1%(+3.73)#38 | 1.2%(+3.61)#1,358 |
| 39. | Wynnewood | 4.7% | 1.1%(+3.65)#39 | 1.2%(+3.54)#1,391 |
| 40. | Cayuga | 4.7% | 1.1%(+3.62)#40 | 1.2%(+3.50)#1,408 |
| 41. | Indiahoma | 4.5% | 1.1%(+3.48)#41 | 1.2%(+3.36)#1,471 |
| 42. | Gate | 4.5% | 1.1%(+3.48)#42 | 1.2%(+3.36)#1,478 |
| 43. | Yale | 4.5% | 1.1%(+3.43)#43 | 1.2%(+3.32)#1,504 |
| 44. | Canadian Shores | 4.3% | 1.1%(+3.28)#44 | 1.2%(+3.16)#1,588 |
| 45. | Gans | 4.3% | 1.1%(+3.24)#45 | 1.2%(+3.12)#1,616 |
| 46. | Okmulgee | 4.3% | 1.1%(+3.24)#46 | 1.2%(+3.12)#1,619 |
| 47. | Pettit | 4.2% | 1.1%(+3.14)#47 | 1.2%(+3.02)#1,667 |
| 48. | Newkirk | 4.0% | 1.1%(+2.96)#48 | 1.2%(+2.84)#1,775 |
| 49. | Braman | 4.0% | 1.1%(+2.93)#49 | 1.2%(+2.81)#1,801 |
| 50. | Terral | 3.9% | 1.1%(+2.87)#50 | 1.2%(+2.75)#1,828 |
| 51. | Spaulding | 3.9% | 1.1%(+2.85)#51 | 1.2%(+2.74)#1,837 |
| 52. | Barnsdall | 3.9% | 1.1%(+2.84)#52 | 1.2%(+2.73)#1,842 |
| 53. | Ringling | 3.9% | 1.1%(+2.82)#53 | 1.2%(+2.71)#1,857 |
| 54. | Wagoner | 3.8% | 1.1%(+2.73)#54 | 1.2%(+2.62)#1,923 |
| 55. | Waukomis | 3.8% | 1.1%(+2.71)#55 | 1.2%(+2.59)#1,947 |
| 56. | Spencer | 3.7% | 1.1%(+2.62)#56 | 1.2%(+2.50)#2,036 |
| 57. | Fort Coffee | 3.7% | 1.1%(+2.61)#57 | 1.2%(+2.49)#2,044 |
| 58. | Verdigris | 3.6% | 1.1%(+2.55)#58 | 1.2%(+2.43)#2,101 |
| 59. | Roff | 3.6% | 1.1%(+2.54)#59 | 1.2%(+2.43)#2,105 |
| 60. | Blackwell | 3.6% | 1.1%(+2.54)#60 | 1.2%(+2.42)#2,119 |
| 61. | Chouteau | 3.4% | 1.1%(+2.38)#61 | 1.2%(+2.26)#2,255 |
| 62. | Oktaha | 3.4% | 1.1%(+2.38)#62 | 1.2%(+2.26)#2,257 |
| 63. | Wanette | 3.3% | 1.1%(+2.26)#63 | 1.2%(+2.15)#2,379 |
| 64. | Council Hill | 3.3% | 1.1%(+2.26)#64 | 1.2%(+2.15)#2,381 |
| 65. | Flint Creek | 3.2% | 1.1%(+2.17)#65 | 1.2%(+2.05)#2,501 |
| 66. | Lone Grove | 3.2% | 1.1%(+2.16)#66 | 1.2%(+2.04)#2,503 |
| 67. | Cameron | 3.2% | 1.1%(+2.16)#67 | 1.2%(+2.04)#2,512 |
| 68. | Tonkawa | 3.1% | 1.1%(+2.06)#68 | 1.2%(+1.94)#2,604 |
| 69. | Grandfield | 3.1% | 1.1%(+2.00)#69 | 1.2%(+1.89)#2,671 |
| 70. | Rock Island | 3.1% | 1.1%(+1.98)#70 | 1.2%(+1.87)#2,694 |
| 71. | Muldrow | 3.0% | 1.1%(+1.97)#71 | 1.2%(+1.86)#2,707 |
| 72. | Pink | 3.0% | 1.1%(+1.97)#72 | 1.2%(+1.86)#2,711 |
| 73. | Oaks | 3.0% | 1.1%(+1.96)#73 | 1.2%(+1.84)#2,730 |
| 74. | Sulphur | 3.0% | 1.1%(+1.93)#74 | 1.2%(+1.82)#2,762 |
| 75. | Stroud | 2.9% | 1.1%(+1.87)#75 | 1.2%(+1.76)#2,859 |
| 76. | Okemah | 2.9% | 1.1%(+1.86)#76 | 1.2%(+1.75)#2,877 |
| 77. | Fort Gibson | 2.9% | 1.1%(+1.79)#77 | 1.2%(+1.68)#2,948 |
| 78. | Jones | 2.9% | 1.1%(+1.79)#78 | 1.2%(+1.68)#2,953 |
| 79. | Binger | 2.9% | 1.1%(+1.79)#79 | 1.2%(+1.67)#2,961 |
| 80. | Ripley | 2.8% | 1.1%(+1.76)#80 | 1.2%(+1.64)#3,001 |
| 81. | Jay | 2.8% | 1.1%(+1.74)#81 | 1.2%(+1.62)#3,026 |
| 82. | Wilson | 2.8% | 1.1%(+1.71)#82 | 1.2%(+1.59)#3,073 |
| 83. | Grayson | 2.8% | 1.1%(+1.71)#83 | 1.2%(+1.59)#3,083 |
| 84. | Burneyville | 2.7% | 1.1%(+1.66)#84 | 1.2%(+1.54)#3,153 |
| 85. | Gore | 2.7% | 1.1%(+1.62)#85 | 1.2%(+1.51)#3,201 |
| 86. | Roland | 2.7% | 1.1%(+1.62)#86 | 1.2%(+1.51)#3,205 |
| 87. | Dougherty | 2.6% | 1.1%(+1.56)#87 | 1.2%(+1.45)#3,298 |
| 88. | Tuttle | 2.6% | 1.1%(+1.53)#88 | 1.2%(+1.41)#3,366 |
| 89. | Fort Towson | 2.6% | 1.1%(+1.51)#89 | 1.2%(+1.39)#3,396 |
| 90. | Cheyenne | 2.6% | 1.1%(+1.49)#90 | 1.2%(+1.38)#3,420 |
| 91. | Gracemont | 2.6% | 1.1%(+1.49)#91 | 1.2%(+1.38)#3,422 |
| 92. | Kemp | 2.5% | 1.1%(+1.46)#92 | 1.2%(+1.35)#3,494 |
| 93. | Forest Park | 2.5% | 1.1%(+1.41)#93 | 1.2%(+1.29)#3,606 |
| 94. | Lyons Switch | 2.5% | 1.1%(+1.40)#94 | 1.2%(+1.28)#3,620 |
| 95. | Sportsmen Acres | 2.5% | 1.1%(+1.38)#95 | 1.2%(+1.27)#3,653 |
| 96. | Carter | 2.4% | 1.1%(+1.37)#96 | 1.2%(+1.25)#3,678 |
| 97. | Tatums | 2.4% | 1.1%(+1.37)#97 | 1.2%(+1.25)#3,679 |
| 98. | Elgin | 2.4% | 1.1%(+1.35)#98 | 1.2%(+1.23)#3,718 |
| 99. | Helena | 2.4% | 1.1%(+1.31)#99 | 1.2%(+1.20)#3,792 |
| 100. | Inola | 2.4% | 1.1%(+1.31)#100 | 1.2%(+1.19)#3,807 |
Common Questions
What are the Top 10 Cities with the Highest Percentage of Population Employed in Firefighting & Prevention in Oklahoma?
Top 10 Cities with the Highest Percentage of Population Employed in Firefighting & Prevention in Oklahoma are:
What city has the Highest Percentage of Population Employed in Firefighting & Prevention in Oklahoma?
Lucien has the Highest Percentage of Population Employed in Firefighting & Prevention in Oklahoma with 30.9%.
What is the Percentage of Population Employed in Firefighting & Prevention in the State of Oklahoma?
Percentage of Population Employed in Firefighting & Prevention in Oklahoma is 1.1%.
What is the Percentage of Population Employed in Firefighting & Prevention in the United States?
Percentage of Population Employed in Firefighting & Prevention in the United States is 1.2%.