Cities with the Highest Percentage of Population Employed in Firefighting & Prevention in Delaware

RELATED REPORTS & OPTIONS

Firefighting & Prevention
Population
Families and Households
Female Fertility
Female Fertility (Unmarried)
Race (Community Size)
Race (Percentage)
Ancestry (Community Size)
AfghanAfricanAlaska NativeAlaskan AthabascanAlbanianAleutAlsatianAmericanApacheArabArapahoArgentineanArmenianAssyrian / Chaldean / SyriacAustralianAustrianBahamianBangladeshiBarbadianBasqueBelgianBelizeanBermudanBhutaneseBlackfeetBolivianBrazilianBritishBritish West IndianBulgarianBurmeseCajunCambodianCanadianCape VerdeanCarpatho RusynCelticCentral AmericanCentral American IndianCherokeeCheyenneChickasawChileanChineseChippewaChoctawColombianColvilleComancheCosta RicanCreeCreekCroatianCrowCubanCypriotCzechCzechoslovakianDanishDelawareDominicanDutchDutch West IndianEastern EuropeanEcuadorianEgyptianEnglishEstonianEthiopianEuropeanFijianFilipinoFinnishFrenchFrench American IndianFrench CanadianGermanGerman RussianGhanaianGreekGuamanian / ChamorroGuatemalanGuyaneseHaitianHmongHonduranHopiHoumaHungarianIcelanderIndian (Asian)IndonesianInupiatIranianIraqiIrishIroquoisIsraeliItalianJamaicanJapaneseJordanianKenyanKiowaKoreanLaotianLatvianLebaneseLiberianLithuanianLumbeeLuxembourgerMacedonianMalaysianMalteseMarshalleseMenomineeMexicanMexican American IndianMongolianMoroccanNative HawaiianNavajoNepaleseNew ZealanderNicaraguanNigerianNorthern EuropeanNorwegianOkinawanOsageOttawaPaiutePakistaniPalestinianPanamanianParaguayanPennsylvania GermanPeruvianPimaPolishPortuguesePotawatomiPuebloPuerto RicanPuget Sound SalishRomanianRussianSalvadoranSamoanScandinavianScotch-IrishScottishSeminoleSenegaleseSerbianShoshoneSierra LeoneanSiouxSlavicSlovakSloveneSomaliSouth AfricanSouth AmericanSouth American IndianSoviet UnionSpaniardSpanishSpanish AmericanSpanish American IndianSri LankanSubsaharan AfricanSudaneseSwedishSwissSyrianTaiwaneseThaiTlingit-HaidaTohono O'OdhamTonganTrinidadian and TobagonianTsimshianTurkishU.S. Virgin IslanderUgandanUkrainianUruguayanUteVenezuelanVietnameseWelshWest IndianYakamaYaquiYugoslavianYumanYup'ikZimbabwean
Ancestry (Percentage)
AfghanAfricanAlaska NativeAlaskan AthabascanAlbanianAleutAlsatianAmericanApacheArabArapahoArgentineanArmenianAssyrian / Chaldean / SyriacAustralianAustrianBahamianBangladeshiBarbadianBasqueBelgianBelizeanBermudanBhutaneseBlackfeetBolivianBrazilianBritishBritish West IndianBulgarianBurmeseCajunCambodianCanadianCape VerdeanCarpatho RusynCelticCentral AmericanCentral American IndianCherokeeCheyenneChickasawChileanChineseChippewaChoctawColombianColvilleComancheCosta RicanCreeCreekCroatianCrowCubanCypriotCzechCzechoslovakianDanishDelawareDominicanDutchDutch West IndianEastern EuropeanEcuadorianEgyptianEnglishEstonianEthiopianEuropeanFijianFilipinoFinnishFrenchFrench American IndianFrench CanadianGermanGerman RussianGhanaianGreekGuamanian / ChamorroGuatemalanGuyaneseHaitianHmongHonduranHopiHoumaHungarianIcelanderIndian (Asian)IndonesianInupiatIranianIraqiIrishIroquoisIsraeliItalianJamaicanJapaneseJordanianKenyanKiowaKoreanLaotianLatvianLebaneseLiberianLithuanianLumbeeLuxembourgerMacedonianMalaysianMalteseMarshalleseMenomineeMexicanMexican American IndianMongolianMoroccanNative HawaiianNavajoNepaleseNew ZealanderNicaraguanNigerianNorthern EuropeanNorwegianOkinawanOsageOttawaPaiutePakistaniPalestinianPanamanianParaguayanPennsylvania GermanPeruvianPimaPolishPortuguesePotawatomiPuebloPuerto RicanPuget Sound SalishRomanianRussianSalvadoranSamoanScandinavianScotch-IrishScottishSeminoleSenegaleseSerbianShoshoneSierra LeoneanSiouxSlavicSlovakSloveneSomaliSouth AfricanSouth AmericanSouth American IndianSoviet UnionSpaniardSpanishSpanish AmericanSpanish American IndianSri LankanSubsaharan AfricanSudaneseSwedishSwissSyrianTaiwaneseThaiTlingit-HaidaTohono O'OdhamTonganTrinidadian and TobagonianTsimshianTurkishU.S. Virgin IslanderUgandanUkrainianUruguayanUteVenezuelanVietnameseWelshWest IndianYakamaYaquiYugoslavianYumanYup'ikZimbabwean
Immigrant Origin (Total)
AfghanistanAfricaAlbaniaArgentinaArmeniaAsiaAustraliaAustriaAzoresBahamasBangladeshBarbadosBelarusBelgiumBelizeBoliviaBosnia and HerzegovinaBrazilBulgariaBurma / MyanmarCabo VerdeCambodiaCameroonCanadaCaribbeanCentral AmericaChileChinaColombiaCongoCosta RicaCroatiaCubaCzechoslovakiaDenmarkDominicaDominican RepublicEastern AfricaEastern AsiaEastern EuropeEcuadorEgyptEl SalvadorEnglandEritreaEthiopiaEuropeFijiFranceGermanyGhanaGreeceGrenadaGuatemalaGuyanaHaitiHondurasHong KongHungaryIndiaIndonesiaIranIraqIrelandIsraelItalyJamaicaJapanJordanKazakhstanKenyaKoreaKuwaitLaosLatin AmericaLatviaLebanonLiberiaLithuaniaMalaysiaMexicoMicronesiaMiddle AfricaMoldovaMoroccoNepalNetherlandsNicaraguaNigeriaNorth MacedoniaNorthern AfricaNorthern EuropeNorwayOceaniaPakistanPanamaPeruPhilippinesPolandPortugalRomaniaRussiaSaudi ArabiaScotlandSenegalSerbiaSierra LeoneSingaporeSomaliaSouth AfricaSouth AmericaSouth Central AsiaSouth Eastern AsiaSouthern EuropeSpainSri LankaSt. Vincent and the GrenadinesSudanSwedenSwitzerlandSyriaTaiwanThailandTrinidad and TobagoTurkeyUgandaUkraineUruguayUzbekistanVenezuelaVietnamWest IndiesWestern AfricaWestern AsiaWestern EuropeYemenZaireZimbabwe
Immigrant Origin (Percentage)
AfghanistanAfricaAlbaniaArgentinaArmeniaAsiaAustraliaAustriaAzoresBahamasBangladeshBarbadosBelarusBelgiumBelizeBoliviaBosnia and HerzegovinaBrazilBulgariaBurma / MyanmarCabo VerdeCambodiaCameroonCanadaCaribbeanCentral AmericaChileChinaColombiaCongoCosta RicaCroatiaCubaCzechoslovakiaDenmarkDominicaDominican RepublicEastern AfricaEastern AsiaEastern EuropeEcuadorEgyptEl SalvadorEnglandEritreaEthiopiaEuropeFijiFranceGermanyGhanaGreeceGrenadaGuatemalaGuyanaHaitiHondurasHong KongHungaryIndiaIndonesiaIranIraqIrelandIsraelItalyJamaicaJapanJordanKazakhstanKenyaKoreaKuwaitLaosLatin AmericaLatviaLebanonLiberiaLithuaniaMalaysiaMexicoMicronesiaMiddle AfricaMoldovaMoroccoNepalNetherlandsNicaraguaNigeriaNorth MacedoniaNorthern AfricaNorthern EuropeNorwayOceaniaPakistanPanamaPeruPhilippinesPolandPortugalRomaniaRussiaSaudi ArabiaScotlandSenegalSerbiaSierra LeoneSingaporeSomaliaSouth AfricaSouth AmericaSouth Central AsiaSouth Eastern AsiaSouthern EuropeSpainSri LankaSt. Vincent and the GrenadinesSudanSwedenSwitzerlandSyriaTaiwanThailandTrinidad and TobagoTurkeyUgandaUkraineUruguayUzbekistanVenezuelaVietnamWest IndiesWestern AfricaWestern AsiaWestern EuropeYemenZaireZimbabwe
Income
Income (Families)
Income (Households)
Poverty
Poverty (Families)
Unemployment
Employment Occupations
Employment Industries
Employer Class
Commute Time
Commute Means
School Enrollment
Education by Degree Field
Occupancy
Finances
Physical Characteristics
Delaware
Compare Cities
Comparison Subject

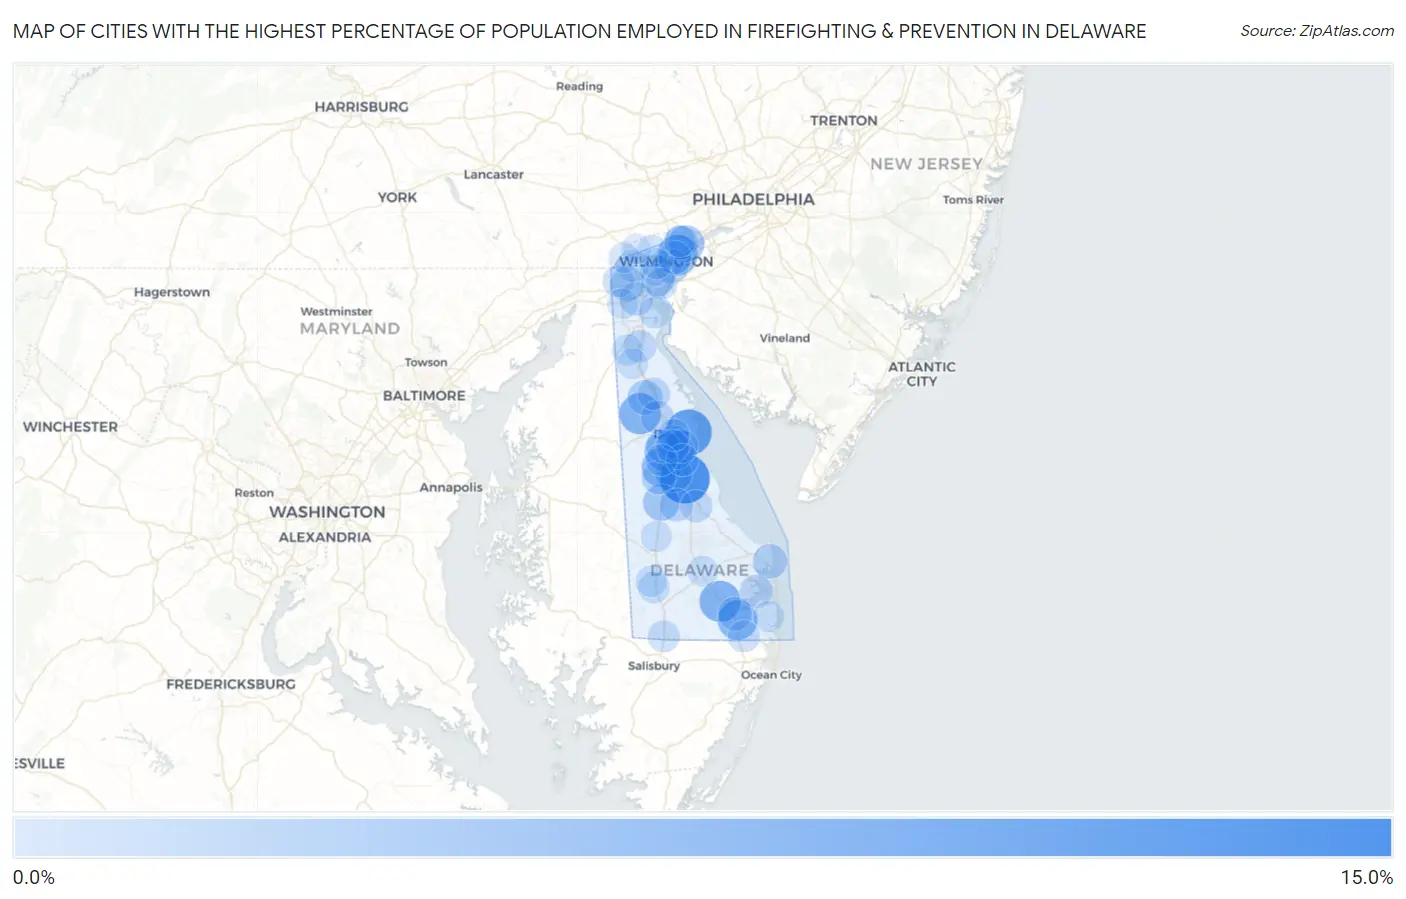
Map of Cities with the Highest Percentage of Population Employed in Firefighting & Prevention in Delaware

0.0%
15.0%
Cities with the Highest Percentage of Population Employed in Firefighting & Prevention in Delaware Map

Cities with the Highest Percentage of Population Employed in Firefighting & Prevention in Delaware

City % Employed vs State vs National
1.Frederica10.7%1.4%(+9.36)#11.2%(+9.56)#378
2.Little Creek8.8%1.4%(+7.44)#21.2%(+7.64)#523
3.Kenton6.0%1.4%(+4.64)#31.2%(+4.84)#950
4.Millsboro6.0%1.4%(+4.59)#41.2%(+4.79)#962
5.Bellefonte5.6%1.4%(+4.19)#51.2%(+4.39)#1,077
6.Frankford5.3%1.4%(+3.90)#61.2%(+4.10)#1,172
7.Viola4.9%1.4%(+3.49)#71.2%(+3.69)#1,317
8.Camden4.7%1.4%(+3.27)#81.2%(+3.47)#1,418
9.Riverview3.6%1.4%(+2.22)#91.2%(+2.43)#2,112
10.Claymont3.5%1.4%(+2.06)#101.2%(+2.26)#2,253
11.Harrington3.4%1.4%(+2.05)#111.2%(+2.25)#2,268
12.Rising Sun Lebanon3.1%1.4%(+1.76)#121.2%(+1.96)#2,586
13.Clayton2.5%1.4%(+1.13)#131.2%(+1.33)#3,538
14.Brookside2.4%1.4%(+0.970)#141.2%(+1.17)#3,851
15.Rehoboth Beach2.3%1.4%(+0.911)#151.2%(+1.11)#3,973
16.Wilmington2.2%1.4%(+0.845)#161.2%(+1.05)#4,125
17.Kent Acres2.1%1.4%(+0.733)#171.2%(+0.935)#4,403
18.Felton2.0%1.4%(+0.616)#181.2%(+0.818)#4,719
19.Ardentown2.0%1.4%(+0.613)#191.2%(+0.814)#4,741
20.Dover Base Housing1.9%1.4%(+0.562)#201.2%(+0.763)#4,897
21.Dagsboro1.9%1.4%(+0.517)#211.2%(+0.719)#5,039
22.Bear1.9%1.4%(+0.479)#221.2%(+0.680)#5,158
23.Wyoming1.7%1.4%(+0.324)#231.2%(+0.526)#5,690
24.Highland Acres1.7%1.4%(+0.308)#241.2%(+0.510)#5,750
25.Cheswold1.7%1.4%(+0.272)#251.2%(+0.474)#5,907
26.Wilmington Manor1.6%1.4%(+0.246)#261.2%(+0.447)#5,998
27.Edgemoor1.6%1.4%(+0.241)#271.2%(+0.443)#6,016
28.Houston1.6%1.4%(+0.200)#281.2%(+0.402)#6,170
29.Long Neck1.5%1.4%(+0.123)#291.2%(+0.325)#6,509
30.Smyrna1.3%1.4%(-0.098)#301.2%(+0.104)#7,628
31.Odessa1.2%1.4%(-0.183)#311.2%(+0.019)#8,111
32.Milford1.2%1.4%(-0.194)#321.2%(+0.008)#8,189
33.Magnolia1.1%1.4%(-0.238)#331.2%(-0.036)#8,454
34.Pike Creek Valley1.1%1.4%(-0.301)#341.2%(-0.099)#8,865
35.Newark1.0%1.4%(-0.372)#351.2%(-0.170)#9,306
36.Delmar1.0%1.4%(-0.377)#361.2%(-0.176)#9,336
37.Selbyville0.94%1.4%(-0.445)#371.2%(-0.243)#9,822
38.Dover0.90%1.4%(-0.483)#381.2%(-0.281)#10,086
39.Woodside0.89%1.4%(-0.495)#391.2%(-0.293)#10,170
40.Blades0.88%1.4%(-0.510)#401.2%(-0.309)#10,241
41.Greenville0.88%1.4%(-0.512)#411.2%(-0.310)#10,254
42.Delaware City0.78%1.4%(-0.609)#421.2%(-0.407)#10,970
43.Newport0.74%1.4%(-0.648)#431.2%(-0.446)#11,241
44.New Castle0.71%1.4%(-0.673)#441.2%(-0.471)#11,419
45.Seaford0.70%1.4%(-0.691)#451.2%(-0.489)#11,561
46.Middletown0.68%1.4%(-0.709)#461.2%(-0.507)#11,694
47.Arden0.67%1.4%(-0.719)#471.2%(-0.517)#11,781
48.Greenwood0.57%1.4%(-0.817)#481.2%(-0.616)#12,495
49.Ocean View0.55%1.4%(-0.837)#491.2%(-0.636)#12,654
50.Elsmere0.52%1.4%(-0.867)#501.2%(-0.665)#12,875
51.Townsend0.46%1.4%(-0.931)#511.2%(-0.730)#13,327
52.Georgetown0.35%1.4%(-1.03)#521.2%(-0.831)#13,998
53.Glasgow0.30%1.4%(-1.09)#531.2%(-0.890)#14,290
54.North Star0.28%1.4%(-1.11)#541.2%(-0.904)#14,368
55.Hockessin0.078%1.4%(-1.31)#551.2%(-1.11)#14,965

Common Questions

What are the Top 10 Cities with the Highest Percentage of Population Employed in Firefighting & Prevention in Delaware?
Top 10 Cities with the Highest Percentage of Population Employed in Firefighting & Prevention in Delaware are:
#1
10.7%
#2
8.8%
#3
6.0%
#4
6.0%
#5
5.6%
#6
5.3%
#7
4.9%
#8
4.7%
#9
3.6%
#10
3.5%
What city has the Highest Percentage of Population Employed in Firefighting & Prevention in Delaware?
Frederica has the Highest Percentage of Population Employed in Firefighting & Prevention in Delaware with 10.7%.
What is the Percentage of Population Employed in Firefighting & Prevention in the State of Delaware?
Percentage of Population Employed in Firefighting & Prevention in Delaware is 1.4%.
What is the Percentage of Population Employed in Firefighting & Prevention in the United States?
Percentage of Population Employed in Firefighting & Prevention in the United States is 1.2%.