Cities with the Highest Percentage of Population Employed in Firefighting & Prevention in Kansas
RELATED REPORTS & OPTIONS
Firefighting & Prevention
Kansas
Compare Cities
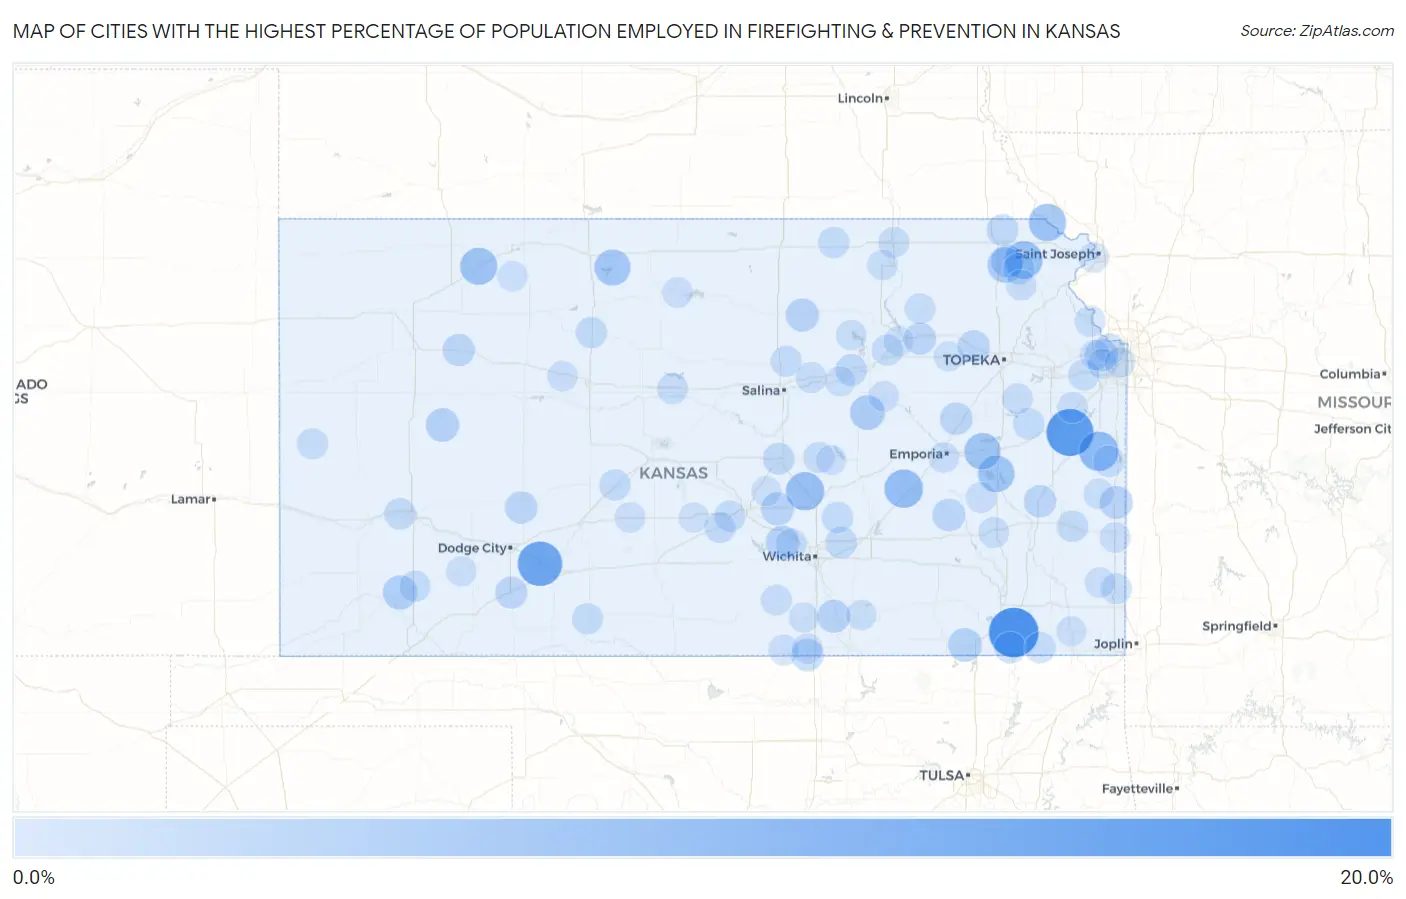
Map of Cities with the Highest Percentage of Population Employed in Firefighting & Prevention in Kansas
0.0%
20.0%
Cities with the Highest Percentage of Population Employed in Firefighting & Prevention in Kansas
| City | % Employed | vs State | vs National | |
| 1. | Liberty | 19.7% | 0.87%(+18.8)#1 | 1.2%(+18.5)#117 |
| 2. | Keats | 19.5% | 0.87%(+18.6)#2 | 1.2%(+18.3)#120 |
| 3. | Rantoul | 17.3% | 0.87%(+16.4)#3 | 1.2%(+16.1)#150 |
| 4. | Ford | 14.8% | 0.87%(+13.9)#4 | 1.2%(+13.6)#210 |
| 5. | Fontana | 9.8% | 0.87%(+8.92)#5 | 1.2%(+8.60)#437 |
| 6. | Matfield Green | 9.1% | 0.87%(+8.22)#6 | 1.2%(+7.91)#498 |
| 7. | Hesston | 8.7% | 0.87%(+7.88)#7 | 1.2%(+7.56)#529 |
| 8. | Willis | 8.3% | 0.87%(+7.47)#8 | 1.2%(+7.15)#576 |
| 9. | White Cloud | 7.9% | 0.87%(+7.03)#9 | 1.2%(+6.71)#636 |
| 10. | Jennings | 7.7% | 0.87%(+6.83)#10 | 1.2%(+6.51)#661 |
| 11. | New Strawn | 7.1% | 0.87%(+6.25)#11 | 1.2%(+5.93)#743 |
| 12. | Lebo | 7.0% | 0.87%(+6.12)#12 | 1.2%(+5.80)#764 |
| 13. | Kirwin | 6.7% | 0.87%(+5.80)#13 | 1.2%(+5.48)#826 |
| 14. | Kickapoo Site 7 | 5.9% | 0.87%(+5.02)#14 | 1.2%(+4.70)#995 |
| 15. | Herington | 5.5% | 0.87%(+4.59)#15 | 1.2%(+4.27)#1,116 |
| 16. | Satanta | 5.0% | 0.87%(+4.14)#16 | 1.2%(+3.83)#1,267 |
| 17. | Niotaze | 4.5% | 0.87%(+3.68)#17 | 1.2%(+3.36)#1,474 |
| 18. | Andale | 4.4% | 0.87%(+3.51)#18 | 1.2%(+3.19)#1,572 |
| 19. | Healy | 4.3% | 0.87%(+3.39)#19 | 1.2%(+3.07)#1,641 |
| 20. | Miltonvale | 4.1% | 0.87%(+3.19)#20 | 1.2%(+2.87)#1,756 |
| 21. | Oxford | 3.9% | 0.87%(+3.04)#21 | 1.2%(+2.72)#1,843 |
| 22. | Prescott | 3.9% | 0.87%(+3.03)#22 | 1.2%(+2.71)#1,852 |
| 23. | Kickapoo Site 1 | 3.8% | 0.87%(+2.98)#23 | 1.2%(+2.66)#1,895 |
| 24. | Burrton | 3.8% | 0.87%(+2.95)#24 | 1.2%(+2.63)#1,913 |
| 25. | Edwardsville | 3.7% | 0.87%(+2.85)#25 | 1.2%(+2.53)#2,000 |
| 26. | Hamilton | 3.5% | 0.87%(+2.66)#26 | 1.2%(+2.34)#2,178 |
| 27. | Admire | 3.5% | 0.87%(+2.61)#27 | 1.2%(+2.29)#2,227 |
| 28. | Jetmore | 3.4% | 0.87%(+2.50)#28 | 1.2%(+2.18)#2,352 |
| 29. | Hunnewell | 3.3% | 0.87%(+2.47)#29 | 1.2%(+2.15)#2,382 |
| 30. | Colony | 3.3% | 0.87%(+2.43)#30 | 1.2%(+2.11)#2,415 |
| 31. | Grainfield | 3.1% | 0.87%(+2.28)#31 | 1.2%(+1.96)#2,583 |
| 32. | Rossville | 3.0% | 0.87%(+2.17)#32 | 1.2%(+1.85)#2,720 |
| 33. | St George | 3.0% | 0.87%(+2.14)#33 | 1.2%(+1.82)#2,763 |
| 34. | Minneola | 3.0% | 0.87%(+2.12)#34 | 1.2%(+1.80)#2,793 |
| 35. | Mcpherson | 2.7% | 0.87%(+1.86)#35 | 1.2%(+1.54)#3,157 |
| 36. | Chapman | 2.7% | 0.87%(+1.85)#36 | 1.2%(+1.53)#3,176 |
| 37. | Morrill | 2.7% | 0.87%(+1.84)#37 | 1.2%(+1.52)#3,194 |
| 38. | Benton | 2.7% | 0.87%(+1.80)#38 | 1.2%(+1.48)#3,252 |
| 39. | Coffeyville | 2.6% | 0.87%(+1.77)#39 | 1.2%(+1.45)#3,290 |
| 40. | Horton | 2.6% | 0.87%(+1.75)#40 | 1.2%(+1.43)#3,317 |
| 41. | Bronson | 2.6% | 0.87%(+1.75)#41 | 1.2%(+1.43)#3,330 |
| 42. | Holcomb | 2.6% | 0.87%(+1.73)#42 | 1.2%(+1.41)#3,358 |
| 43. | Plainville | 2.5% | 0.87%(+1.59)#43 | 1.2%(+1.27)#3,639 |
| 44. | Pomona | 2.4% | 0.87%(+1.49)#44 | 1.2%(+1.17)#3,844 |
| 45. | Larned | 2.3% | 0.87%(+1.45)#45 | 1.2%(+1.13)#3,936 |
| 46. | Partridge | 2.3% | 0.87%(+1.43)#46 | 1.2%(+1.11)#3,976 |
| 47. | Whitewater | 2.3% | 0.87%(+1.43)#47 | 1.2%(+1.11)#3,994 |
| 48. | Coldwater | 2.3% | 0.87%(+1.41)#48 | 1.2%(+1.09)#4,031 |
| 49. | Morrowville | 2.3% | 0.87%(+1.41)#49 | 1.2%(+1.09)#4,038 |
| 50. | La Cygne | 2.2% | 0.87%(+1.38)#50 | 1.2%(+1.06)#4,100 |
| 51. | Sublette | 2.2% | 0.87%(+1.36)#51 | 1.2%(+1.04)#4,146 |
| 52. | Arlington | 2.2% | 0.87%(+1.36)#52 | 1.2%(+1.04)#4,151 |
| 53. | Edna | 2.2% | 0.87%(+1.33)#53 | 1.2%(+1.01)#4,203 |
| 54. | Ogden | 2.1% | 0.87%(+1.27)#54 | 1.2%(+0.953)#4,353 |
| 55. | Bennington | 2.1% | 0.87%(+1.25)#55 | 1.2%(+0.934)#4,404 |
| 56. | De Soto | 2.1% | 0.87%(+1.22)#56 | 1.2%(+0.902)#4,474 |
| 57. | Marysville | 2.1% | 0.87%(+1.19)#57 | 1.2%(+0.870)#4,564 |
| 58. | Tribune | 2.0% | 0.87%(+1.17)#58 | 1.2%(+0.855)#4,610 |
| 59. | Lehigh | 2.0% | 0.87%(+1.17)#59 | 1.2%(+0.855)#4,613 |
| 60. | Solomon | 2.0% | 0.87%(+1.16)#60 | 1.2%(+0.837)#4,661 |
| 61. | Dorrance | 2.0% | 0.87%(+1.09)#61 | 1.2%(+0.775)#4,873 |
| 62. | Wellsville | 1.9% | 0.87%(+1.08)#62 | 1.2%(+0.758)#4,908 |
| 63. | Conway Springs | 1.9% | 0.87%(+1.07)#63 | 1.2%(+0.748)#4,946 |
| 64. | Colwich | 1.9% | 0.87%(+1.04)#64 | 1.2%(+0.720)#5,036 |
| 65. | Frontenac | 1.9% | 0.87%(+1.04)#65 | 1.2%(+0.719)#5,038 |
| 66. | Yates Center | 1.9% | 0.87%(+1.02)#66 | 1.2%(+0.701)#5,094 |
| 67. | Leavenworth | 1.9% | 0.87%(+1.02)#67 | 1.2%(+0.699)#5,101 |
| 68. | Westmoreland | 1.9% | 0.87%(+1.000)#68 | 1.2%(+0.680)#5,160 |
| 69. | Gridley | 1.9% | 0.87%(+0.994)#69 | 1.2%(+0.675)#5,180 |
| 70. | Overbrook | 1.8% | 0.87%(+0.933)#70 | 1.2%(+0.614)#5,398 |
| 71. | Emporia | 1.7% | 0.87%(+0.834)#71 | 1.2%(+0.514)#5,740 |
| 72. | Caldwell | 1.7% | 0.87%(+0.825)#72 | 1.2%(+0.505)#5,779 |
| 73. | South Haven | 1.7% | 0.87%(+0.819)#73 | 1.2%(+0.500)#5,806 |
| 74. | Muscotah | 1.7% | 0.87%(+0.801)#74 | 1.2%(+0.481)#5,882 |
| 75. | Fort Scott | 1.6% | 0.87%(+0.783)#75 | 1.2%(+0.463)#5,938 |
| 76. | Ellis | 1.6% | 0.87%(+0.778)#76 | 1.2%(+0.458)#5,954 |
| 77. | White City | 1.6% | 0.87%(+0.747)#77 | 1.2%(+0.427)#6,071 |
| 78. | Greeley County Unified Government (Balance) | 1.6% | 0.87%(+0.730)#78 | 1.2%(+0.410)#6,141 |
| 79. | Downs | 1.6% | 0.87%(+0.726)#79 | 1.2%(+0.407)#6,153 |
| 80. | Elwood | 1.6% | 0.87%(+0.718)#80 | 1.2%(+0.398)#6,186 |
| 81. | Macksville | 1.6% | 0.87%(+0.684)#81 | 1.2%(+0.365)#6,330 |
| 82. | Waterville | 1.5% | 0.87%(+0.676)#82 | 1.2%(+0.357)#6,371 |
| 83. | Kansas City | 1.5% | 0.87%(+0.643)#83 | 1.2%(+0.323)#6,515 |
| 84. | Winfield | 1.5% | 0.87%(+0.636)#84 | 1.2%(+0.316)#6,549 |
| 85. | Girard | 1.5% | 0.87%(+0.635)#85 | 1.2%(+0.315)#6,553 |
| 86. | Bonner Springs | 1.5% | 0.87%(+0.617)#86 | 1.2%(+0.297)#6,626 |
| 87. | Wakefield | 1.5% | 0.87%(+0.614)#87 | 1.2%(+0.294)#6,638 |
| 88. | Mound City | 1.5% | 0.87%(+0.600)#88 | 1.2%(+0.280)#6,695 |
| 89. | Wellington | 1.4% | 0.87%(+0.577)#89 | 1.2%(+0.258)#6,802 |
| 90. | Montezuma | 1.4% | 0.87%(+0.563)#90 | 1.2%(+0.243)#6,868 |
| 91. | Paxico | 1.4% | 0.87%(+0.542)#91 | 1.2%(+0.223)#6,965 |
| 92. | Manhattan | 1.4% | 0.87%(+0.539)#92 | 1.2%(+0.220)#6,977 |
| 93. | Hillsboro | 1.4% | 0.87%(+0.537)#93 | 1.2%(+0.217)#6,987 |
| 94. | Sylvia | 1.4% | 0.87%(+0.504)#94 | 1.2%(+0.184)#7,132 |
| 95. | Shawnee | 1.4% | 0.87%(+0.496)#95 | 1.2%(+0.176)#7,184 |
| 96. | Mission | 1.4% | 0.87%(+0.491)#96 | 1.2%(+0.171)#7,221 |
| 97. | Enterprise | 1.3% | 0.87%(+0.476)#97 | 1.2%(+0.156)#7,312 |
| 98. | Lenora | 1.3% | 0.87%(+0.467)#98 | 1.2%(+0.148)#7,369 |
| 99. | Buhler | 1.3% | 0.87%(+0.461)#99 | 1.2%(+0.141)#7,409 |
| 100. | Oswego | 1.3% | 0.87%(+0.435)#100 | 1.2%(+0.115)#7,554 |
Common Questions
What are the Top 10 Cities with the Highest Percentage of Population Employed in Firefighting & Prevention in Kansas?
Top 10 Cities with the Highest Percentage of Population Employed in Firefighting & Prevention in Kansas are:
#1
19.7%
#2
17.3%
#3
14.8%
#4
9.8%
#5
9.1%
#6
8.7%
#7
8.3%
#8
7.9%
#9
7.7%
#10
7.1%
What city has the Highest Percentage of Population Employed in Firefighting & Prevention in Kansas?
Liberty has the Highest Percentage of Population Employed in Firefighting & Prevention in Kansas with 19.7%.
What is the Percentage of Population Employed in Firefighting & Prevention in the State of Kansas?
Percentage of Population Employed in Firefighting & Prevention in Kansas is 0.87%.
What is the Percentage of Population Employed in Firefighting & Prevention in the United States?
Percentage of Population Employed in Firefighting & Prevention in the United States is 1.2%.