Cities with the Highest Percentage of Population Employed in Firefighting & Prevention in Virginia
RELATED REPORTS & OPTIONS
Firefighting & Prevention
Virginia
Compare Cities
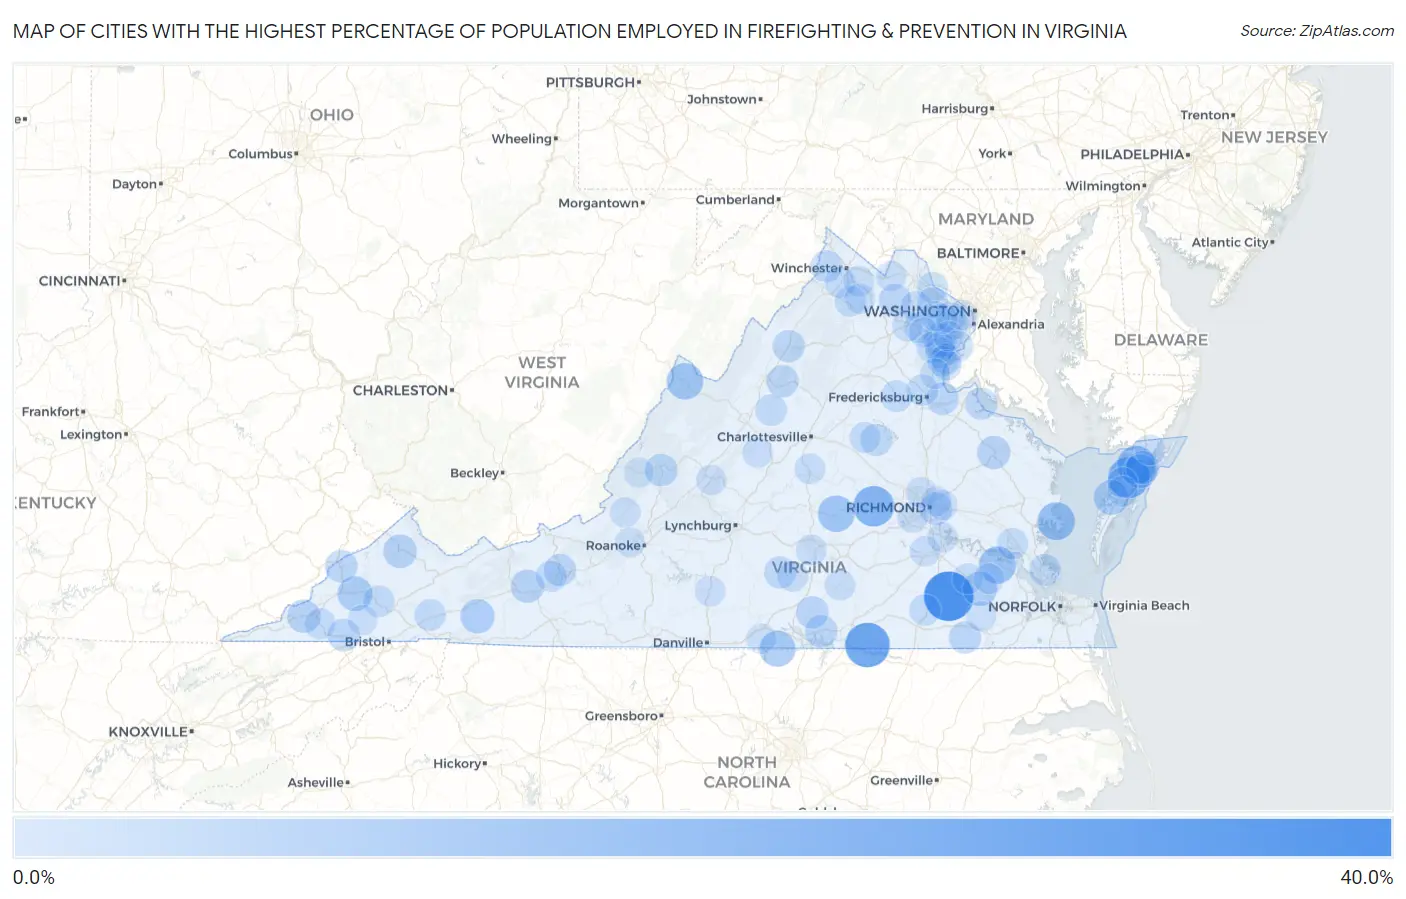
Map of Cities with the Highest Percentage of Population Employed in Firefighting & Prevention in Virginia
0.0%
40.0%
Cities with the Highest Percentage of Population Employed in Firefighting & Prevention in Virginia
| City | % Employed | vs State | vs National | |
| 1. | Sussex | 34.3% | 1.4%(+32.9)#1 | 1.2%(+33.1)#43 |
| 2. | Eggleston | 27.5% | 1.4%(+26.1)#2 | 1.2%(+26.3)#62 |
| 3. | Ebony | 25.9% | 1.4%(+24.5)#3 | 1.2%(+24.7)#67 |
| 4. | Greenbush | 20.5% | 1.4%(+19.0)#4 | 1.2%(+19.3)#109 |
| 5. | Powhatan | 19.4% | 1.4%(+18.0)#5 | 1.2%(+18.2)#121 |
| 6. | Boissevain | 17.2% | 1.4%(+15.7)#6 | 1.2%(+16.0)#152 |
| 7. | Bloxom | 15.5% | 1.4%(+14.1)#7 | 1.2%(+14.3)#191 |
| 8. | Mathews | 14.3% | 1.4%(+12.9)#8 | 1.2%(+13.2)#219 |
| 9. | Surry | 13.8% | 1.4%(+12.4)#9 | 1.2%(+12.6)#243 |
| 10. | Monterey | 12.5% | 1.4%(+11.1)#10 | 1.2%(+11.3)#289 |
| 11. | Cumberland | 12.4% | 1.4%(+11.0)#11 | 1.2%(+11.2)#298 |
| 12. | Virgilina | 11.6% | 1.4%(+10.2)#12 | 1.2%(+10.4)#333 |
| 13. | Boston | 9.9% | 1.4%(+8.50)#13 | 1.2%(+8.72)#423 |
| 14. | Riverview | 9.7% | 1.4%(+8.31)#14 | 1.2%(+8.54)#443 |
| 15. | Wakefield | 9.3% | 1.4%(+7.92)#15 | 1.2%(+8.14)#467 |
| 16. | Sugar Grove | 8.8% | 1.4%(+7.44)#16 | 1.2%(+7.66)#521 |
| 17. | Gargatha | 8.0% | 1.4%(+6.62)#17 | 1.2%(+6.84)#618 |
| 18. | Vansant | 7.9% | 1.4%(+6.51)#18 | 1.2%(+6.74)#630 |
| 19. | Dryden | 7.4% | 1.4%(+6.01)#19 | 1.2%(+6.24)#692 |
| 20. | Tappahannock | 7.3% | 1.4%(+5.85)#20 | 1.2%(+6.07)#715 |
| 21. | Modest Town | 7.2% | 1.4%(+5.81)#21 | 1.2%(+6.03)#722 |
| 22. | Max Meadows | 7.2% | 1.4%(+5.80)#22 | 1.2%(+6.02)#724 |
| 23. | County Center | 6.7% | 1.4%(+5.29)#23 | 1.2%(+5.51)#812 |
| 24. | Montrose | 6.4% | 1.4%(+4.95)#24 | 1.2%(+5.17)#880 |
| 25. | Pound | 6.1% | 1.4%(+4.74)#25 | 1.2%(+4.96)#912 |
| 26. | Iron Gate | 6.1% | 1.4%(+4.65)#26 | 1.2%(+4.87)#939 |
| 27. | Afton | 6.0% | 1.4%(+4.58)#27 | 1.2%(+4.80)#958 |
| 28. | Gate City | 5.9% | 1.4%(+4.53)#28 | 1.2%(+4.75)#973 |
| 29. | Passapatanzy | 5.9% | 1.4%(+4.47)#29 | 1.2%(+4.70)#988 |
| 30. | Boydton | 5.9% | 1.4%(+4.47)#30 | 1.2%(+4.70)#989 |
| 31. | Chase City | 5.9% | 1.4%(+4.45)#31 | 1.2%(+4.67)#1,000 |
| 32. | Massanutten | 5.8% | 1.4%(+4.41)#32 | 1.2%(+4.63)#1,011 |
| 33. | New Market | 5.8% | 1.4%(+4.40)#33 | 1.2%(+4.62)#1,014 |
| 34. | Middleburg | 5.5% | 1.4%(+4.11)#34 | 1.2%(+4.33)#1,091 |
| 35. | Dublin | 5.5% | 1.4%(+4.05)#35 | 1.2%(+4.27)#1,114 |
| 36. | Newsoms | 5.4% | 1.4%(+3.95)#36 | 1.2%(+4.17)#1,145 |
| 37. | Phenix | 5.3% | 1.4%(+3.89)#37 | 1.2%(+4.11)#1,169 |
| 38. | Mineral | 5.3% | 1.4%(+3.88)#38 | 1.2%(+4.10)#1,174 |
| 39. | Colonial Beach | 5.2% | 1.4%(+3.78)#39 | 1.2%(+4.00)#1,210 |
| 40. | Shawneeland | 5.0% | 1.4%(+3.58)#40 | 1.2%(+3.80)#1,280 |
| 41. | Bethel Manor | 4.9% | 1.4%(+3.46)#41 | 1.2%(+3.68)#1,323 |
| 42. | Castlewood | 4.7% | 1.4%(+3.30)#42 | 1.2%(+3.52)#1,400 |
| 43. | Harriston | 4.7% | 1.4%(+3.28)#43 | 1.2%(+3.50)#1,410 |
| 44. | Southern Gateway | 4.6% | 1.4%(+3.20)#44 | 1.2%(+3.42)#1,440 |
| 45. | Lake Wilderness | 4.5% | 1.4%(+3.11)#45 | 1.2%(+3.33)#1,493 |
| 46. | Emory | 4.4% | 1.4%(+3.03)#46 | 1.2%(+3.25)#1,531 |
| 47. | Jarratt | 4.3% | 1.4%(+2.94)#47 | 1.2%(+3.16)#1,585 |
| 48. | Kings Park | 4.3% | 1.4%(+2.86)#48 | 1.2%(+3.08)#1,634 |
| 49. | Duffield | 4.2% | 1.4%(+2.76)#49 | 1.2%(+2.98)#1,691 |
| 50. | Mantua | 4.2% | 1.4%(+2.74)#50 | 1.2%(+2.97)#1,698 |
| 51. | Williamsburg | 4.1% | 1.4%(+2.69)#51 | 1.2%(+2.91)#1,725 |
| 52. | Mason Neck | 4.1% | 1.4%(+2.68)#52 | 1.2%(+2.90)#1,734 |
| 53. | Pulaski | 4.0% | 1.4%(+2.60)#53 | 1.2%(+2.82)#1,790 |
| 54. | Countryside | 3.9% | 1.4%(+2.49)#54 | 1.2%(+2.71)#1,848 |
| 55. | Stephens City | 3.9% | 1.4%(+2.45)#55 | 1.2%(+2.67)#1,882 |
| 56. | Independent Hill | 3.8% | 1.4%(+2.37)#56 | 1.2%(+2.60)#1,944 |
| 57. | Bull Run | 3.8% | 1.4%(+2.34)#57 | 1.2%(+2.57)#1,963 |
| 58. | Louisa | 3.7% | 1.4%(+2.33)#58 | 1.2%(+2.55)#1,982 |
| 59. | Shenandoah Shores | 3.7% | 1.4%(+2.31)#59 | 1.2%(+2.53)#1,998 |
| 60. | Montclair | 3.5% | 1.4%(+2.07)#60 | 1.2%(+2.29)#2,230 |
| 61. | Victoria | 3.5% | 1.4%(+2.06)#61 | 1.2%(+2.28)#2,243 |
| 62. | Stone Ridge | 3.5% | 1.4%(+2.04)#62 | 1.2%(+2.27)#2,252 |
| 63. | Charlotte Court House | 3.4% | 1.4%(+1.99)#63 | 1.2%(+2.21)#2,320 |
| 64. | Cherry Hill | 3.3% | 1.4%(+1.87)#64 | 1.2%(+2.09)#2,448 |
| 65. | Waverly | 3.3% | 1.4%(+1.86)#65 | 1.2%(+2.08)#2,455 |
| 66. | Mcnair | 3.2% | 1.4%(+1.84)#66 | 1.2%(+2.06)#2,483 |
| 67. | Melfa | 3.2% | 1.4%(+1.84)#67 | 1.2%(+2.06)#2,493 |
| 68. | Scottsville | 3.2% | 1.4%(+1.81)#68 | 1.2%(+2.03)#2,529 |
| 69. | Boyce | 3.2% | 1.4%(+1.78)#69 | 1.2%(+2.00)#2,554 |
| 70. | Gainesville | 3.2% | 1.4%(+1.75)#70 | 1.2%(+1.98)#2,574 |
| 71. | Dendron | 3.1% | 1.4%(+1.74)#71 | 1.2%(+1.96)#2,584 |
| 72. | Wintergreen | 3.1% | 1.4%(+1.69)#72 | 1.2%(+1.91)#2,629 |
| 73. | Triangle | 3.1% | 1.4%(+1.69)#73 | 1.2%(+1.91)#2,632 |
| 74. | Hampden Sydney | 3.1% | 1.4%(+1.68)#74 | 1.2%(+1.90)#2,646 |
| 75. | Gretna | 3.1% | 1.4%(+1.65)#75 | 1.2%(+1.88)#2,684 |
| 76. | Rockwood | 3.1% | 1.4%(+1.65)#76 | 1.2%(+1.87)#2,698 |
| 77. | Laurel | 3.0% | 1.4%(+1.62)#77 | 1.2%(+1.84)#2,733 |
| 78. | Onancock | 3.0% | 1.4%(+1.59)#78 | 1.2%(+1.82)#2,761 |
| 79. | Shenandoah Farms | 3.0% | 1.4%(+1.58)#79 | 1.2%(+1.80)#2,797 |
| 80. | Matoaca | 3.0% | 1.4%(+1.55)#80 | 1.2%(+1.77)#2,841 |
| 81. | Buena Vista | 2.9% | 1.4%(+1.51)#81 | 1.2%(+1.73)#2,891 |
| 82. | Wattsville | 2.9% | 1.4%(+1.50)#82 | 1.2%(+1.72)#2,904 |
| 83. | Seven Corners | 2.7% | 1.4%(+1.34)#83 | 1.2%(+1.56)#3,127 |
| 84. | Enon | 2.7% | 1.4%(+1.31)#84 | 1.2%(+1.53)#3,163 |
| 85. | Dale City | 2.7% | 1.4%(+1.28)#85 | 1.2%(+1.50)#3,218 |
| 86. | Round Hill | 2.7% | 1.4%(+1.28)#86 | 1.2%(+1.50)#3,219 |
| 87. | New Castle | 2.7% | 1.4%(+1.27)#87 | 1.2%(+1.49)#3,226 |
| 88. | Quantico | 2.7% | 1.4%(+1.25)#88 | 1.2%(+1.47)#3,261 |
| 89. | Covington | 2.6% | 1.4%(+1.22)#89 | 1.2%(+1.44)#3,301 |
| 90. | Highland Springs | 2.6% | 1.4%(+1.21)#90 | 1.2%(+1.43)#3,322 |
| 91. | Aquia Harbour | 2.6% | 1.4%(+1.18)#91 | 1.2%(+1.40)#3,386 |
| 92. | Sedley | 2.5% | 1.4%(+1.11)#92 | 1.2%(+1.34)#3,521 |
| 93. | George Mason | 2.5% | 1.4%(+1.10)#93 | 1.2%(+1.32)#3,549 |
| 94. | Nickelsville | 2.4% | 1.4%(+1.03)#94 | 1.2%(+1.25)#3,674 |
| 95. | Cluster Springs | 2.4% | 1.4%(+1.01)#95 | 1.2%(+1.24)#3,705 |
| 96. | Manassas | 2.4% | 1.4%(+1.01)#96 | 1.2%(+1.23)#3,714 |
| 97. | East Highland Park | 2.4% | 1.4%(+1.01)#97 | 1.2%(+1.23)#3,724 |
| 98. | Salem | 2.4% | 1.4%(+0.996)#98 | 1.2%(+1.22)#3,746 |
| 99. | Fair Lakes | 2.4% | 1.4%(+0.974)#99 | 1.2%(+1.20)#3,787 |
| 100. | Crosspointe | 2.4% | 1.4%(+0.974)#100 | 1.2%(+1.20)#3,789 |
Common Questions
What are the Top 10 Cities with the Highest Percentage of Population Employed in Firefighting & Prevention in Virginia?
Top 10 Cities with the Highest Percentage of Population Employed in Firefighting & Prevention in Virginia are:
What city has the Highest Percentage of Population Employed in Firefighting & Prevention in Virginia?
Sussex has the Highest Percentage of Population Employed in Firefighting & Prevention in Virginia with 34.3%.
What is the Percentage of Population Employed in Firefighting & Prevention in the State of Virginia?
Percentage of Population Employed in Firefighting & Prevention in Virginia is 1.4%.
What is the Percentage of Population Employed in Firefighting & Prevention in the United States?
Percentage of Population Employed in Firefighting & Prevention in the United States is 1.2%.