Cities with the Highest Percentage of Population Employed in Firefighting & Prevention in North Dakota
RELATED REPORTS & OPTIONS
Firefighting & Prevention
North Dakota
Compare Cities
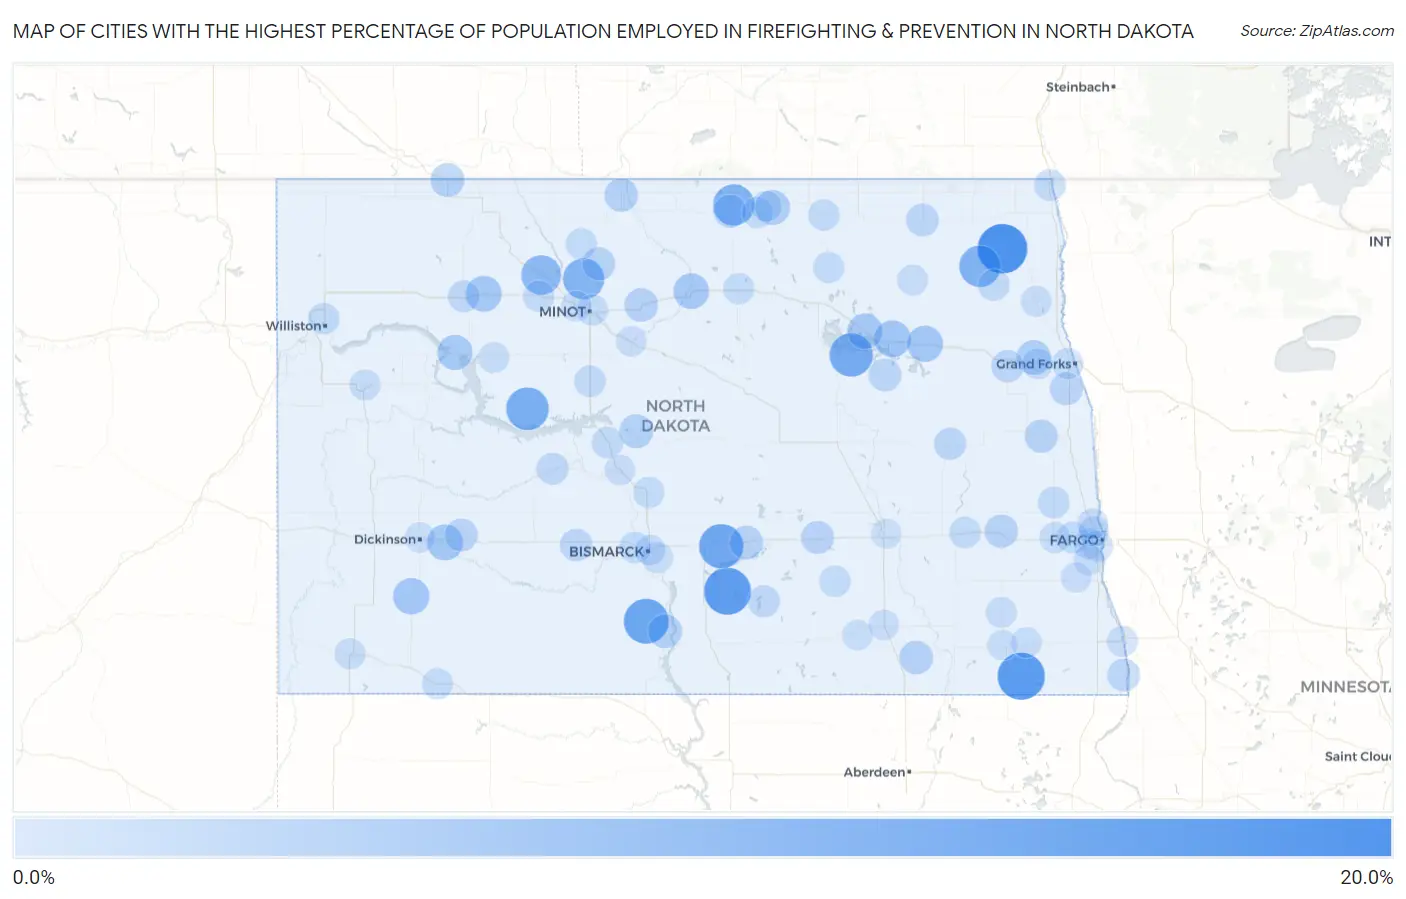
Map of Cities with the Highest Percentage of Population Employed in Firefighting & Prevention in North Dakota
0.0%
20.0%
Cities with the Highest Percentage of Population Employed in Firefighting & Prevention in North Dakota
| City | % Employed | vs State | vs National | |
| 1. | Crystal | 16.7% | 0.74%(+15.9)#1 | 1.2%(+15.5)#161 |
| 2. | Rutland | 14.6% | 0.74%(+13.9)#2 | 1.2%(+13.4)#214 |
| 3. | Braddock | 14.3% | 0.74%(+13.5)#3 | 1.2%(+13.1)#230 |
| 4. | Solen | 12.5% | 0.74%(+11.8)#4 | 1.2%(+11.3)#296 |
| 5. | Driscoll | 12.0% | 0.74%(+11.3)#5 | 1.2%(+10.8)#309 |
| 6. | Fort Totten | 11.2% | 0.74%(+10.4)#6 | 1.2%(+10.00)#354 |
| 7. | White Shield | 10.6% | 0.74%(+9.89)#7 | 1.2%(+9.45)#386 |
| 8. | Edinburg | 9.5% | 0.74%(+8.78)#8 | 1.2%(+8.34)#454 |
| 9. | East Dunseith | 9.4% | 0.74%(+8.69)#9 | 1.2%(+8.25)#460 |
| 10. | Minot Afb | 9.3% | 0.74%(+8.55)#10 | 1.2%(+8.11)#470 |
| 11. | Carpio | 8.0% | 0.74%(+7.26)#11 | 1.2%(+6.81)#621 |
| 12. | Crary | 5.5% | 0.74%(+4.71)#12 | 1.2%(+4.27)#1,118 |
| 13. | New England | 5.1% | 0.74%(+4.31)#13 | 1.2%(+3.87)#1,254 |
| 14. | Lakota | 5.0% | 0.74%(+4.22)#14 | 1.2%(+3.78)#1,285 |
| 15. | Palermo | 4.8% | 0.74%(+4.09)#15 | 1.2%(+3.65)#1,342 |
| 16. | Gladstone | 4.8% | 0.74%(+4.05)#16 | 1.2%(+3.61)#1,359 |
| 17. | Towner | 4.5% | 0.74%(+3.76)#17 | 1.2%(+3.31)#1,506 |
| 18. | Devils Lake | 4.4% | 0.74%(+3.68)#18 | 1.2%(+3.24)#1,535 |
| 19. | Trenton | 4.4% | 0.74%(+3.62)#19 | 1.2%(+3.18)#1,580 |
| 20. | New Town | 4.1% | 0.74%(+3.36)#20 | 1.2%(+2.92)#1,721 |
| 21. | Green Acres | 3.8% | 0.74%(+3.05)#21 | 1.2%(+2.61)#1,926 |
| 22. | Grand Forks Afb | 3.7% | 0.74%(+2.99)#22 | 1.2%(+2.55)#1,973 |
| 23. | Turtle Lake | 3.1% | 0.74%(+2.33)#23 | 1.2%(+1.88)#2,674 |
| 24. | Cannon Ball | 3.1% | 0.74%(+2.32)#24 | 1.2%(+1.88)#2,678 |
| 25. | Portal | 3.0% | 0.74%(+2.29)#25 | 1.2%(+1.84)#2,731 |
| 26. | Fullerton | 2.9% | 0.74%(+2.11)#26 | 1.2%(+1.67)#2,971 |
| 27. | Steele | 2.8% | 0.74%(+2.10)#27 | 1.2%(+1.66)#2,978 |
| 28. | Granville | 2.8% | 0.74%(+2.03)#28 | 1.2%(+1.59)#3,079 |
| 29. | Westhope | 2.7% | 0.74%(+2.00)#29 | 1.2%(+1.56)#3,124 |
| 30. | Tower City | 2.6% | 0.74%(+1.83)#30 | 1.2%(+1.39)#3,398 |
| 31. | Mayville | 2.5% | 0.74%(+1.71)#31 | 1.2%(+1.26)#3,655 |
| 32. | Glenburn | 2.4% | 0.74%(+1.68)#32 | 1.2%(+1.24)#3,696 |
| 33. | Dunseith | 2.4% | 0.74%(+1.63)#33 | 1.2%(+1.19)#3,814 |
| 34. | Medina | 2.3% | 0.74%(+1.60)#34 | 1.2%(+1.16)#3,872 |
| 35. | Thompson | 2.2% | 0.74%(+1.47)#35 | 1.2%(+1.03)#4,175 |
| 36. | Taylor | 2.2% | 0.74%(+1.45)#36 | 1.2%(+1.01)#4,205 |
| 37. | Warwick | 2.1% | 0.74%(+1.34)#37 | 1.2%(+0.898)#4,490 |
| 38. | Fairmount | 2.1% | 0.74%(+1.31)#38 | 1.2%(+0.869)#4,574 |
| 39. | Langdon | 2.0% | 0.74%(+1.28)#39 | 1.2%(+0.840)#4,656 |
| 40. | New Salem | 2.0% | 0.74%(+1.23)#40 | 1.2%(+0.792)#4,824 |
| 41. | Larimore | 1.9% | 0.74%(+1.12)#41 | 1.2%(+0.675)#5,177 |
| 42. | Cooperstown | 1.7% | 0.74%(+0.965)#42 | 1.2%(+0.524)#5,702 |
| 43. | Napoleon | 1.5% | 0.74%(+0.782)#43 | 1.2%(+0.341)#6,434 |
| 44. | Hazen | 1.5% | 0.74%(+0.722)#44 | 1.2%(+0.281)#6,692 |
| 45. | Stanley | 1.4% | 0.74%(+0.667)#45 | 1.2%(+0.226)#6,945 |
| 46. | Arthur | 1.3% | 0.74%(+0.545)#46 | 1.2%(+0.105)#7,627 |
| 47. | Mandan | 1.2% | 0.74%(+0.490)#47 | 1.2%(+0.050)#7,933 |
| 48. | Max | 1.2% | 0.74%(+0.460)#48 | 1.2%(+0.019)#8,114 |
| 49. | Pembina | 1.2% | 0.74%(+0.446)#49 | 1.2%(+0.005)#8,209 |
| 50. | Mapleton | 1.2% | 0.74%(+0.430)#50 | 1.2%(-0.011)#8,306 |
| 51. | Underwood | 1.1% | 0.74%(+0.395)#51 | 1.2%(-0.046)#8,511 |
| 52. | Park River | 1.1% | 0.74%(+0.391)#52 | 1.2%(-0.049)#8,529 |
| 53. | Rocklake | 1.1% | 0.74%(+0.391)#53 | 1.2%(-0.049)#8,540 |
| 54. | Valley City | 1.1% | 0.74%(+0.325)#54 | 1.2%(-0.116)#8,962 |
| 55. | Williston | 1.1% | 0.74%(+0.320)#55 | 1.2%(-0.121)#9,000 |
| 56. | Berthold | 1.0% | 0.74%(+0.260)#56 | 1.2%(-0.181)#9,370 |
| 57. | Gackle | 1.0% | 0.74%(+0.255)#57 | 1.2%(-0.186)#9,398 |
| 58. | Lansford | 1.0% | 0.74%(+0.255)#58 | 1.2%(-0.186)#9,399 |
| 59. | Shell Valley | 0.95% | 0.74%(+0.208)#59 | 1.2%(-0.233)#9,752 |
| 60. | Wilton | 0.92% | 0.74%(+0.173)#60 | 1.2%(-0.268)#10,000 |
| 61. | Cando | 0.87% | 0.74%(+0.120)#61 | 1.2%(-0.321)#10,343 |
| 62. | Grand Forks | 0.85% | 0.74%(+0.108)#62 | 1.2%(-0.333)#10,443 |
| 63. | Minot | 0.79% | 0.74%(+0.048)#63 | 1.2%(-0.393)#10,866 |
| 64. | Rugby | 0.79% | 0.74%(+0.048)#64 | 1.2%(-0.393)#10,873 |
| 65. | Hettinger | 0.76% | 0.74%(+0.011)#65 | 1.2%(-0.430)#11,141 |
| 66. | Lincoln | 0.70% | 0.74%(-0.040)#66 | 1.2%(-0.481)#11,497 |
| 67. | Fargo | 0.69% | 0.74%(-0.052)#67 | 1.2%(-0.493)#11,586 |
| 68. | West Fargo | 0.66% | 0.74%(-0.086)#68 | 1.2%(-0.526)#11,876 |
| 69. | Edmore | 0.66% | 0.74%(-0.087)#69 | 1.2%(-0.528)#11,890 |
| 70. | Casselton | 0.65% | 0.74%(-0.100)#70 | 1.2%(-0.541)#11,981 |
| 71. | Parshall | 0.64% | 0.74%(-0.108)#71 | 1.2%(-0.549)#12,037 |
| 72. | Minto | 0.62% | 0.74%(-0.128)#72 | 1.2%(-0.569)#12,176 |
| 73. | Watford City | 0.61% | 0.74%(-0.131)#73 | 1.2%(-0.572)#12,203 |
| 74. | Bowman | 0.60% | 0.74%(-0.141)#74 | 1.2%(-0.582)#12,279 |
| 75. | Lisbon | 0.57% | 0.74%(-0.179)#75 | 1.2%(-0.620)#12,539 |
| 76. | Harwood | 0.53% | 0.74%(-0.219)#76 | 1.2%(-0.659)#12,830 |
| 77. | Wahpeton | 0.51% | 0.74%(-0.235)#77 | 1.2%(-0.676)#12,951 |
| 78. | Emerado | 0.48% | 0.74%(-0.264)#78 | 1.2%(-0.705)#13,145 |
| 79. | Belcourt | 0.47% | 0.74%(-0.272)#79 | 1.2%(-0.713)#13,215 |
| 80. | Milnor | 0.47% | 0.74%(-0.275)#80 | 1.2%(-0.716)#13,237 |
| 81. | Burlington | 0.45% | 0.74%(-0.291)#81 | 1.2%(-0.732)#13,341 |
| 82. | Dickinson | 0.44% | 0.74%(-0.303)#82 | 1.2%(-0.744)#13,403 |
| 83. | Bismarck | 0.44% | 0.74%(-0.308)#83 | 1.2%(-0.749)#13,431 |
| 84. | Kulm | 0.41% | 0.74%(-0.332)#84 | 1.2%(-0.773)#13,606 |
| 85. | Velva | 0.41% | 0.74%(-0.337)#85 | 1.2%(-0.778)#13,638 |
| 86. | Reile S Acres | 0.39% | 0.74%(-0.356)#86 | 1.2%(-0.797)#13,768 |
| 87. | Edgeley | 0.30% | 0.74%(-0.444)#87 | 1.2%(-0.885)#14,271 |
| 88. | Horace | 0.27% | 0.74%(-0.473)#88 | 1.2%(-0.914)#14,431 |
| 89. | Washburn | 0.25% | 0.74%(-0.496)#89 | 1.2%(-0.937)#14,550 |
| 90. | Gwinner | 0.21% | 0.74%(-0.536)#90 | 1.2%(-0.977)#14,703 |
| 91. | Kindred | 0.19% | 0.74%(-0.553)#91 | 1.2%(-0.994)#14,751 |
| 92. | Jamestown | 0.051% | 0.74%(-0.694)#92 | 1.2%(-1.13)#14,981 |
Common Questions
What are the Top 10 Cities with the Highest Percentage of Population Employed in Firefighting & Prevention in North Dakota?
Top 10 Cities with the Highest Percentage of Population Employed in Firefighting & Prevention in North Dakota are:
#1
16.7%
#2
14.6%
#3
14.3%
#4
12.5%
#5
12.0%
#6
11.2%
#7
10.6%
#8
9.5%
#9
9.4%
#10
9.3%
What city has the Highest Percentage of Population Employed in Firefighting & Prevention in North Dakota?
Crystal has the Highest Percentage of Population Employed in Firefighting & Prevention in North Dakota with 16.7%.
What is the Percentage of Population Employed in Firefighting & Prevention in the State of North Dakota?
Percentage of Population Employed in Firefighting & Prevention in North Dakota is 0.74%.
What is the Percentage of Population Employed in Firefighting & Prevention in the United States?
Percentage of Population Employed in Firefighting & Prevention in the United States is 1.2%.