Cities with the Highest Percentage of Population Employed in Firefighting & Prevention in Colorado
RELATED REPORTS & OPTIONS
Firefighting & Prevention
Colorado
Compare Cities
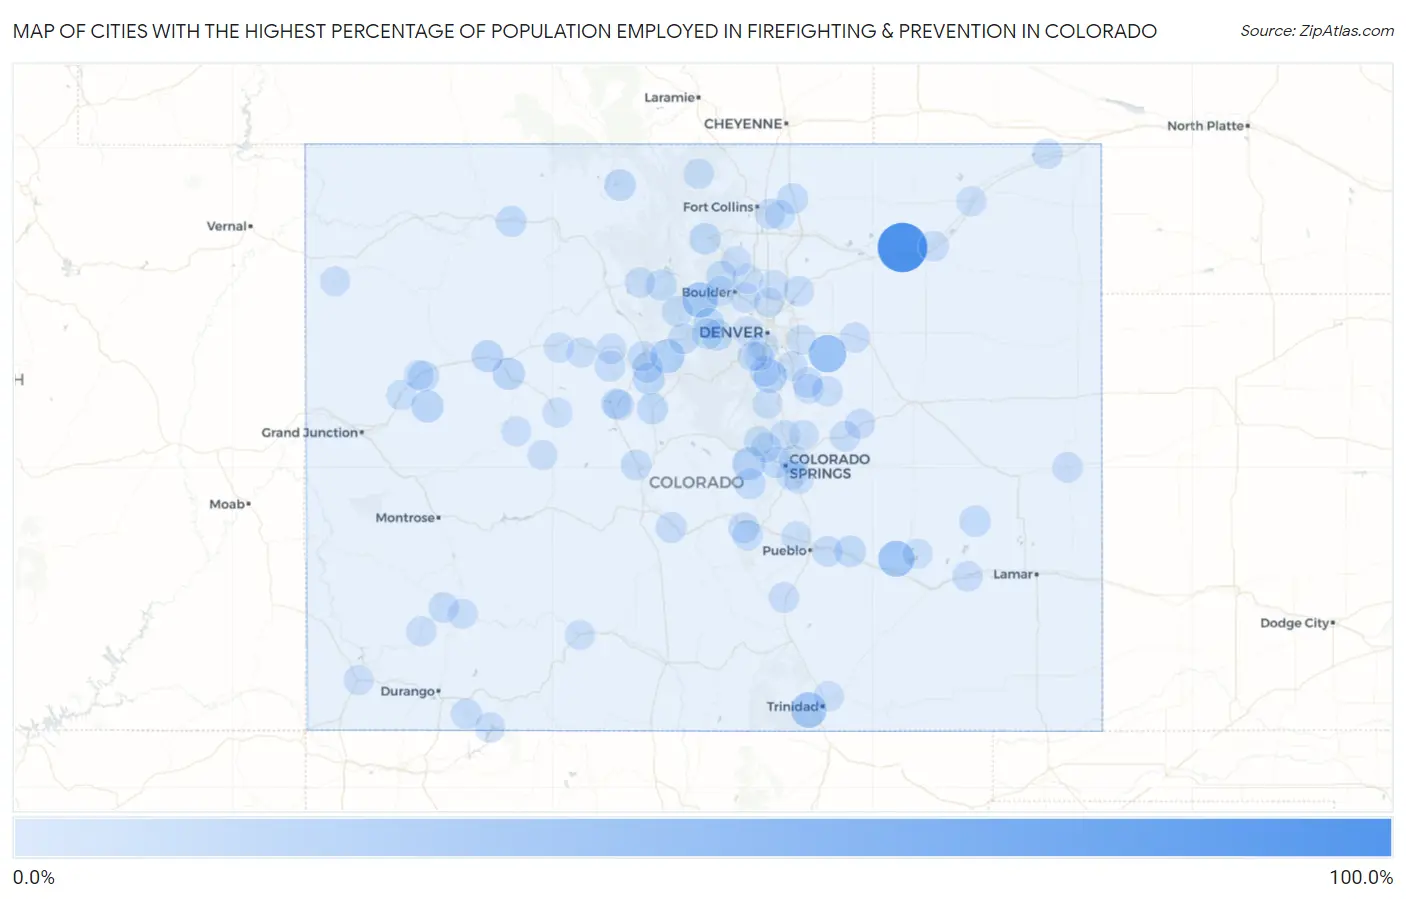
Map of Cities with the Highest Percentage of Population Employed in Firefighting & Prevention in Colorado
0.0%
100.0%
Cities with the Highest Percentage of Population Employed in Firefighting & Prevention in Colorado
| City | % Employed | vs State | vs National | |
| 1. | Saddle Ridge | 93.3% | 1.2%(+92.1)#1 | 1.2%(+92.1)#6 |
| 2. | Brick Center | 35.2% | 1.2%(+34.0)#2 | 1.2%(+34.0)#42 |
| 3. | Crowley | 28.6% | 1.2%(+27.4)#3 | 1.2%(+27.4)#57 |
| 4. | Cokedale | 25.8% | 1.2%(+24.6)#4 | 1.2%(+24.6)#70 |
| 5. | Eldora | 24.6% | 1.2%(+23.5)#5 | 1.2%(+23.5)#82 |
| 6. | Twin Lakes Cdp Lake County | 24.2% | 1.2%(+23.0)#6 | 1.2%(+23.0)#84 |
| 7. | Montezuma | 18.6% | 1.2%(+17.5)#7 | 1.2%(+17.5)#131 |
| 8. | Sedalia | 15.8% | 1.2%(+14.6)#8 | 1.2%(+14.6)#183 |
| 9. | Midland | 14.9% | 1.2%(+13.7)#9 | 1.2%(+13.7)#207 |
| 10. | Collbran | 11.8% | 1.2%(+10.7)#10 | 1.2%(+10.7)#315 |
| 11. | Cattle Creek | 11.0% | 1.2%(+9.77)#11 | 1.2%(+9.77)#372 |
| 12. | Chacra | 10.4% | 1.2%(+9.20)#12 | 1.2%(+9.20)#398 |
| 13. | Blue River | 9.9% | 1.2%(+8.70)#13 | 1.2%(+8.71)#426 |
| 14. | Walden | 8.6% | 1.2%(+7.39)#14 | 1.2%(+7.39)#545 |
| 15. | Fairplay | 7.5% | 1.2%(+6.28)#15 | 1.2%(+6.28)#683 |
| 16. | Pine Valley | 7.4% | 1.2%(+6.22)#16 | 1.2%(+6.22)#693 |
| 17. | Boone | 7.4% | 1.2%(+6.22)#17 | 1.2%(+6.22)#694 |
| 18. | Estes Park | 7.3% | 1.2%(+6.10)#18 | 1.2%(+6.10)#709 |
| 19. | Upper Witter Gulch | 7.1% | 1.2%(+5.94)#19 | 1.2%(+5.94)#740 |
| 20. | Haswell | 6.7% | 1.2%(+5.48)#20 | 1.2%(+5.48)#827 |
| 21. | Floyd Hill | 6.2% | 1.2%(+5.04)#21 | 1.2%(+5.04)#904 |
| 22. | Victor | 6.1% | 1.2%(+4.91)#22 | 1.2%(+4.91)#925 |
| 23. | Manitou Springs | 6.0% | 1.2%(+4.83)#23 | 1.2%(+4.84)#951 |
| 24. | Hayden | 5.9% | 1.2%(+4.67)#24 | 1.2%(+4.67)#1,002 |
| 25. | Pierce | 5.7% | 1.2%(+4.55)#25 | 1.2%(+4.55)#1,030 |
| 26. | Granby | 5.7% | 1.2%(+4.46)#26 | 1.2%(+4.47)#1,054 |
| 27. | Black Hawk | 5.6% | 1.2%(+4.37)#27 | 1.2%(+4.37)#1,086 |
| 28. | Battlement Mesa | 5.5% | 1.2%(+4.30)#28 | 1.2%(+4.30)#1,104 |
| 29. | Breckenridge | 5.4% | 1.2%(+4.18)#29 | 1.2%(+4.18)#1,142 |
| 30. | Winter Park | 5.2% | 1.2%(+4.05)#30 | 1.2%(+4.05)#1,193 |
| 31. | Howard | 5.2% | 1.2%(+4.00)#31 | 1.2%(+4.00)#1,205 |
| 32. | Idaho Springs | 4.8% | 1.2%(+3.65)#32 | 1.2%(+3.66)#1,335 |
| 33. | Ignacio | 4.7% | 1.2%(+3.53)#33 | 1.2%(+3.53)#1,397 |
| 34. | Vineland | 4.7% | 1.2%(+3.47)#34 | 1.2%(+3.48)#1,415 |
| 35. | Brookside | 4.6% | 1.2%(+3.40)#35 | 1.2%(+3.40)#1,451 |
| 36. | Buena Vista | 4.5% | 1.2%(+3.36)#36 | 1.2%(+3.36)#1,468 |
| 37. | Red Cliff | 4.4% | 1.2%(+3.21)#37 | 1.2%(+3.21)#1,561 |
| 38. | Silver Plume | 4.4% | 1.2%(+3.21)#38 | 1.2%(+3.21)#1,563 |
| 39. | Calhan | 4.3% | 1.2%(+3.08)#39 | 1.2%(+3.08)#1,635 |
| 40. | Louviers | 4.2% | 1.2%(+2.98)#40 | 1.2%(+2.98)#1,685 |
| 41. | Jamestown | 4.1% | 1.2%(+2.96)#41 | 1.2%(+2.96)#1,702 |
| 42. | Leadville | 4.0% | 1.2%(+2.81)#42 | 1.2%(+2.81)#1,802 |
| 43. | Ophir | 4.0% | 1.2%(+2.78)#43 | 1.2%(+2.78)#1,817 |
| 44. | Rockvale | 3.9% | 1.2%(+2.73)#44 | 1.2%(+2.74)#1,835 |
| 45. | Hillrose | 3.8% | 1.2%(+2.66)#45 | 1.2%(+2.66)#1,891 |
| 46. | Colorado City | 3.8% | 1.2%(+2.64)#46 | 1.2%(+2.64)#1,908 |
| 47. | Cheyenne Wells | 3.8% | 1.2%(+2.57)#47 | 1.2%(+2.57)#1,958 |
| 48. | Las Animas | 3.7% | 1.2%(+2.54)#48 | 1.2%(+2.54)#1,988 |
| 49. | Vail | 3.6% | 1.2%(+2.37)#49 | 1.2%(+2.37)#2,156 |
| 50. | Kiowa | 3.0% | 1.2%(+1.80)#50 | 1.2%(+1.80)#2,794 |
| 51. | Ponderosa Park | 2.9% | 1.2%(+1.76)#51 | 1.2%(+1.76)#2,855 |
| 52. | Ramah | 2.9% | 1.2%(+1.75)#52 | 1.2%(+1.76)#2,871 |
| 53. | Lochbuie | 2.8% | 1.2%(+1.60)#53 | 1.2%(+1.61)#3,051 |
| 54. | Paragon Estates | 2.8% | 1.2%(+1.59)#54 | 1.2%(+1.59)#3,074 |
| 55. | Leadville North | 2.7% | 1.2%(+1.52)#55 | 1.2%(+1.53)#3,174 |
| 56. | De Beque | 2.6% | 1.2%(+1.45)#56 | 1.2%(+1.46)#3,277 |
| 57. | Hot Sulphur Springs | 2.6% | 1.2%(+1.44)#57 | 1.2%(+1.45)#3,293 |
| 58. | Timnath | 2.5% | 1.2%(+1.35)#58 | 1.2%(+1.35)#3,478 |
| 59. | Red Feather Lakes | 2.5% | 1.2%(+1.35)#59 | 1.2%(+1.35)#3,479 |
| 60. | Arboles | 2.5% | 1.2%(+1.31)#60 | 1.2%(+1.31)#3,562 |
| 61. | Frisco | 2.5% | 1.2%(+1.28)#61 | 1.2%(+1.29)#3,612 |
| 62. | Sedgwick | 2.4% | 1.2%(+1.22)#62 | 1.2%(+1.22)#3,738 |
| 63. | Byers | 2.4% | 1.2%(+1.17)#63 | 1.2%(+1.18)#3,837 |
| 64. | Gleneagle | 2.2% | 1.2%(+1.05)#64 | 1.2%(+1.06)#4,104 |
| 65. | Rico | 2.2% | 1.2%(+1.02)#65 | 1.2%(+1.03)#4,169 |
| 66. | Niwot | 2.2% | 1.2%(+1.02)#66 | 1.2%(+1.03)#4,176 |
| 67. | Cortez | 2.2% | 1.2%(+0.979)#67 | 1.2%(+0.983)#4,267 |
| 68. | Sierra Ridge | 2.2% | 1.2%(+0.969)#68 | 1.2%(+0.974)#4,292 |
| 69. | Sugarloaf | 2.1% | 1.2%(+0.953)#69 | 1.2%(+0.957)#4,343 |
| 70. | Eagle | 2.1% | 1.2%(+0.911)#70 | 1.2%(+0.915)#4,447 |
| 71. | Cascade Chipita Park | 2.1% | 1.2%(+0.889)#71 | 1.2%(+0.894)#4,502 |
| 72. | Sugar City | 2.1% | 1.2%(+0.869)#72 | 1.2%(+0.873)#4,556 |
| 73. | Sterling | 2.0% | 1.2%(+0.827)#73 | 1.2%(+0.831)#4,677 |
| 74. | Lyons | 2.0% | 1.2%(+0.777)#74 | 1.2%(+0.781)#4,850 |
| 75. | Severance | 1.9% | 1.2%(+0.743)#75 | 1.2%(+0.747)#4,948 |
| 76. | Marble | 1.9% | 1.2%(+0.733)#76 | 1.2%(+0.737)#4,975 |
| 77. | Dacono | 1.9% | 1.2%(+0.733)#77 | 1.2%(+0.737)#4,979 |
| 78. | Parker | 1.9% | 1.2%(+0.725)#78 | 1.2%(+0.729)#5,003 |
| 79. | Pueblo West | 1.9% | 1.2%(+0.688)#79 | 1.2%(+0.692)#5,127 |
| 80. | Elizabeth | 1.9% | 1.2%(+0.684)#80 | 1.2%(+0.688)#5,138 |
| 81. | Stratmoor | 1.9% | 1.2%(+0.677)#81 | 1.2%(+0.681)#5,155 |
| 82. | Edwards | 1.8% | 1.2%(+0.651)#82 | 1.2%(+0.655)#5,252 |
| 83. | El Moro | 1.8% | 1.2%(+0.651)#83 | 1.2%(+0.655)#5,257 |
| 84. | South Fork | 1.8% | 1.2%(+0.628)#84 | 1.2%(+0.632)#5,332 |
| 85. | Security Widefield | 1.8% | 1.2%(+0.626)#85 | 1.2%(+0.630)#5,340 |
| 86. | Black Forest | 1.8% | 1.2%(+0.596)#86 | 1.2%(+0.600)#5,436 |
| 87. | Woodland Park | 1.7% | 1.2%(+0.560)#87 | 1.2%(+0.564)#5,567 |
| 88. | Applewood | 1.7% | 1.2%(+0.533)#88 | 1.2%(+0.537)#5,658 |
| 89. | Silverton | 1.7% | 1.2%(+0.515)#89 | 1.2%(+0.519)#5,722 |
| 90. | Mount Crested Butte | 1.7% | 1.2%(+0.505)#90 | 1.2%(+0.509)#5,760 |
| 91. | Sheridan | 1.7% | 1.2%(+0.496)#91 | 1.2%(+0.500)#5,800 |
| 92. | Perry Park | 1.7% | 1.2%(+0.475)#92 | 1.2%(+0.479)#5,885 |
| 93. | Columbine | 1.6% | 1.2%(+0.448)#93 | 1.2%(+0.453)#5,978 |
| 94. | Parachute | 1.6% | 1.2%(+0.428)#94 | 1.2%(+0.432)#6,050 |
| 95. | Aspen | 1.6% | 1.2%(+0.425)#95 | 1.2%(+0.429)#6,064 |
| 96. | Aurora | 1.6% | 1.2%(+0.398)#96 | 1.2%(+0.402)#6,163 |
| 97. | Northglenn | 1.6% | 1.2%(+0.391)#97 | 1.2%(+0.395)#6,196 |
| 98. | Colorado Springs | 1.6% | 1.2%(+0.378)#98 | 1.2%(+0.382)#6,249 |
| 99. | Rangely | 1.6% | 1.2%(+0.377)#99 | 1.2%(+0.381)#6,256 |
| 100. | Ken Caryl | 1.6% | 1.2%(+0.371)#100 | 1.2%(+0.375)#6,292 |
Common Questions
What are the Top 10 Cities with the Highest Percentage of Population Employed in Firefighting & Prevention in Colorado?
Top 10 Cities with the Highest Percentage of Population Employed in Firefighting & Prevention in Colorado are:
#1
93.3%
#2
35.2%
#3
28.6%
#4
25.8%
#5
24.6%
#6
18.6%
#7
15.8%
#8
14.9%
#9
11.8%
#10
11.0%
What city has the Highest Percentage of Population Employed in Firefighting & Prevention in Colorado?
Saddle Ridge has the Highest Percentage of Population Employed in Firefighting & Prevention in Colorado with 93.3%.
What is the Percentage of Population Employed in Firefighting & Prevention in the State of Colorado?
Percentage of Population Employed in Firefighting & Prevention in Colorado is 1.2%.
What is the Percentage of Population Employed in Firefighting & Prevention in the United States?
Percentage of Population Employed in Firefighting & Prevention in the United States is 1.2%.