Cities with the Highest Percentage of Population Employed in Firefighting & Prevention in South Dakota
RELATED REPORTS & OPTIONS
Firefighting & Prevention
South Dakota
Compare Cities
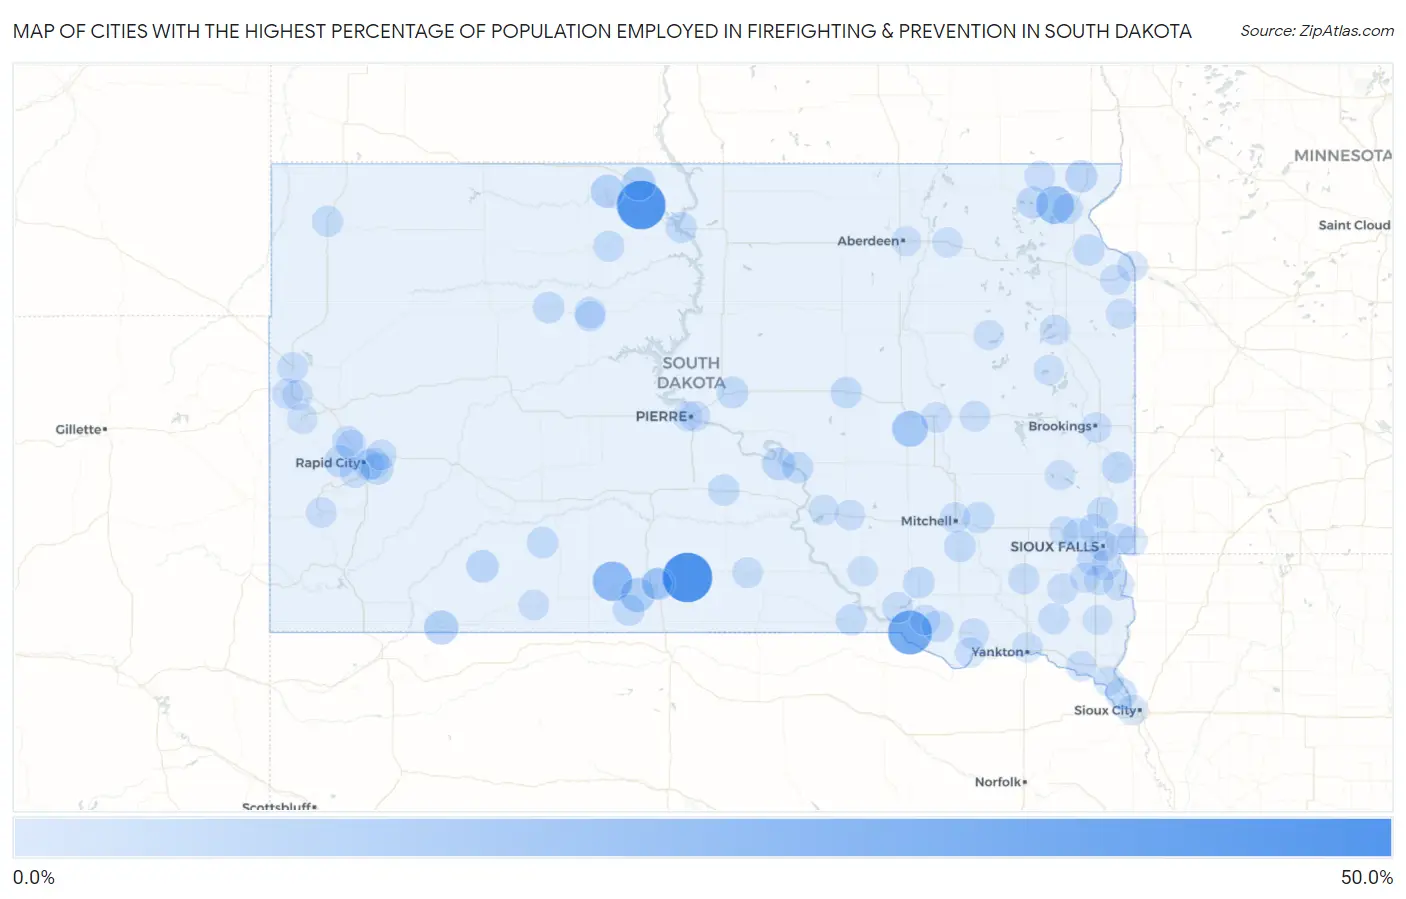
Map of Cities with the Highest Percentage of Population Employed in Firefighting & Prevention in South Dakota
0.0%
50.0%
Cities with the Highest Percentage of Population Employed in Firefighting & Prevention in South Dakota
| City | % Employed | vs State | vs National | |
| 1. | Okreek | 44.0% | 0.79%(+43.2)#1 | 1.2%(+42.8)#23 |
| 2. | Little Eagle | 41.7% | 0.79%(+40.9)#2 | 1.2%(+40.5)#29 |
| 3. | Marty | 31.0% | 0.79%(+30.2)#3 | 1.2%(+29.8)#51 |
| 4. | Parmelee | 20.6% | 0.79%(+19.8)#4 | 1.2%(+19.4)#107 |
| 5. | Long Hollow | 16.7% | 0.79%(+15.9)#5 | 1.2%(+15.5)#160 |
| 6. | Virgil | 12.5% | 0.79%(+11.7)#6 | 1.2%(+11.3)#297 |
| 7. | Rosebud | 8.9% | 0.79%(+8.16)#7 | 1.2%(+7.76)#513 |
| 8. | Pine Ridge | 8.5% | 0.79%(+7.74)#8 | 1.2%(+7.34)#556 |
| 9. | Mclaughlin | 7.3% | 0.79%(+6.53)#9 | 1.2%(+6.13)#707 |
| 10. | Bullhead | 7.0% | 0.79%(+6.19)#10 | 1.2%(+5.79)#766 |
| 11. | Antelope | 5.4% | 0.79%(+4.57)#11 | 1.2%(+4.17)#1,144 |
| 12. | Lower Brule | 5.3% | 0.79%(+4.50)#12 | 1.2%(+4.10)#1,173 |
| 13. | Kyle | 4.9% | 0.79%(+4.15)#13 | 1.2%(+3.75)#1,297 |
| 14. | New Effington | 4.7% | 0.79%(+3.92)#14 | 1.2%(+3.52)#1,402 |
| 15. | Clear Lake | 4.2% | 0.79%(+3.38)#15 | 1.2%(+2.98)#1,689 |
| 16. | Johnson Siding | 3.7% | 0.79%(+2.96)#16 | 1.2%(+2.56)#1,965 |
| 17. | Green Valley | 3.5% | 0.79%(+2.72)#17 | 1.2%(+2.32)#2,197 |
| 18. | Flandreau | 3.5% | 0.79%(+2.69)#18 | 1.2%(+2.29)#2,224 |
| 19. | Rapid Valley | 3.4% | 0.79%(+2.64)#19 | 1.2%(+2.24)#2,275 |
| 20. | Blunt | 3.4% | 0.79%(+2.63)#20 | 1.2%(+2.23)#2,292 |
| 21. | Dupree | 3.1% | 0.79%(+2.36)#21 | 1.2%(+1.96)#2,591 |
| 22. | Dante | 3.1% | 0.79%(+2.29)#22 | 1.2%(+1.89)#2,668 |
| 23. | Ethan | 3.0% | 0.79%(+2.26)#23 | 1.2%(+1.86)#2,700 |
| 24. | St Francis | 3.0% | 0.79%(+2.23)#24 | 1.2%(+1.83)#2,741 |
| 25. | Wanblee | 3.0% | 0.79%(+2.21)#25 | 1.2%(+1.81)#2,771 |
| 26. | Armour | 3.0% | 0.79%(+2.21)#26 | 1.2%(+1.81)#2,772 |
| 27. | Fort Thompson | 3.0% | 0.79%(+2.18)#27 | 1.2%(+1.78)#2,836 |
| 28. | Jefferson | 2.9% | 0.79%(+2.16)#28 | 1.2%(+1.76)#2,866 |
| 29. | Wakpala | 2.9% | 0.79%(+2.07)#29 | 1.2%(+1.67)#2,967 |
| 30. | Miller | 2.8% | 0.79%(+2.00)#30 | 1.2%(+1.60)#3,069 |
| 31. | Wilmot | 2.8% | 0.79%(+1.98)#31 | 1.2%(+1.58)#3,097 |
| 32. | Hartford | 2.7% | 0.79%(+1.91)#32 | 1.2%(+1.51)#3,200 |
| 33. | Presho | 2.6% | 0.79%(+1.77)#33 | 1.2%(+1.37)#3,446 |
| 34. | Fulton | 2.5% | 0.79%(+1.71)#34 | 1.2%(+1.31)#3,566 |
| 35. | Buffalo | 2.5% | 0.79%(+1.66)#35 | 1.2%(+1.27)#3,654 |
| 36. | Baltic | 2.3% | 0.79%(+1.54)#36 | 1.2%(+1.14)#3,898 |
| 37. | Bonesteel | 2.2% | 0.79%(+1.46)#37 | 1.2%(+1.06)#4,094 |
| 38. | Timber Lake | 2.1% | 0.79%(+1.30)#38 | 1.2%(+0.905)#4,467 |
| 39. | North Eagle Butte | 2.0% | 0.79%(+1.25)#39 | 1.2%(+0.855)#4,605 |
| 40. | Mobridge | 2.0% | 0.79%(+1.22)#40 | 1.2%(+0.822)#4,707 |
| 41. | Lake Andes | 2.0% | 0.79%(+1.21)#41 | 1.2%(+0.814)#4,733 |
| 42. | Piedmont | 2.0% | 0.79%(+1.18)#42 | 1.2%(+0.782)#4,849 |
| 43. | Canton | 2.0% | 0.79%(+1.16)#43 | 1.2%(+0.765)#4,889 |
| 44. | Irene | 1.9% | 0.79%(+1.08)#44 | 1.2%(+0.680)#5,163 |
| 45. | Freeman | 1.8% | 0.79%(+0.989)#45 | 1.2%(+0.589)#5,475 |
| 46. | Tea | 1.8% | 0.79%(+0.975)#46 | 1.2%(+0.576)#5,522 |
| 47. | Mission | 1.7% | 0.79%(+0.918)#47 | 1.2%(+0.519)#5,719 |
| 48. | Rapid City | 1.5% | 0.79%(+0.732)#48 | 1.2%(+0.332)#6,475 |
| 49. | Iroquois | 1.4% | 0.79%(+0.629)#49 | 1.2%(+0.229)#6,924 |
| 50. | Winner | 1.4% | 0.79%(+0.602)#50 | 1.2%(+0.202)#7,045 |
| 51. | Sisseton | 1.3% | 0.79%(+0.563)#51 | 1.2%(+0.163)#7,275 |
| 52. | Box Elder | 1.3% | 0.79%(+0.553)#52 | 1.2%(+0.153)#7,337 |
| 53. | Belle Fourche | 1.3% | 0.79%(+0.548)#53 | 1.2%(+0.148)#7,358 |
| 54. | Custer | 1.2% | 0.79%(+0.428)#54 | 1.2%(+0.028)#8,053 |
| 55. | Revillo | 1.2% | 0.79%(+0.419)#55 | 1.2%(+0.019)#8,115 |
| 56. | Hurley | 1.2% | 0.79%(+0.404)#56 | 1.2%(+0.005)#8,212 |
| 57. | Colonial Pine Hills | 1.2% | 0.79%(+0.399)#57 | 1.2%(-0.000)#8,242 |
| 58. | Veblen | 1.2% | 0.79%(+0.383)#58 | 1.2%(-0.016)#8,336 |
| 59. | Tyndall | 1.1% | 0.79%(+0.363)#59 | 1.2%(-0.036)#8,449 |
| 60. | Pierre | 1.1% | 0.79%(+0.309)#60 | 1.2%(-0.091)#8,804 |
| 61. | Dakota Dunes | 1.1% | 0.79%(+0.284)#61 | 1.2%(-0.116)#8,964 |
| 62. | Huron | 1.1% | 0.79%(+0.283)#62 | 1.2%(-0.117)#8,972 |
| 63. | North Spearfish | 1.00% | 0.79%(+0.212)#63 | 1.2%(-0.188)#9,410 |
| 64. | Vermillion | 0.99% | 0.79%(+0.208)#64 | 1.2%(-0.192)#9,440 |
| 65. | Martin | 0.98% | 0.79%(+0.192)#65 | 1.2%(-0.208)#9,557 |
| 66. | Eagle Butte | 0.93% | 0.79%(+0.144)#66 | 1.2%(-0.256)#9,911 |
| 67. | Brandon | 0.92% | 0.79%(+0.132)#67 | 1.2%(-0.267)#9,992 |
| 68. | Harrisburg | 0.86% | 0.79%(+0.078)#68 | 1.2%(-0.322)#10,351 |
| 69. | Big Stone City | 0.86% | 0.79%(+0.073)#69 | 1.2%(-0.326)#10,388 |
| 70. | Watertown | 0.83% | 0.79%(+0.048)#70 | 1.2%(-0.352)#10,572 |
| 71. | Wagner | 0.80% | 0.79%(+0.015)#71 | 1.2%(-0.385)#10,798 |
| 72. | Summerset | 0.77% | 0.79%(-0.016)#72 | 1.2%(-0.416)#11,024 |
| 73. | Spearfish | 0.76% | 0.79%(-0.027)#73 | 1.2%(-0.426)#11,110 |
| 74. | Mitchell | 0.74% | 0.79%(-0.045)#74 | 1.2%(-0.445)#11,227 |
| 75. | Sioux Falls | 0.72% | 0.79%(-0.064)#75 | 1.2%(-0.464)#11,367 |
| 76. | Milbank | 0.66% | 0.79%(-0.128)#76 | 1.2%(-0.527)#11,882 |
| 77. | Kimball | 0.65% | 0.79%(-0.135)#77 | 1.2%(-0.534)#11,933 |
| 78. | Brookings | 0.62% | 0.79%(-0.170)#78 | 1.2%(-0.570)#12,184 |
| 79. | Springfield | 0.55% | 0.79%(-0.234)#79 | 1.2%(-0.633)#12,638 |
| 80. | Pukwana | 0.55% | 0.79%(-0.237)#80 | 1.2%(-0.636)#12,665 |
| 81. | Clark | 0.54% | 0.79%(-0.242)#81 | 1.2%(-0.641)#12,697 |
| 82. | Lead | 0.54% | 0.79%(-0.246)#82 | 1.2%(-0.646)#12,731 |
| 83. | Fort Pierre | 0.47% | 0.79%(-0.316)#83 | 1.2%(-0.715)#13,232 |
| 84. | Hayti | 0.43% | 0.79%(-0.353)#84 | 1.2%(-0.753)#13,465 |
| 85. | Platte | 0.43% | 0.79%(-0.354)#85 | 1.2%(-0.754)#13,473 |
| 86. | Crooks | 0.42% | 0.79%(-0.367)#86 | 1.2%(-0.767)#13,563 |
| 87. | Lennox | 0.39% | 0.79%(-0.393)#87 | 1.2%(-0.792)#13,738 |
| 88. | Worthing | 0.39% | 0.79%(-0.393)#88 | 1.2%(-0.793)#13,743 |
| 89. | Aberdeen | 0.37% | 0.79%(-0.411)#89 | 1.2%(-0.811)#13,876 |
| 90. | Groton | 0.34% | 0.79%(-0.451)#90 | 1.2%(-0.851)#14,115 |
| 91. | Valley Springs | 0.32% | 0.79%(-0.464)#91 | 1.2%(-0.863)#14,170 |
| 92. | Humboldt | 0.29% | 0.79%(-0.500)#92 | 1.2%(-0.900)#14,347 |
| 93. | Elk Point | 0.28% | 0.79%(-0.505)#93 | 1.2%(-0.905)#14,371 |
| 94. | Madison | 0.28% | 0.79%(-0.505)#94 | 1.2%(-0.905)#14,378 |
| 95. | Beresford | 0.24% | 0.79%(-0.546)#95 | 1.2%(-0.946)#14,578 |
| 96. | Yankton | 0.18% | 0.79%(-0.606)#96 | 1.2%(-1.01)#14,779 |
Common Questions
What are the Top 10 Cities with the Highest Percentage of Population Employed in Firefighting & Prevention in South Dakota?
Top 10 Cities with the Highest Percentage of Population Employed in Firefighting & Prevention in South Dakota are:
#1
44.0%
#2
41.7%
#3
31.0%
#4
20.6%
#5
16.7%
#6
12.5%
#7
8.9%
#8
8.5%
#9
7.3%
#10
7.0%
What city has the Highest Percentage of Population Employed in Firefighting & Prevention in South Dakota?
Okreek has the Highest Percentage of Population Employed in Firefighting & Prevention in South Dakota with 44.0%.
What is the Percentage of Population Employed in Firefighting & Prevention in the State of South Dakota?
Percentage of Population Employed in Firefighting & Prevention in South Dakota is 0.79%.
What is the Percentage of Population Employed in Firefighting & Prevention in the United States?
Percentage of Population Employed in Firefighting & Prevention in the United States is 1.2%.