Cities with the Highest Percentage of Population Employed in Firefighting & Prevention in Texas
RELATED REPORTS & OPTIONS
Firefighting & Prevention
Texas
Compare Cities
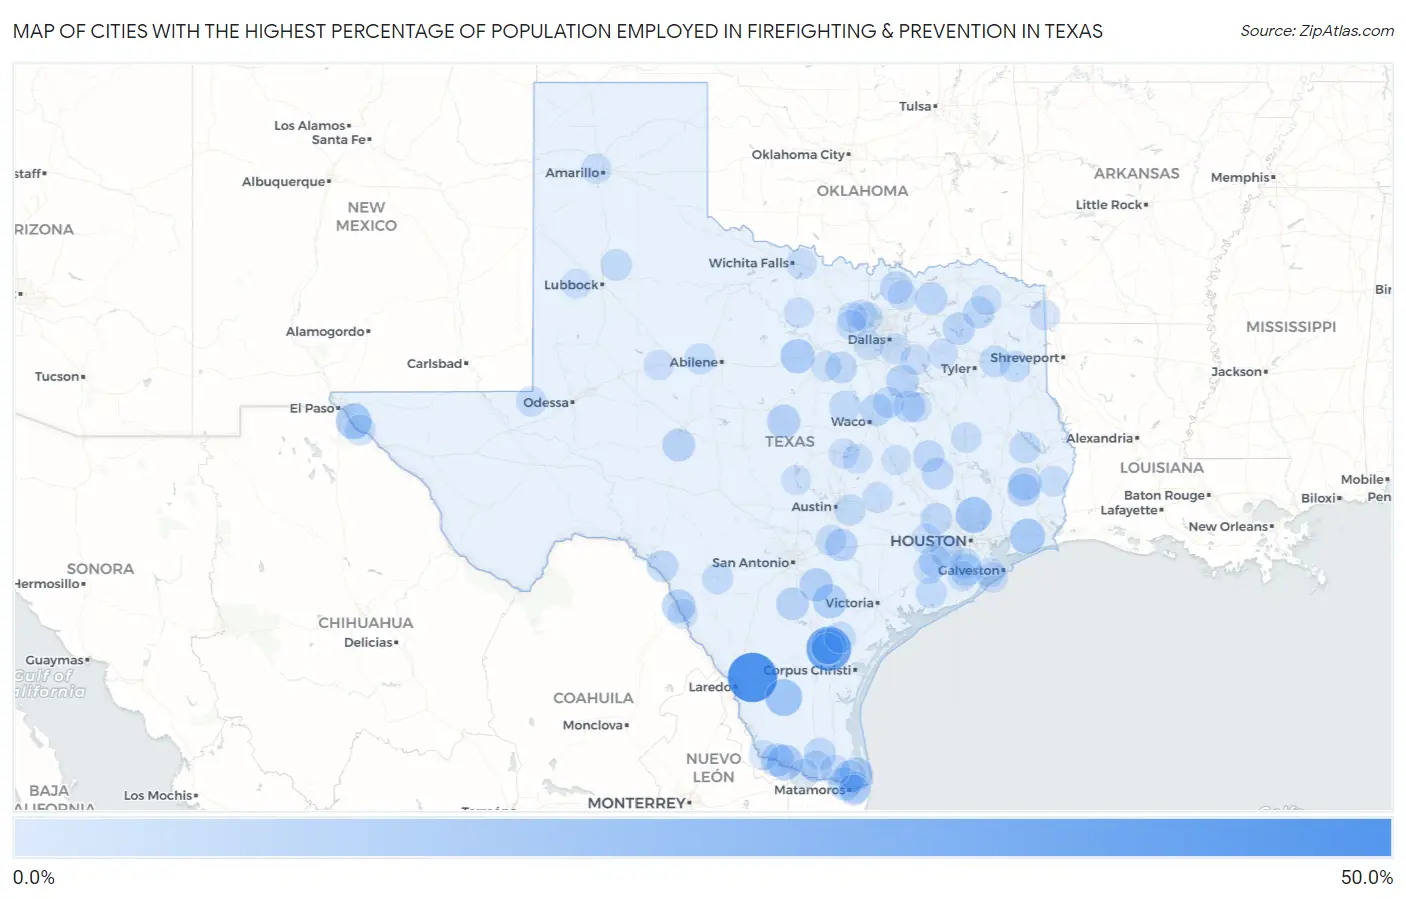
Map of Cities with the Highest Percentage of Population Employed in Firefighting & Prevention in Texas
0.0%
50.0%
Cities with the Highest Percentage of Population Employed in Firefighting & Prevention in Texas
| City | % Employed | vs State | vs National | |
| 1. | Colorado Acres | 50.0% | 1.1%(+48.9)#1 | 1.2%(+48.8)#17 |
| 2. | Edgewater Estates | 38.1% | 1.1%(+37.0)#2 | 1.2%(+36.9)#35 |
| 3. | Sunrise Shores | 35.4% | 1.1%(+34.2)#3 | 1.2%(+34.2)#41 |
| 4. | Las Lomitas | 19.4% | 1.1%(+18.2)#4 | 1.2%(+18.2)#122 |
| 5. | Lakeshore Gardens Hidden Acres | 17.6% | 1.1%(+16.5)#5 | 1.2%(+16.4)#142 |
| 6. | Porter Heights | 17.5% | 1.1%(+16.4)#6 | 1.2%(+16.3)#145 |
| 7. | Morning Glory | 16.8% | 1.1%(+15.7)#7 | 1.2%(+15.7)#157 |
| 8. | Allison | 16.3% | 1.1%(+15.2)#8 | 1.2%(+15.1)#168 |
| 9. | E Lopez | 16.2% | 1.1%(+15.1)#9 | 1.2%(+15.0)#173 |
| 10. | Winnie | 15.3% | 1.1%(+14.2)#10 | 1.2%(+14.1)#196 |
| 11. | Mingus | 13.6% | 1.1%(+12.4)#11 | 1.2%(+12.4)#252 |
| 12. | Kenedy | 12.7% | 1.1%(+11.6)#12 | 1.2%(+11.5)#284 |
| 13. | Seco Mines | 11.7% | 1.1%(+10.6)#13 | 1.2%(+10.6)#326 |
| 14. | Poth | 11.5% | 1.1%(+10.4)#14 | 1.2%(+10.3)#339 |
| 15. | Mullin | 11.3% | 1.1%(+10.2)#15 | 1.2%(+10.1)#351 |
| 16. | Santa Rosa | 11.1% | 1.1%(+9.93)#16 | 1.2%(+9.87)#368 |
| 17. | Bayview | 10.7% | 1.1%(+9.62)#17 | 1.2%(+9.56)#377 |
| 18. | Kopperl | 10.6% | 1.1%(+9.51)#18 | 1.2%(+9.45)#387 |
| 19. | Warren | 10.5% | 1.1%(+9.40)#19 | 1.2%(+9.34)#390 |
| 20. | San Pedro | 10.3% | 1.1%(+9.16)#20 | 1.2%(+9.10)#402 |
| 21. | Emhouse | 10.3% | 1.1%(+9.13)#21 | 1.2%(+9.07)#405 |
| 22. | Wildwood | 10.2% | 1.1%(+9.11)#22 | 1.2%(+9.05)#407 |
| 23. | Christine | 10.0% | 1.1%(+8.87)#23 | 1.2%(+8.81)#416 |
| 24. | Christoval | 9.9% | 1.1%(+8.77)#24 | 1.2%(+8.72)#425 |
| 25. | Wolfe City | 9.6% | 1.1%(+8.49)#25 | 1.2%(+8.43)#449 |
| 26. | Yantis | 9.4% | 1.1%(+8.28)#26 | 1.2%(+8.23)#463 |
| 27. | Luling | 9.3% | 1.1%(+8.19)#27 | 1.2%(+8.13)#469 |
| 28. | Leroy | 9.2% | 1.1%(+8.08)#28 | 1.2%(+8.02)#481 |
| 29. | Bonney | 9.2% | 1.1%(+8.05)#29 | 1.2%(+7.99)#485 |
| 30. | Dorchester | 9.1% | 1.1%(+7.96)#30 | 1.2%(+7.91)#501 |
| 31. | Wortham | 8.7% | 1.1%(+7.57)#31 | 1.2%(+7.51)#535 |
| 32. | Kendleton | 8.5% | 1.1%(+7.38)#32 | 1.2%(+7.32)#558 |
| 33. | Cumings | 8.4% | 1.1%(+7.31)#33 | 1.2%(+7.25)#561 |
| 34. | Indian Lake | 8.2% | 1.1%(+7.04)#34 | 1.2%(+6.98)#595 |
| 35. | Prairie View | 8.1% | 1.1%(+6.96)#35 | 1.2%(+6.90)#611 |
| 36. | Hargill | 8.0% | 1.1%(+6.90)#36 | 1.2%(+6.84)#617 |
| 37. | Mount Vernon | 7.9% | 1.1%(+6.81)#37 | 1.2%(+6.75)#627 |
| 38. | Southwest Sandhill | 7.9% | 1.1%(+6.78)#38 | 1.2%(+6.72)#633 |
| 39. | Bedias | 7.8% | 1.1%(+6.64)#39 | 1.2%(+6.58)#650 |
| 40. | Normangee | 7.8% | 1.1%(+6.63)#40 | 1.2%(+6.58)#651 |
| 41. | Reid Hope King | 7.6% | 1.1%(+6.46)#41 | 1.2%(+6.40)#671 |
| 42. | Pecan Plantation | 7.5% | 1.1%(+6.41)#42 | 1.2%(+6.36)#675 |
| 43. | Laughlin Afb | 7.5% | 1.1%(+6.35)#43 | 1.2%(+6.29)#681 |
| 44. | Lingleville | 7.5% | 1.1%(+6.33)#44 | 1.2%(+6.28)#686 |
| 45. | Clifton | 7.4% | 1.1%(+6.27)#45 | 1.2%(+6.21)#696 |
| 46. | Muniz | 7.4% | 1.1%(+6.25)#46 | 1.2%(+6.20)#697 |
| 47. | Lake City | 7.4% | 1.1%(+6.23)#47 | 1.2%(+6.17)#699 |
| 48. | Zavalla | 7.2% | 1.1%(+6.11)#48 | 1.2%(+6.05)#718 |
| 49. | Petersburg | 7.1% | 1.1%(+6.01)#49 | 1.2%(+5.96)#734 |
| 50. | Hubbard | 7.0% | 1.1%(+5.88)#50 | 1.2%(+5.82)#760 |
| 51. | Webberville | 6.9% | 1.1%(+5.76)#51 | 1.2%(+5.70)#780 |
| 52. | Liberty City | 6.8% | 1.1%(+5.71)#52 | 1.2%(+5.66)#787 |
| 53. | Markham | 6.7% | 1.1%(+5.54)#53 | 1.2%(+5.48)#818 |
| 54. | Skidmore | 6.6% | 1.1%(+5.43)#54 | 1.2%(+5.37)#839 |
| 55. | Easton | 6.5% | 1.1%(+5.39)#55 | 1.2%(+5.34)#845 |
| 56. | Trent | 6.4% | 1.1%(+5.27)#56 | 1.2%(+5.21)#871 |
| 57. | Tornillo | 6.4% | 1.1%(+5.23)#57 | 1.2%(+5.18)#879 |
| 58. | Sandy Point | 6.1% | 1.1%(+4.97)#58 | 1.2%(+4.91)#926 |
| 59. | Villa Pancho | 6.1% | 1.1%(+4.96)#59 | 1.2%(+4.91)#927 |
| 60. | Uvalde Estates | 6.1% | 1.1%(+4.95)#60 | 1.2%(+4.89)#934 |
| 61. | Rice Tracts | 5.7% | 1.1%(+4.60)#61 | 1.2%(+4.54)#1,033 |
| 62. | Kirbyville | 5.5% | 1.1%(+4.36)#62 | 1.2%(+4.30)#1,105 |
| 63. | Salida Del Sol Estates | 5.5% | 1.1%(+4.36)#63 | 1.2%(+4.30)#1,106 |
| 64. | Staples | 5.5% | 1.1%(+4.35)#64 | 1.2%(+4.29)#1,109 |
| 65. | Jolly | 5.4% | 1.1%(+4.28)#65 | 1.2%(+4.22)#1,128 |
| 66. | Hutchins | 5.3% | 1.1%(+4.20)#66 | 1.2%(+4.14)#1,158 |
| 67. | Crockett | 5.3% | 1.1%(+4.15)#67 | 1.2%(+4.09)#1,176 |
| 68. | Dish | 5.3% | 1.1%(+4.13)#68 | 1.2%(+4.08)#1,180 |
| 69. | Kermit | 5.2% | 1.1%(+4.05)#69 | 1.2%(+3.99)#1,212 |
| 70. | Garner | 5.2% | 1.1%(+4.02)#70 | 1.2%(+3.96)#1,220 |
| 71. | Lexington | 5.1% | 1.1%(+4.00)#71 | 1.2%(+3.95)#1,223 |
| 72. | Wharton | 5.1% | 1.1%(+3.99)#72 | 1.2%(+3.94)#1,227 |
| 73. | Argyle | 5.1% | 1.1%(+3.94)#73 | 1.2%(+3.88)#1,249 |
| 74. | Jamaica Beach | 5.0% | 1.1%(+3.89)#74 | 1.2%(+3.83)#1,265 |
| 75. | Palm Valley | 5.0% | 1.1%(+3.89)#75 | 1.2%(+3.83)#1,266 |
| 76. | Bryson | 4.9% | 1.1%(+3.76)#76 | 1.2%(+3.70)#1,311 |
| 77. | Colorado City | 4.8% | 1.1%(+3.72)#77 | 1.2%(+3.66)#1,332 |
| 78. | Pecan Acres | 4.8% | 1.1%(+3.72)#78 | 1.2%(+3.66)#1,333 |
| 79. | Canton | 4.7% | 1.1%(+3.53)#79 | 1.2%(+3.47)#1,416 |
| 80. | New Fairview | 4.7% | 1.1%(+3.53)#80 | 1.2%(+3.47)#1,417 |
| 81. | Nolanville | 4.6% | 1.1%(+3.51)#81 | 1.2%(+3.45)#1,427 |
| 82. | Bishop Hills | 4.6% | 1.1%(+3.47)#82 | 1.2%(+3.41)#1,445 |
| 83. | Kirvin | 4.5% | 1.1%(+3.42)#83 | 1.2%(+3.36)#1,475 |
| 84. | Sealy | 4.5% | 1.1%(+3.41)#84 | 1.2%(+3.35)#1,481 |
| 85. | Holiday Lakes | 4.5% | 1.1%(+3.40)#85 | 1.2%(+3.34)#1,484 |
| 86. | Grays Prairie | 4.5% | 1.1%(+3.38)#86 | 1.2%(+3.32)#1,501 |
| 87. | Bloomburg | 4.4% | 1.1%(+3.28)#87 | 1.2%(+3.23)#1,548 |
| 88. | Talco | 4.4% | 1.1%(+3.27)#88 | 1.2%(+3.21)#1,560 |
| 89. | Little River Academy | 4.4% | 1.1%(+3.24)#89 | 1.2%(+3.19)#1,575 |
| 90. | Dalworthington Gardens | 4.4% | 1.1%(+3.24)#90 | 1.2%(+3.18)#1,577 |
| 91. | Rosita | 4.3% | 1.1%(+3.22)#91 | 1.2%(+3.16)#1,584 |
| 92. | Granjeno | 4.3% | 1.1%(+3.20)#92 | 1.2%(+3.14)#1,605 |
| 93. | Roma | 4.3% | 1.1%(+3.18)#93 | 1.2%(+3.12)#1,621 |
| 94. | Van Alstyne | 4.3% | 1.1%(+3.14)#94 | 1.2%(+3.08)#1,637 |
| 95. | Opdyke West | 4.2% | 1.1%(+3.08)#95 | 1.2%(+3.02)#1,665 |
| 96. | Tolar | 4.2% | 1.1%(+3.07)#96 | 1.2%(+3.02)#1,669 |
| 97. | Calvert | 4.1% | 1.1%(+2.96)#97 | 1.2%(+2.90)#1,733 |
| 98. | Dennis | 4.1% | 1.1%(+2.93)#98 | 1.2%(+2.87)#1,753 |
| 99. | Hitchcock | 4.0% | 1.1%(+2.89)#99 | 1.2%(+2.83)#1,785 |
| 100. | Kingsland | 4.0% | 1.1%(+2.85)#100 | 1.2%(+2.79)#1,810 |
Common Questions
What are the Top 10 Cities with the Highest Percentage of Population Employed in Firefighting & Prevention in Texas?
Top 10 Cities with the Highest Percentage of Population Employed in Firefighting & Prevention in Texas are:
#1
50.0%
#2
38.1%
#3
19.4%
#4
17.6%
#5
17.5%
#6
16.8%
#7
16.2%
#8
15.3%
#9
13.6%
#10
12.7%
What city has the Highest Percentage of Population Employed in Firefighting & Prevention in Texas?
Colorado Acres has the Highest Percentage of Population Employed in Firefighting & Prevention in Texas with 50.0%.
What is the Percentage of Population Employed in Firefighting & Prevention in the State of Texas?
Percentage of Population Employed in Firefighting & Prevention in Texas is 1.1%.
What is the Percentage of Population Employed in Firefighting & Prevention in the United States?
Percentage of Population Employed in Firefighting & Prevention in the United States is 1.2%.