Cities with the Highest Percentage of Population Employed in Firefighting & Prevention in Massachusetts
RELATED REPORTS & OPTIONS
Firefighting & Prevention
Massachusetts
Compare Cities
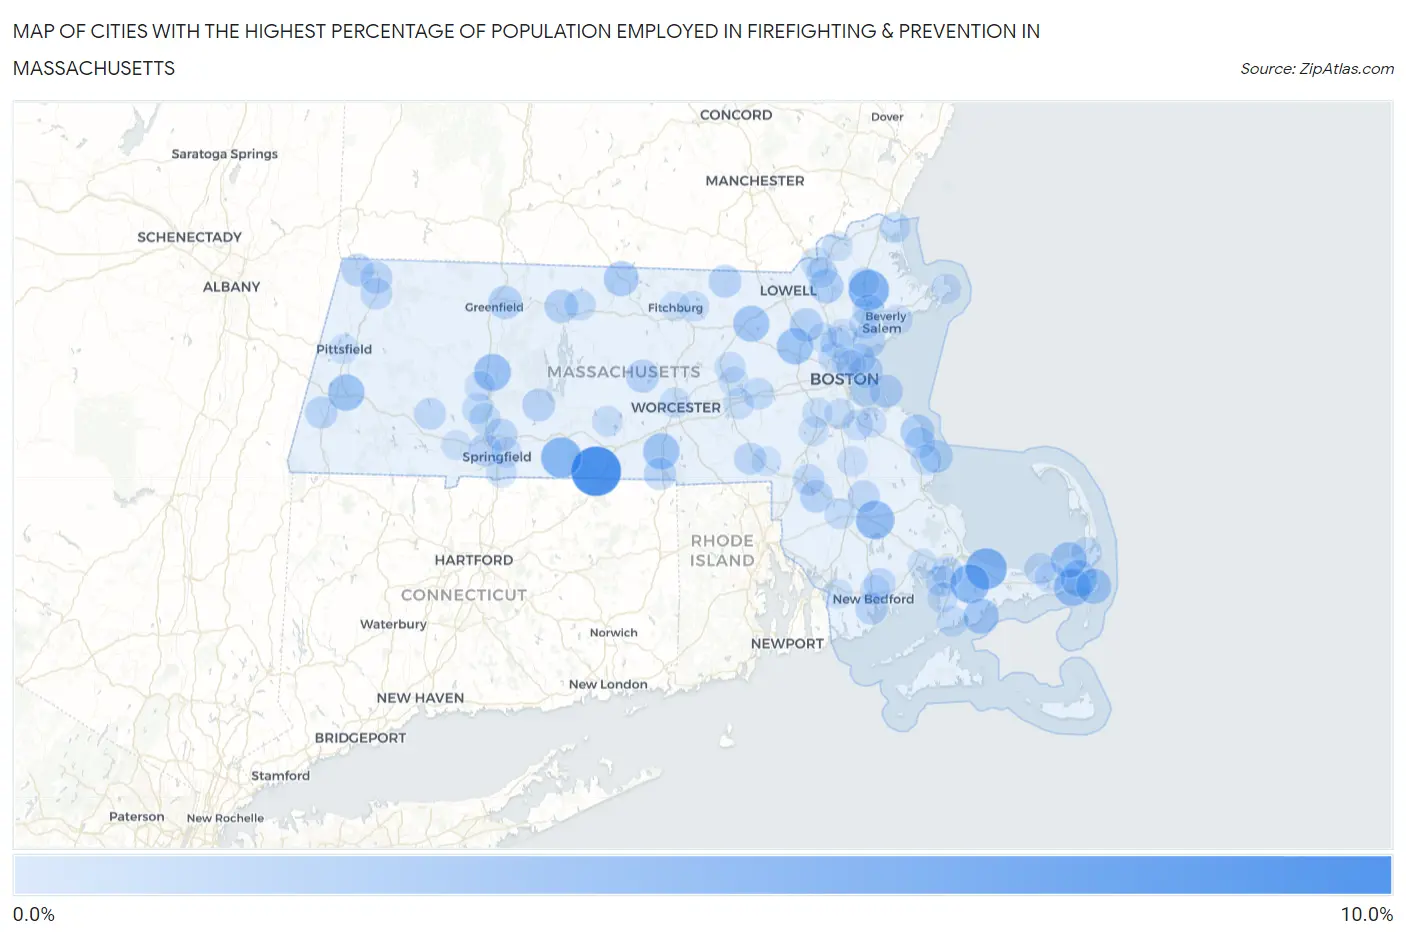
Map of Cities with the Highest Percentage of Population Employed in Firefighting & Prevention in Massachusetts
0.0%
10.0%
Cities with the Highest Percentage of Population Employed in Firefighting & Prevention in Massachusetts
| City | % Employed | vs State | vs National | |
| 1. | Oak Bluffs | 8.7% | 1.1%(+7.61)#1 | 1.2%(+7.56)#530 |
| 2. | Holland | 8.7% | 1.1%(+7.60)#2 | 1.2%(+7.55)#531 |
| 3. | East Sandwich | 5.3% | 1.1%(+4.21)#3 | 1.2%(+4.16)#1,148 |
| 4. | Topsfield | 5.1% | 1.1%(+4.00)#4 | 1.2%(+3.95)#1,222 |
| 5. | Monson Center | 5.1% | 1.1%(+3.93)#5 | 1.2%(+3.88)#1,252 |
| 6. | Forestdale | 4.5% | 1.1%(+3.39)#6 | 1.2%(+3.34)#1,488 |
| 7. | Middleborough Center | 4.3% | 1.1%(+3.19)#7 | 1.2%(+3.14)#1,606 |
| 8. | Cedar Crest | 4.1% | 1.1%(+2.99)#8 | 1.2%(+2.94)#1,710 |
| 9. | Harwich Port | 3.8% | 1.1%(+2.69)#9 | 1.2%(+2.64)#1,910 |
| 10. | Hatfield | 3.8% | 1.1%(+2.64)#10 | 1.2%(+2.59)#1,949 |
| 11. | East Harwich | 3.6% | 1.1%(+2.43)#11 | 1.2%(+2.38)#2,151 |
| 12. | Lee | 3.5% | 1.1%(+2.39)#12 | 1.2%(+2.35)#2,173 |
| 13. | Oxford | 3.5% | 1.1%(+2.39)#13 | 1.2%(+2.34)#2,179 |
| 14. | Hanscom Afb | 3.5% | 1.1%(+2.37)#14 | 1.2%(+2.32)#2,190 |
| 15. | Littleton Common | 3.4% | 1.1%(+2.25)#15 | 1.2%(+2.20)#2,333 |
| 16. | Brewster | 3.3% | 1.1%(+2.21)#16 | 1.2%(+2.16)#2,367 |
| 17. | Popponesset | 3.1% | 1.1%(+2.00)#17 | 1.2%(+1.95)#2,592 |
| 18. | Chatham | 3.1% | 1.1%(+1.95)#18 | 1.2%(+1.90)#2,645 |
| 19. | Winchendon | 3.0% | 1.1%(+1.83)#19 | 1.2%(+1.78)#2,834 |
| 20. | Andover | 2.7% | 1.1%(+1.56)#20 | 1.2%(+1.51)#3,195 |
| 21. | Scituate | 2.5% | 1.1%(+1.38)#21 | 1.2%(+1.33)#3,537 |
| 22. | Orange | 2.4% | 1.1%(+1.31)#22 | 1.2%(+1.26)#3,656 |
| 23. | Pinehurst | 2.4% | 1.1%(+1.30)#23 | 1.2%(+1.25)#3,683 |
| 24. | Turners Falls | 2.4% | 1.1%(+1.25)#24 | 1.2%(+1.20)#3,783 |
| 25. | Ocean Bluff Brant Rock | 2.3% | 1.1%(+1.20)#25 | 1.2%(+1.15)#3,880 |
| 26. | Winthrop Town | 2.3% | 1.1%(+1.16)#26 | 1.2%(+1.11)#3,986 |
| 27. | Rutland | 2.3% | 1.1%(+1.13)#27 | 1.2%(+1.08)#4,043 |
| 28. | Lynn | 2.3% | 1.1%(+1.13)#28 | 1.2%(+1.08)#4,052 |
| 29. | Hull | 2.3% | 1.1%(+1.13)#29 | 1.2%(+1.08)#4,056 |
| 30. | Pepperell | 2.2% | 1.1%(+1.04)#30 | 1.2%(+0.986)#4,259 |
| 31. | Belchertown | 2.2% | 1.1%(+1.03)#31 | 1.2%(+0.982)#4,269 |
| 32. | West Springfield Town | 2.1% | 1.1%(+1.01)#32 | 1.2%(+0.960)#4,328 |
| 33. | Norton Center | 2.1% | 1.1%(+1.01)#33 | 1.2%(+0.959)#4,337 |
| 34. | Williamstown | 2.1% | 1.1%(+0.960)#34 | 1.2%(+0.911)#4,455 |
| 35. | Webster | 2.1% | 1.1%(+0.925)#35 | 1.2%(+0.875)#4,550 |
| 36. | Chicopee | 2.0% | 1.1%(+0.881)#36 | 1.2%(+0.831)#4,678 |
| 37. | Housatonic | 2.0% | 1.1%(+0.843)#37 | 1.2%(+0.793)#4,821 |
| 38. | North Adams | 1.9% | 1.1%(+0.778)#38 | 1.2%(+0.728)#5,007 |
| 39. | Bliss Corner | 1.9% | 1.1%(+0.745)#39 | 1.2%(+0.695)#5,116 |
| 40. | Bellingham | 1.9% | 1.1%(+0.737)#40 | 1.2%(+0.688)#5,140 |
| 41. | Bridgewater Town | 1.8% | 1.1%(+0.695)#41 | 1.2%(+0.645)#5,288 |
| 42. | Huntington | 1.8% | 1.1%(+0.674)#42 | 1.2%(+0.624)#5,353 |
| 43. | Acushnet Center | 1.8% | 1.1%(+0.653)#43 | 1.2%(+0.603)#5,432 |
| 44. | Dennis | 1.8% | 1.1%(+0.640)#44 | 1.2%(+0.591)#5,472 |
| 45. | Adams | 1.8% | 1.1%(+0.625)#45 | 1.2%(+0.575)#5,523 |
| 46. | Monument Beach | 1.8% | 1.1%(+0.616)#46 | 1.2%(+0.566)#5,559 |
| 47. | Mansfield Center | 1.7% | 1.1%(+0.613)#47 | 1.2%(+0.563)#5,568 |
| 48. | Danvers | 1.7% | 1.1%(+0.574)#48 | 1.2%(+0.525)#5,696 |
| 49. | Athol | 1.7% | 1.1%(+0.531)#49 | 1.2%(+0.482)#5,871 |
| 50. | Pocasset | 1.7% | 1.1%(+0.521)#50 | 1.2%(+0.472)#5,915 |
| 51. | Framingham | 1.6% | 1.1%(+0.496)#51 | 1.2%(+0.446)#6,004 |
| 52. | Salisbury | 1.6% | 1.1%(+0.484)#52 | 1.2%(+0.435)#6,044 |
| 53. | Holyoke | 1.6% | 1.1%(+0.466)#53 | 1.2%(+0.416)#6,108 |
| 54. | Stoneham | 1.6% | 1.1%(+0.460)#54 | 1.2%(+0.410)#6,138 |
| 55. | Boston | 1.6% | 1.1%(+0.426)#55 | 1.2%(+0.376)#6,287 |
| 56. | Methuen Town | 1.5% | 1.1%(+0.408)#56 | 1.2%(+0.359)#6,359 |
| 57. | Teaticket | 1.5% | 1.1%(+0.398)#57 | 1.2%(+0.348)#6,404 |
| 58. | Easthampton Town | 1.5% | 1.1%(+0.397)#58 | 1.2%(+0.347)#6,408 |
| 59. | Peabody | 1.5% | 1.1%(+0.389)#59 | 1.2%(+0.339)#6,444 |
| 60. | Amherst | 1.5% | 1.1%(+0.363)#60 | 1.2%(+0.313)#6,563 |
| 61. | Revere | 1.5% | 1.1%(+0.358)#61 | 1.2%(+0.308)#6,579 |
| 62. | Medford | 1.5% | 1.1%(+0.347)#62 | 1.2%(+0.298)#6,625 |
| 63. | Lawrence | 1.5% | 1.1%(+0.346)#63 | 1.2%(+0.297)#6,627 |
| 64. | Taunton | 1.5% | 1.1%(+0.339)#64 | 1.2%(+0.289)#6,660 |
| 65. | Marshfield Hills | 1.5% | 1.1%(+0.333)#65 | 1.2%(+0.284)#6,687 |
| 66. | Marshfield | 1.5% | 1.1%(+0.329)#66 | 1.2%(+0.279)#6,702 |
| 67. | Hudson | 1.5% | 1.1%(+0.329)#67 | 1.2%(+0.279)#6,704 |
| 68. | Boxford | 1.5% | 1.1%(+0.319)#68 | 1.2%(+0.270)#6,745 |
| 69. | Orleans | 1.4% | 1.1%(+0.298)#69 | 1.2%(+0.248)#6,844 |
| 70. | South Dennis | 1.4% | 1.1%(+0.277)#70 | 1.2%(+0.228)#6,930 |
| 71. | Cordaville | 1.4% | 1.1%(+0.277)#71 | 1.2%(+0.227)#6,938 |
| 72. | Brookfield | 1.4% | 1.1%(+0.275)#72 | 1.2%(+0.225)#6,951 |
| 73. | North Falmouth | 1.4% | 1.1%(+0.259)#73 | 1.2%(+0.209)#7,019 |
| 74. | Braintree Town | 1.4% | 1.1%(+0.233)#74 | 1.2%(+0.183)#7,140 |
| 75. | Worcester | 1.4% | 1.1%(+0.222)#75 | 1.2%(+0.172)#7,212 |
| 76. | Longmeadow | 1.4% | 1.1%(+0.222)#76 | 1.2%(+0.172)#7,215 |
| 77. | Milton | 1.4% | 1.1%(+0.219)#77 | 1.2%(+0.170)#7,226 |
| 78. | Lunenburg | 1.3% | 1.1%(+0.193)#78 | 1.2%(+0.143)#7,393 |
| 79. | North Attleborough | 1.3% | 1.1%(+0.191)#79 | 1.2%(+0.141)#7,408 |
| 80. | Springfield | 1.3% | 1.1%(+0.168)#80 | 1.2%(+0.118)#7,539 |
| 81. | Brockton | 1.3% | 1.1%(+0.165)#81 | 1.2%(+0.116)#7,547 |
| 82. | Northampton | 1.3% | 1.1%(+0.164)#82 | 1.2%(+0.115)#7,558 |
| 83. | Dedham | 1.3% | 1.1%(+0.145)#83 | 1.2%(+0.095)#7,680 |
| 84. | Beverly | 1.3% | 1.1%(+0.134)#84 | 1.2%(+0.084)#7,735 |
| 85. | Weymouth Town | 1.2% | 1.1%(+0.107)#85 | 1.2%(+0.057)#7,881 |
| 86. | Rockport | 1.2% | 1.1%(+0.092)#86 | 1.2%(+0.042)#7,975 |
| 87. | New Bedford | 1.2% | 1.1%(+0.081)#87 | 1.2%(+0.031)#8,042 |
| 88. | Haverhill | 1.2% | 1.1%(+0.080)#88 | 1.2%(+0.031)#8,043 |
| 89. | Wakefield | 1.2% | 1.1%(+0.078)#89 | 1.2%(+0.028)#8,056 |
| 90. | Chelsea | 1.2% | 1.1%(+0.072)#90 | 1.2%(+0.022)#8,085 |
| 91. | Norwood | 1.2% | 1.1%(+0.063)#91 | 1.2%(+0.014)#8,148 |
| 92. | Wareham Center | 1.2% | 1.1%(+0.060)#92 | 1.2%(+0.011)#8,168 |
| 93. | Westfield | 1.2% | 1.1%(+0.060)#93 | 1.2%(+0.010)#8,172 |
| 94. | Marlborough | 1.2% | 1.1%(+0.041)#94 | 1.2%(-0.008)#8,292 |
| 95. | Everett | 1.2% | 1.1%(+0.022)#95 | 1.2%(-0.028)#8,396 |
| 96. | Fitchburg | 1.2% | 1.1%(+0.016)#96 | 1.2%(-0.034)#8,431 |
| 97. | Pittsfield | 1.2% | 1.1%(+0.015)#97 | 1.2%(-0.034)#8,435 |
| 98. | North Westport | 1.1% | 1.1%(+0.010)#98 | 1.2%(-0.040)#8,470 |
| 99. | Woburn | 1.1% | 1.1%(+0.004)#99 | 1.2%(-0.046)#8,509 |
| 100. | Franklin Town | 1.1% | 1.1%(-0.003)#100 | 1.2%(-0.052)#8,552 |
Common Questions
What are the Top 10 Cities with the Highest Percentage of Population Employed in Firefighting & Prevention in Massachusetts?
Top 10 Cities with the Highest Percentage of Population Employed in Firefighting & Prevention in Massachusetts are:
#1
8.7%
#2
5.3%
#3
5.1%
#4
5.1%
#5
4.5%
#6
4.3%
#7
3.8%
#8
3.8%
#9
3.6%
#10
3.5%
What city has the Highest Percentage of Population Employed in Firefighting & Prevention in Massachusetts?
Holland has the Highest Percentage of Population Employed in Firefighting & Prevention in Massachusetts with 8.7%.
What is the Percentage of Population Employed in Firefighting & Prevention in the State of Massachusetts?
Percentage of Population Employed in Firefighting & Prevention in Massachusetts is 1.1%.
What is the Percentage of Population Employed in Firefighting & Prevention in the United States?
Percentage of Population Employed in Firefighting & Prevention in the United States is 1.2%.