Cities with the Highest Percentage of Population Employed in Firefighting & Prevention in Illinois
RELATED REPORTS & OPTIONS
Firefighting & Prevention
Illinois
Compare Cities
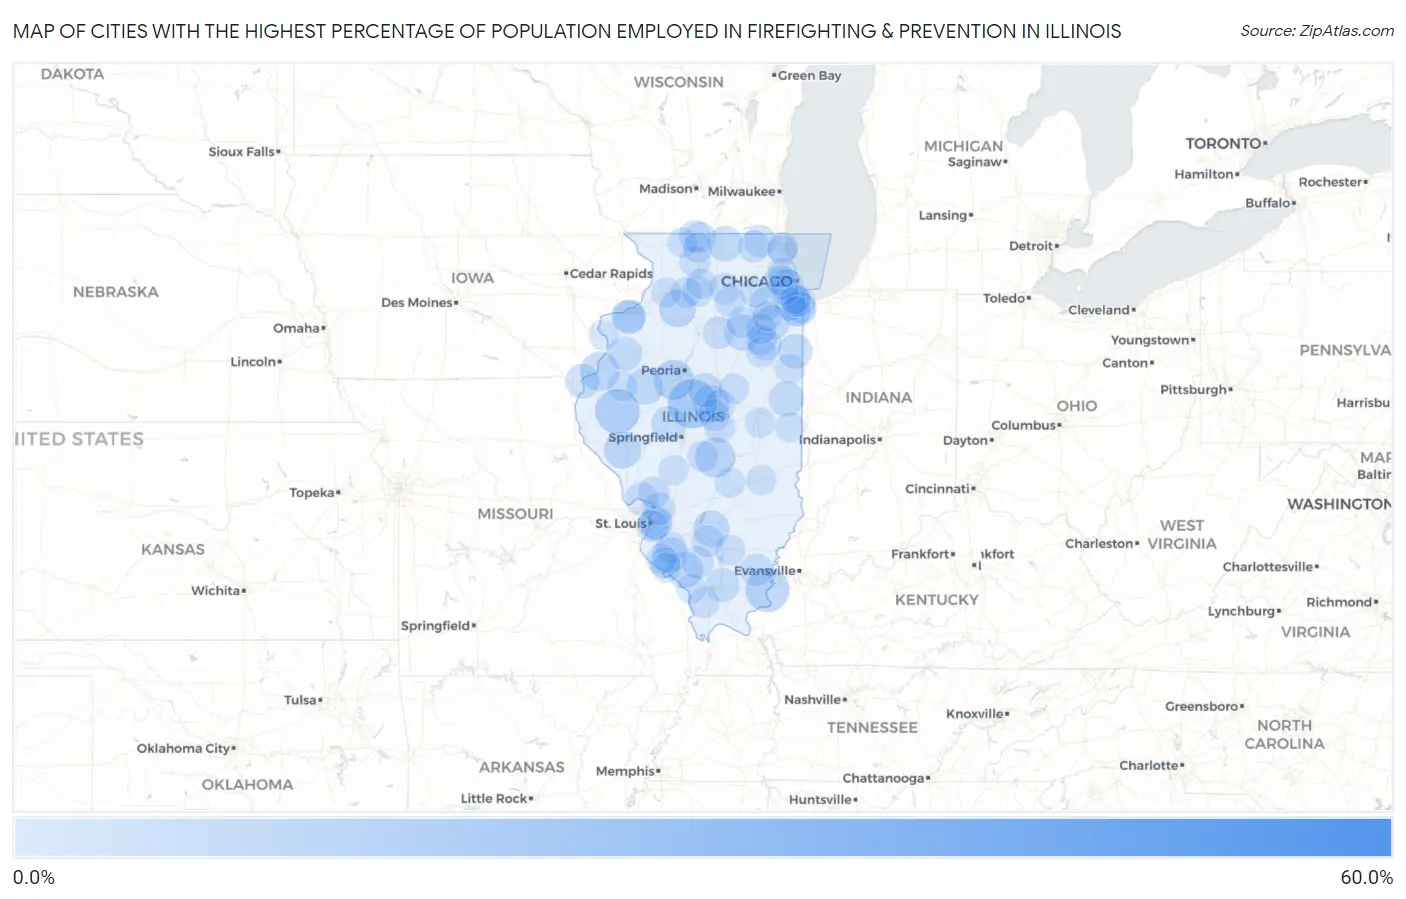
Map of Cities with the Highest Percentage of Population Employed in Firefighting & Prevention in Illinois
0.0%
60.0%
Cities with the Highest Percentage of Population Employed in Firefighting & Prevention in Illinois
| City | % Employed | vs State | vs National | |
| 1. | Paloma | 55.3% | 1.2%(+54.1)#1 | 1.2%(+54.1)#12 |
| 2. | Shirley | 31.2% | 1.2%(+30.0)#2 | 1.2%(+30.1)#50 |
| 3. | Hartsburg | 16.3% | 1.2%(+15.1)#3 | 1.2%(+15.1)#167 |
| 4. | Camden | 13.0% | 1.2%(+11.8)#4 | 1.2%(+11.9)#272 |
| 5. | Old Shawneetown | 12.5% | 1.2%(+11.3)#5 | 1.2%(+11.3)#290 |
| 6. | Prairietown | 10.1% | 1.2%(+8.92)#6 | 1.2%(+8.96)#412 |
| 7. | Kingston Mines | 9.9% | 1.2%(+8.63)#7 | 1.2%(+8.67)#429 |
| 8. | Assumption | 9.7% | 1.2%(+8.51)#8 | 1.2%(+8.55)#442 |
| 9. | Ritchie | 9.4% | 1.2%(+8.21)#9 | 1.2%(+8.25)#461 |
| 10. | Lomax | 9.3% | 1.2%(+8.06)#10 | 1.2%(+8.10)#471 |
| 11. | New Bedford | 7.7% | 1.2%(+6.47)#11 | 1.2%(+6.51)#662 |
| 12. | Detroit | 7.7% | 1.2%(+6.47)#12 | 1.2%(+6.51)#663 |
| 13. | Waynesville | 7.5% | 1.2%(+6.31)#13 | 1.2%(+6.35)#677 |
| 14. | Smithfield | 7.5% | 1.2%(+6.24)#14 | 1.2%(+6.28)#685 |
| 15. | Central City | 7.2% | 1.2%(+5.98)#15 | 1.2%(+6.02)#725 |
| 16. | Kinsman | 7.1% | 1.2%(+5.92)#16 | 1.2%(+5.96)#737 |
| 17. | Willisville | 7.0% | 1.2%(+5.78)#17 | 1.2%(+5.82)#758 |
| 18. | Lake Petersburg | 6.6% | 1.2%(+5.42)#18 | 1.2%(+5.46)#829 |
| 19. | Potomac | 6.6% | 1.2%(+5.34)#19 | 1.2%(+5.38)#837 |
| 20. | Candlewick Lake | 6.5% | 1.2%(+5.28)#20 | 1.2%(+5.31)#852 |
| 21. | Ford Heights | 6.4% | 1.2%(+5.17)#21 | 1.2%(+5.21)#873 |
| 22. | Baldwin | 6.3% | 1.2%(+5.12)#22 | 1.2%(+5.16)#882 |
| 23. | Nauvoo | 6.0% | 1.2%(+4.74)#23 | 1.2%(+4.78)#967 |
| 24. | Beaverville | 5.9% | 1.2%(+4.70)#24 | 1.2%(+4.74)#976 |
| 25. | Symerton | 5.9% | 1.2%(+4.66)#25 | 1.2%(+4.70)#993 |
| 26. | Monmouth | 5.8% | 1.2%(+4.53)#26 | 1.2%(+4.56)#1,026 |
| 27. | Stanford | 5.7% | 1.2%(+4.47)#27 | 1.2%(+4.51)#1,044 |
| 28. | Edgington | 5.7% | 1.2%(+4.44)#28 | 1.2%(+4.47)#1,052 |
| 29. | Spillertown | 5.7% | 1.2%(+4.44)#29 | 1.2%(+4.47)#1,053 |
| 30. | Crystal Lawns | 5.5% | 1.2%(+4.27)#30 | 1.2%(+4.31)#1,101 |
| 31. | Coyne Center | 5.3% | 1.2%(+4.11)#31 | 1.2%(+4.14)#1,155 |
| 32. | Oak Grove | 5.2% | 1.2%(+3.98)#32 | 1.2%(+4.02)#1,201 |
| 33. | Washington Park | 5.1% | 1.2%(+3.84)#33 | 1.2%(+3.88)#1,251 |
| 34. | Buckingham | 5.0% | 1.2%(+3.82)#34 | 1.2%(+3.86)#1,255 |
| 35. | Lockport Heights | 5.0% | 1.2%(+3.78)#35 | 1.2%(+3.81)#1,271 |
| 36. | East St Louis | 4.8% | 1.2%(+3.60)#36 | 1.2%(+3.64)#1,348 |
| 37. | Elsah | 4.8% | 1.2%(+3.59)#37 | 1.2%(+3.63)#1,351 |
| 38. | Broadview | 4.7% | 1.2%(+3.52)#38 | 1.2%(+3.56)#1,380 |
| 39. | Roxana | 4.7% | 1.2%(+3.51)#39 | 1.2%(+3.55)#1,386 |
| 40. | Norris City | 4.7% | 1.2%(+3.47)#40 | 1.2%(+3.51)#1,404 |
| 41. | Ridgewood | 4.6% | 1.2%(+3.37)#41 | 1.2%(+3.41)#1,446 |
| 42. | Pinckneyville | 4.5% | 1.2%(+3.32)#42 | 1.2%(+3.36)#1,469 |
| 43. | Leonore | 4.4% | 1.2%(+3.19)#43 | 1.2%(+3.23)#1,549 |
| 44. | Johnsburg | 4.4% | 1.2%(+3.17)#44 | 1.2%(+3.21)#1,566 |
| 45. | Gulfport | 4.3% | 1.2%(+3.12)#45 | 1.2%(+3.16)#1,595 |
| 46. | Lake Summerset | 4.2% | 1.2%(+3.01)#46 | 1.2%(+3.05)#1,652 |
| 47. | Sauget | 4.2% | 1.2%(+3.00)#47 | 1.2%(+3.04)#1,659 |
| 48. | Bull Valley | 4.2% | 1.2%(+2.96)#48 | 1.2%(+3.00)#1,677 |
| 49. | Brighton | 4.1% | 1.2%(+2.92)#49 | 1.2%(+2.95)#1,705 |
| 50. | Kenney | 4.1% | 1.2%(+2.91)#50 | 1.2%(+2.95)#1,706 |
| 51. | Stickney | 4.1% | 1.2%(+2.85)#51 | 1.2%(+2.89)#1,747 |
| 52. | Cahokia Heights | 4.0% | 1.2%(+2.82)#52 | 1.2%(+2.86)#1,762 |
| 53. | Seneca | 4.0% | 1.2%(+2.80)#53 | 1.2%(+2.84)#1,778 |
| 54. | Holcomb | 4.0% | 1.2%(+2.78)#54 | 1.2%(+2.81)#1,800 |
| 55. | Richview | 4.0% | 1.2%(+2.74)#55 | 1.2%(+2.77)#1,818 |
| 56. | Durand | 3.9% | 1.2%(+2.65)#56 | 1.2%(+2.69)#1,871 |
| 57. | Shabbona | 3.8% | 1.2%(+2.61)#57 | 1.2%(+2.65)#1,901 |
| 58. | Lenzburg | 3.8% | 1.2%(+2.59)#58 | 1.2%(+2.62)#1,921 |
| 59. | Leaf River | 3.7% | 1.2%(+2.53)#59 | 1.2%(+2.56)#1,966 |
| 60. | Amboy | 3.7% | 1.2%(+2.52)#60 | 1.2%(+2.56)#1,970 |
| 61. | Wapella | 3.7% | 1.2%(+2.50)#61 | 1.2%(+2.54)#1,983 |
| 62. | Forsyth | 3.7% | 1.2%(+2.43)#62 | 1.2%(+2.47)#2,065 |
| 63. | Lynwood | 3.6% | 1.2%(+2.40)#63 | 1.2%(+2.43)#2,093 |
| 64. | Reddick | 3.6% | 1.2%(+2.39)#64 | 1.2%(+2.43)#2,107 |
| 65. | Cobden | 3.5% | 1.2%(+2.32)#65 | 1.2%(+2.36)#2,167 |
| 66. | Country Club Hills | 3.5% | 1.2%(+2.24)#66 | 1.2%(+2.28)#2,242 |
| 67. | Harmon | 3.4% | 1.2%(+2.22)#67 | 1.2%(+2.26)#2,261 |
| 68. | Leland | 3.4% | 1.2%(+2.21)#68 | 1.2%(+2.25)#2,267 |
| 69. | Calumet City | 3.4% | 1.2%(+2.20)#69 | 1.2%(+2.24)#2,285 |
| 70. | North Chicago | 3.4% | 1.2%(+2.18)#70 | 1.2%(+2.22)#2,306 |
| 71. | Kempton | 3.4% | 1.2%(+2.17)#71 | 1.2%(+2.20)#2,327 |
| 72. | Godley | 3.4% | 1.2%(+2.16)#72 | 1.2%(+2.20)#2,335 |
| 73. | Taylorville | 3.4% | 1.2%(+2.15)#73 | 1.2%(+2.19)#2,340 |
| 74. | Evansville | 3.3% | 1.2%(+2.08)#74 | 1.2%(+2.12)#2,409 |
| 75. | Phoenix | 3.3% | 1.2%(+2.04)#75 | 1.2%(+2.08)#2,456 |
| 76. | Ellsworth | 3.3% | 1.2%(+2.04)#76 | 1.2%(+2.08)#2,465 |
| 77. | Franklin Grove | 3.3% | 1.2%(+2.03)#77 | 1.2%(+2.07)#2,478 |
| 78. | Opdyke | 3.3% | 1.2%(+2.03)#78 | 1.2%(+2.07)#2,479 |
| 79. | Elwood | 3.2% | 1.2%(+1.94)#79 | 1.2%(+1.98)#2,572 |
| 80. | Beecher City | 3.1% | 1.2%(+1.87)#80 | 1.2%(+1.91)#2,640 |
| 81. | Tolono | 3.1% | 1.2%(+1.86)#81 | 1.2%(+1.90)#2,650 |
| 82. | Knollwood | 3.1% | 1.2%(+1.86)#82 | 1.2%(+1.90)#2,652 |
| 83. | Ruma | 3.1% | 1.2%(+1.83)#83 | 1.2%(+1.87)#2,689 |
| 84. | Riverdale | 3.0% | 1.2%(+1.82)#84 | 1.2%(+1.86)#2,706 |
| 85. | Macomb | 3.0% | 1.2%(+1.80)#85 | 1.2%(+1.84)#2,732 |
| 86. | Berkeley | 3.0% | 1.2%(+1.80)#86 | 1.2%(+1.83)#2,738 |
| 87. | New Boston | 3.0% | 1.2%(+1.77)#87 | 1.2%(+1.81)#2,783 |
| 88. | Gorham | 3.0% | 1.2%(+1.76)#88 | 1.2%(+1.80)#2,801 |
| 89. | Standard City | 3.0% | 1.2%(+1.76)#89 | 1.2%(+1.80)#2,803 |
| 90. | Lyndon | 3.0% | 1.2%(+1.73)#90 | 1.2%(+1.77)#2,851 |
| 91. | Ellis Grove | 2.9% | 1.2%(+1.72)#91 | 1.2%(+1.76)#2,868 |
| 92. | Justice | 2.9% | 1.2%(+1.70)#92 | 1.2%(+1.73)#2,890 |
| 93. | Indianola | 2.9% | 1.2%(+1.67)#93 | 1.2%(+1.71)#2,916 |
| 94. | Cedarville | 2.9% | 1.2%(+1.67)#94 | 1.2%(+1.71)#2,919 |
| 95. | Jewett | 2.9% | 1.2%(+1.66)#95 | 1.2%(+1.70)#2,927 |
| 96. | Pecatonica | 2.9% | 1.2%(+1.65)#96 | 1.2%(+1.69)#2,937 |
| 97. | Rosemont | 2.9% | 1.2%(+1.63)#97 | 1.2%(+1.67)#2,956 |
| 98. | South Chicago Heights | 2.8% | 1.2%(+1.61)#98 | 1.2%(+1.64)#2,999 |
| 99. | Woodland | 2.8% | 1.2%(+1.61)#99 | 1.2%(+1.64)#3,000 |
| 100. | Montgomery | 2.8% | 1.2%(+1.57)#100 | 1.2%(+1.61)#3,039 |
Common Questions
What are the Top 10 Cities with the Highest Percentage of Population Employed in Firefighting & Prevention in Illinois?
Top 10 Cities with the Highest Percentage of Population Employed in Firefighting & Prevention in Illinois are:
#1
16.3%
#2
13.0%
#3
12.5%
#4
9.9%
#5
9.7%
#6
9.3%
#7
7.7%
#8
7.7%
#9
7.5%
#10
7.5%
What city has the Highest Percentage of Population Employed in Firefighting & Prevention in Illinois?
Hartsburg has the Highest Percentage of Population Employed in Firefighting & Prevention in Illinois with 16.3%.
What is the Percentage of Population Employed in Firefighting & Prevention in the State of Illinois?
Percentage of Population Employed in Firefighting & Prevention in Illinois is 1.2%.
What is the Percentage of Population Employed in Firefighting & Prevention in the United States?
Percentage of Population Employed in Firefighting & Prevention in the United States is 1.2%.