Cities with the Lowest Male Poverty Level in Indiana
RELATED REPORTS & OPTIONS
Lowest Poverty | Male
Indiana
Compare Cities
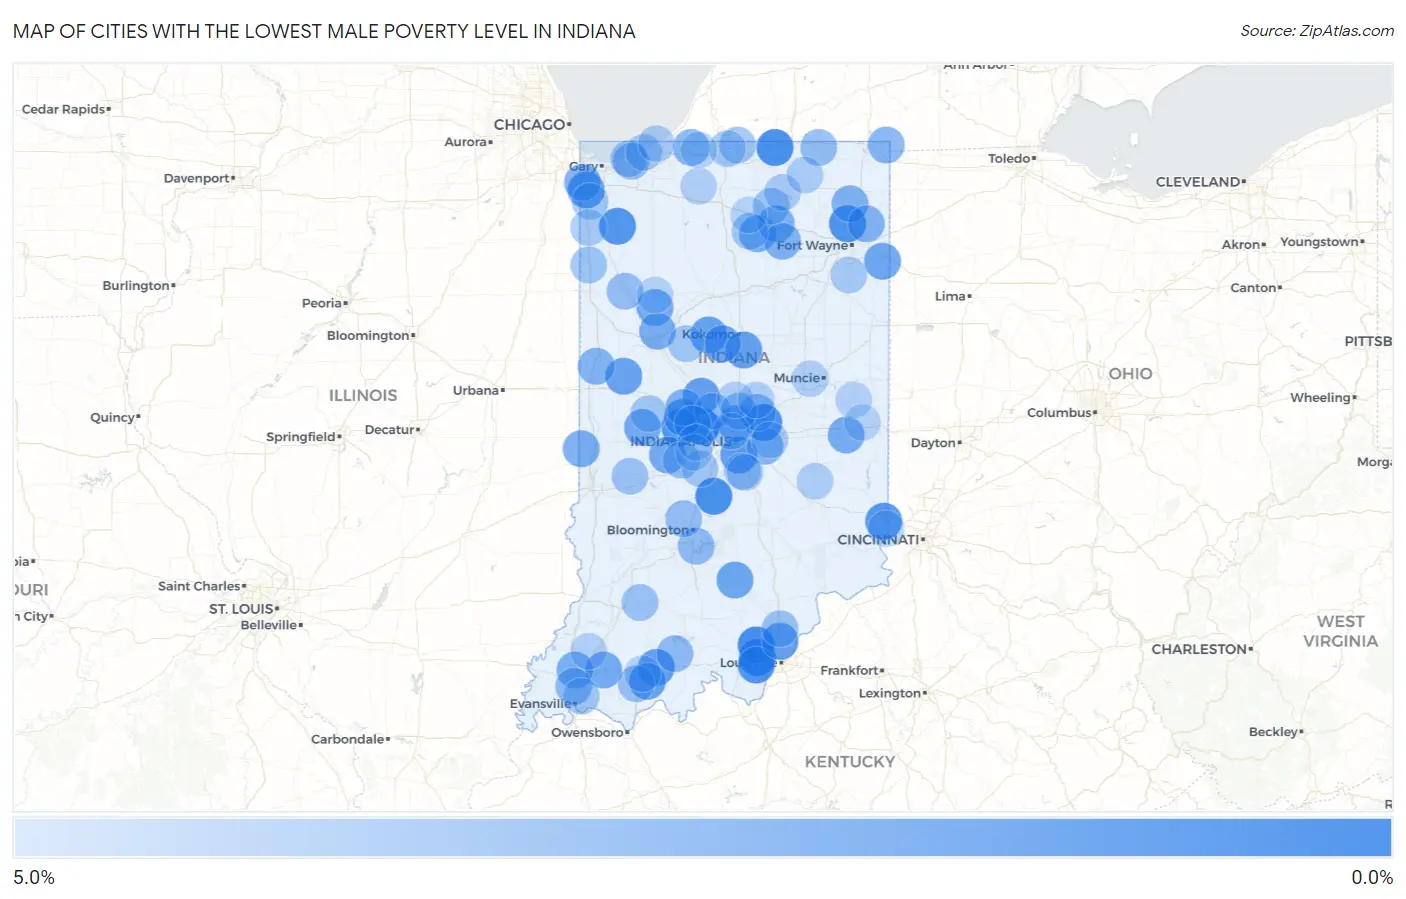
Map of Cities with the Lowest Male Poverty Level in Indiana
5.0%
0.0%
Cities with the Lowest Male Poverty Level in Indiana
| City | Male Poverty | vs State | vs National | |
| 1. | Pittsboro | 0.054% | 11.1%(-11.0)#1 | 11.3%(-11.3)#1 |
| 2. | Georgetown | 0.48% | 11.1%(-10.6)#2 | 11.3%(-10.9)#132 |
| 3. | Greenville | 0.51% | 11.1%(-10.5)#3 | 11.3%(-10.8)#148 |
| 4. | Bristol | 0.58% | 11.1%(-10.5)#4 | 11.3%(-10.8)#186 |
| 5. | Painted Hills | 0.58% | 11.1%(-10.5)#5 | 11.3%(-10.8)#187 |
| 6. | Mccordsville | 0.70% | 11.1%(-10.4)#6 | 11.3%(-10.6)#261 |
| 7. | Huntertown | 0.82% | 11.1%(-10.2)#7 | 11.3%(-10.5)#352 |
| 8. | North Salem | 0.84% | 11.1%(-10.2)#8 | 11.3%(-10.5)#368 |
| 9. | Lanesville | 0.85% | 11.1%(-10.2)#9 | 11.3%(-10.5)#371 |
| 10. | De Motte | 0.91% | 11.1%(-10.1)#10 | 11.3%(-10.4)#422 |
| 11. | Bright | 0.98% | 11.1%(-10.1)#11 | 11.3%(-10.4)#468 |
| 12. | Jamestown | 1.2% | 11.1%(-9.82)#12 | 11.3%(-10.1)#694 |
| 13. | Ferdinand | 1.3% | 11.1%(-9.73)#13 | 11.3%(-10.0)#774 |
| 14. | St John | 1.3% | 11.1%(-9.73)#14 | 11.3%(-10.0)#781 |
| 15. | Ulen | 1.5% | 11.1%(-9.58)#15 | 11.3%(-9.87)#911 |
| 16. | Homecroft | 1.5% | 11.1%(-9.56)#16 | 11.3%(-9.85)#932 |
| 17. | Burlington | 1.5% | 11.1%(-9.53)#17 | 11.3%(-9.82)#956 |
| 18. | Sharpsville | 1.6% | 11.1%(-9.47)#18 | 11.3%(-9.76)#1,007 |
| 19. | Newtown | 1.6% | 11.1%(-9.46)#19 | 11.3%(-9.75)#1,014 |
| 20. | Santa Claus | 1.6% | 11.1%(-9.41)#20 | 11.3%(-9.71)#1,055 |
| 21. | Sellersburg | 1.7% | 11.1%(-9.34)#21 | 11.3%(-9.64)#1,147 |
| 22. | Monroeville | 1.8% | 11.1%(-9.29)#22 | 11.3%(-9.58)#1,216 |
| 23. | Medora | 1.8% | 11.1%(-9.27)#23 | 11.3%(-9.57)#1,234 |
| 24. | Russiaville | 1.8% | 11.1%(-9.22)#24 | 11.3%(-9.51)#1,295 |
| 25. | Paxton | 1.9% | 11.1%(-9.20)#25 | 11.3%(-9.49)#1,317 |
| 26. | Russellville | 2.0% | 11.1%(-9.06)#26 | 11.3%(-9.35)#1,462 |
| 27. | Lynnville | 2.0% | 11.1%(-9.03)#27 | 11.3%(-9.32)#1,503 |
| 28. | Chalmers | 2.0% | 11.1%(-9.03)#28 | 11.3%(-9.32)#1,506 |
| 29. | Meridian Hills | 2.0% | 11.1%(-9.02)#29 | 11.3%(-9.31)#1,515 |
| 30. | Fillmore | 2.1% | 11.1%(-9.00)#30 | 11.3%(-9.29)#1,543 |
| 31. | St Bernice | 2.1% | 11.1%(-8.94)#31 | 11.3%(-9.23)#1,609 |
| 32. | Mount Auburn | 2.1% | 11.1%(-8.92)#32 | 11.3%(-9.21)#1,637 |
| 33. | Burket | 2.2% | 11.1%(-8.88)#33 | 11.3%(-9.17)#1,695 |
| 34. | Battle Ground | 2.2% | 11.1%(-8.86)#34 | 11.3%(-9.15)#1,713 |
| 35. | Haubstadt | 2.2% | 11.1%(-8.85)#35 | 11.3%(-9.14)#1,731 |
| 36. | Winona Lake | 2.2% | 11.1%(-8.85)#36 | 11.3%(-9.14)#1,735 |
| 37. | Dyer | 2.2% | 11.1%(-8.83)#37 | 11.3%(-9.12)#1,763 |
| 38. | Altona | 2.4% | 11.1%(-8.67)#38 | 11.3%(-8.96)#1,969 |
| 39. | Advance | 2.4% | 11.1%(-8.67)#39 | 11.3%(-8.96)#1,970 |
| 40. | Sidney | 2.4% | 11.1%(-8.67)#40 | 11.3%(-8.96)#1,976 |
| 41. | Leo Cedarville | 2.4% | 11.1%(-8.63)#41 | 11.3%(-8.92)#2,020 |
| 42. | Hudson Lake | 2.5% | 11.1%(-8.55)#42 | 11.3%(-8.85)#2,119 |
| 43. | West Lebanon | 2.5% | 11.1%(-8.55)#43 | 11.3%(-8.84)#2,124 |
| 44. | Clear Lake | 2.5% | 11.1%(-8.54)#44 | 11.3%(-8.83)#2,153 |
| 45. | New Palestine | 2.6% | 11.1%(-8.42)#45 | 11.3%(-8.71)#2,295 |
| 46. | Fishers | 2.7% | 11.1%(-8.34)#46 | 11.3%(-8.63)#2,408 |
| 47. | Darmstadt | 2.8% | 11.1%(-8.28)#47 | 11.3%(-8.57)#2,481 |
| 48. | Whitestown | 2.8% | 11.1%(-8.28)#48 | 11.3%(-8.57)#2,482 |
| 49. | Jimmerson Lake | 2.8% | 11.1%(-8.22)#49 | 11.3%(-8.51)#2,560 |
| 50. | Smithville Sanders | 2.8% | 11.1%(-8.21)#50 | 11.3%(-8.50)#2,564 |
| 51. | Birdseye | 2.9% | 11.1%(-8.18)#51 | 11.3%(-8.47)#2,621 |
| 52. | Porter | 2.9% | 11.1%(-8.12)#52 | 11.3%(-8.41)#2,685 |
| 53. | Carmel | 3.0% | 11.1%(-8.05)#53 | 11.3%(-8.34)#2,796 |
| 54. | Howe | 3.0% | 11.1%(-8.04)#54 | 11.3%(-8.34)#2,803 |
| 55. | Remington | 3.0% | 11.1%(-8.03)#55 | 11.3%(-8.33)#2,817 |
| 56. | Ellettsville | 3.0% | 11.1%(-8.02)#56 | 11.3%(-8.31)#2,838 |
| 57. | Gentryville | 3.1% | 11.1%(-7.93)#57 | 11.3%(-8.22)#2,965 |
| 58. | Stilesville | 3.1% | 11.1%(-7.93)#58 | 11.3%(-8.22)#2,966 |
| 59. | Memphis | 3.2% | 11.1%(-7.89)#59 | 11.3%(-8.19)#3,007 |
| 60. | Lizton | 3.2% | 11.1%(-7.87)#60 | 11.3%(-8.16)#3,037 |
| 61. | Underwood | 3.2% | 11.1%(-7.84)#61 | 11.3%(-8.13)#3,077 |
| 62. | Knightsville | 3.2% | 11.1%(-7.82)#62 | 11.3%(-8.12)#3,102 |
| 63. | Leesburg | 3.2% | 11.1%(-7.81)#63 | 11.3%(-8.10)#3,130 |
| 64. | Cannelburg | 3.3% | 11.1%(-7.79)#64 | 11.3%(-8.08)#3,172 |
| 65. | Morocco | 3.3% | 11.1%(-7.75)#65 | 11.3%(-8.04)#3,240 |
| 66. | Mentone | 3.4% | 11.1%(-7.69)#66 | 11.3%(-7.98)#3,327 |
| 67. | Granger | 3.4% | 11.1%(-7.68)#67 | 11.3%(-7.97)#3,346 |
| 68. | New Whiteland | 3.4% | 11.1%(-7.67)#68 | 11.3%(-7.97)#3,347 |
| 69. | Monrovia | 3.4% | 11.1%(-7.61)#69 | 11.3%(-7.90)#3,446 |
| 70. | Rossville | 3.5% | 11.1%(-7.59)#70 | 11.3%(-7.88)#3,479 |
| 71. | Cedar Lake | 3.5% | 11.1%(-7.56)#71 | 11.3%(-7.85)#3,527 |
| 72. | Melody Hill | 3.5% | 11.1%(-7.56)#72 | 11.3%(-7.85)#3,528 |
| 73. | Dune Acres | 3.5% | 11.1%(-7.55)#73 | 11.3%(-7.85)#3,534 |
| 74. | New Market | 3.5% | 11.1%(-7.50)#74 | 11.3%(-7.79)#3,605 |
| 75. | Schneider | 3.6% | 11.1%(-7.48)#75 | 11.3%(-7.77)#3,640 |
| 76. | Indian Village | 3.6% | 11.1%(-7.48)#76 | 11.3%(-7.77)#3,642 |
| 77. | Spring Lake | 3.6% | 11.1%(-7.45)#77 | 11.3%(-7.74)#3,687 |
| 78. | Wynnedale | 3.6% | 11.1%(-7.41)#78 | 11.3%(-7.71)#3,717 |
| 79. | Beverly Shores | 3.6% | 11.1%(-7.40)#79 | 11.3%(-7.69)#3,729 |
| 80. | Ossian | 3.7% | 11.1%(-7.40)#80 | 11.3%(-7.69)#3,732 |
| 81. | Long Beach | 3.7% | 11.1%(-7.39)#81 | 11.3%(-7.68)#3,747 |
| 82. | Syracuse | 3.8% | 11.1%(-7.30)#82 | 11.3%(-7.59)#3,911 |
| 83. | Topeka | 3.8% | 11.1%(-7.23)#83 | 11.3%(-7.52)#4,001 |
| 84. | Milroy | 3.8% | 11.1%(-7.22)#84 | 11.3%(-7.51)#4,012 |
| 85. | Whiteland | 3.8% | 11.1%(-7.21)#85 | 11.3%(-7.50)#4,026 |
| 86. | Yorktown | 3.9% | 11.1%(-7.10)#86 | 11.3%(-7.40)#4,199 |
| 87. | Westfield | 4.0% | 11.1%(-7.09)#87 | 11.3%(-7.38)#4,221 |
| 88. | Walkerton | 4.0% | 11.1%(-7.09)#88 | 11.3%(-7.38)#4,226 |
| 89. | Modoc | 4.0% | 11.1%(-7.08)#89 | 11.3%(-7.37)#4,232 |
| 90. | Dale | 4.0% | 11.1%(-7.07)#90 | 11.3%(-7.36)#4,254 |
| 91. | Noblesville | 4.0% | 11.1%(-7.06)#91 | 11.3%(-7.35)#4,278 |
| 92. | Francisco | 4.0% | 11.1%(-7.02)#92 | 11.3%(-7.31)#4,330 |
| 93. | Hidden Valley | 4.0% | 11.1%(-7.01)#93 | 11.3%(-7.30)#4,348 |
| 94. | Reo | 4.0% | 11.1%(-7.00)#94 | 11.3%(-7.30)#4,357 |
| 95. | Etna Green | 4.1% | 11.1%(-7.00)#95 | 11.3%(-7.29)#4,369 |
| 96. | Clayton | 4.1% | 11.1%(-6.98)#96 | 11.3%(-7.27)#4,395 |
| 97. | Reynolds | 4.1% | 11.1%(-6.97)#97 | 11.3%(-7.26)#4,403 |
| 98. | New Carlisle | 4.1% | 11.1%(-6.92)#98 | 11.3%(-7.21)#4,479 |
| 99. | Danville | 4.1% | 11.1%(-6.92)#99 | 11.3%(-7.21)#4,483 |
| 100. | Greens Fork | 4.1% | 11.1%(-6.91)#100 | 11.3%(-7.21)#4,490 |
Common Questions
What are the Top 10 Cities with the Lowest Male Poverty Level in Indiana?
Top 10 Cities with the Lowest Male Poverty Level in Indiana are:
#1
0.054%
#2
0.48%
#3
0.51%
#4
0.58%
#5
0.58%
#6
0.70%
#7
0.82%
#8
0.84%
#9
0.85%
#10
0.91%
What city has the Lowest Male Poverty Level in Indiana?
Pittsboro has the Lowest Male Poverty Level in Indiana with 0.054%.
What is the Poverty Level Among Males in the State of Indiana?
Poverty Level Among Males in Indiana is 11.1%.
What is the Poverty Level Among Males in the United States?
Poverty Level Among Males in the United States is 11.3%.