Cities with the Lowest Male Poverty Level in New Hampshire
RELATED REPORTS & OPTIONS
Lowest Poverty | Male
New Hampshire
Compare Cities
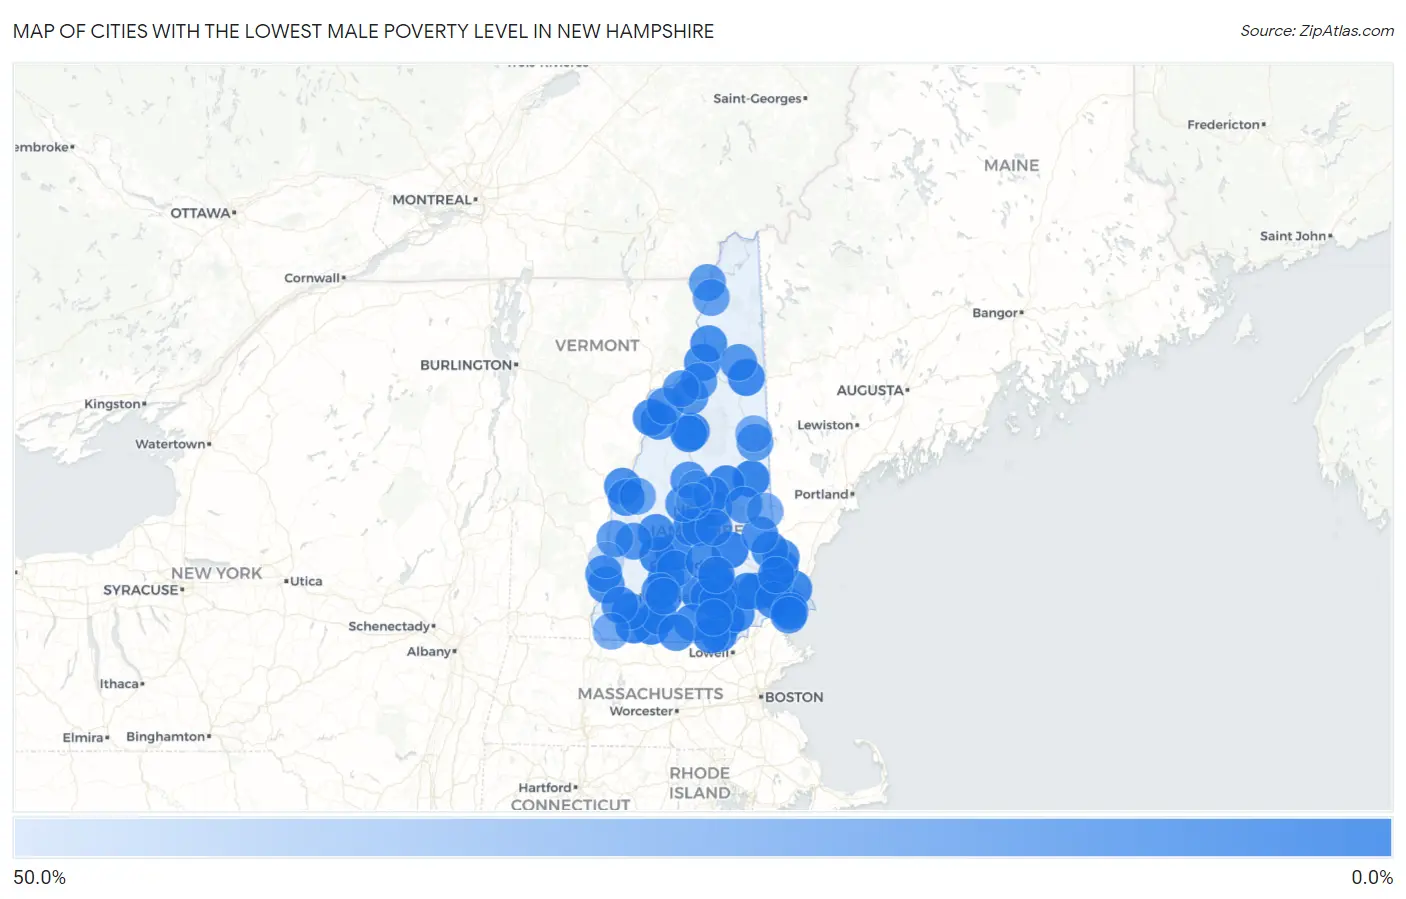
Map of Cities with the Lowest Male Poverty Level in New Hampshire
50.0%
0.0%
Cities with the Lowest Male Poverty Level in New Hampshire
| City | Male Poverty | vs State | vs National | |
| 1. | Pittsfield | 1.3% | 6.4%(-5.07)#1 | 11.3%(-10.0)#770 |
| 2. | Newfields | 1.4% | 6.4%(-5.01)#2 | 11.3%(-9.96)#833 |
| 3. | Londonderry | 1.5% | 6.4%(-4.84)#3 | 11.3%(-9.79)#982 |
| 4. | Center Ossipee | 2.0% | 6.4%(-4.36)#4 | 11.3%(-9.32)#1,505 |
| 5. | Klondike Corner | 2.1% | 6.4%(-4.24)#5 | 11.3%(-9.20)#1,657 |
| 6. | Goffstown | 2.8% | 6.4%(-3.60)#6 | 11.3%(-8.56)#2,497 |
| 7. | Hudson | 2.8% | 6.4%(-3.57)#7 | 11.3%(-8.52)#2,539 |
| 8. | Hillsborough | 2.8% | 6.4%(-3.55)#8 | 11.3%(-8.51)#2,556 |
| 9. | Jaffrey | 3.2% | 6.4%(-3.17)#9 | 11.3%(-8.13)#3,084 |
| 10. | Hampton | 3.4% | 6.4%(-3.00)#10 | 11.3%(-7.95)#3,363 |
| 11. | Warner | 3.8% | 6.4%(-2.54)#11 | 11.3%(-7.50)#4,033 |
| 12. | Troy | 3.9% | 6.4%(-2.45)#12 | 11.3%(-7.40)#4,192 |
| 13. | Franklin | 4.4% | 6.4%(-2.01)#13 | 11.3%(-6.96)#4,870 |
| 14. | Portsmouth | 4.4% | 6.4%(-1.97)#14 | 11.3%(-6.92)#4,920 |
| 15. | Lincoln | 4.5% | 6.4%(-1.89)#15 | 11.3%(-6.84)#5,044 |
| 16. | South Hooksett | 4.5% | 6.4%(-1.86)#16 | 11.3%(-6.81)#5,078 |
| 17. | Newmarket | 4.6% | 6.4%(-1.79)#17 | 11.3%(-6.75)#5,194 |
| 18. | Bradford | 4.6% | 6.4%(-1.78)#18 | 11.3%(-6.73)#5,215 |
| 19. | Tilton Northfield | 4.7% | 6.4%(-1.68)#19 | 11.3%(-6.64)#5,372 |
| 20. | Gorham | 4.7% | 6.4%(-1.67)#20 | 11.3%(-6.62)#5,402 |
| 21. | Suissevale | 4.7% | 6.4%(-1.65)#21 | 11.3%(-6.60)#5,426 |
| 22. | Hooksett | 4.9% | 6.4%(-1.49)#22 | 11.3%(-6.45)#5,663 |
| 23. | Epping | 5.1% | 6.4%(-1.28)#23 | 11.3%(-6.24)#5,953 |
| 24. | Dover | 5.4% | 6.4%(-1.03)#24 | 11.3%(-5.98)#6,332 |
| 25. | North Woodstock | 5.7% | 6.4%(-0.717)#25 | 11.3%(-5.67)#6,809 |
| 26. | Peterborough | 5.7% | 6.4%(-0.713)#26 | 11.3%(-5.67)#6,818 |
| 27. | Lancaster | 5.8% | 6.4%(-0.625)#27 | 11.3%(-5.58)#6,967 |
| 28. | Derry | 5.9% | 6.4%(-0.523)#28 | 11.3%(-5.48)#7,112 |
| 29. | Mountain Lakes | 5.9% | 6.4%(-0.439)#29 | 11.3%(-5.40)#7,213 |
| 30. | Raymond | 6.0% | 6.4%(-0.348)#30 | 11.3%(-5.30)#7,332 |
| 31. | Pinardville | 6.0% | 6.4%(-0.337)#31 | 11.3%(-5.29)#7,350 |
| 32. | Milford | 6.3% | 6.4%(-0.072)#32 | 11.3%(-5.03)#7,734 |
| 33. | Nashua | 7.1% | 6.4%(+0.675)#33 | 11.3%(-4.28)#8,829 |
| 34. | Exeter | 7.1% | 6.4%(+0.742)#34 | 11.3%(-4.21)#8,920 |
| 35. | Somersworth | 7.4% | 6.4%(+1.02)#35 | 11.3%(-3.93)#9,335 |
| 36. | Hanover | 7.5% | 6.4%(+1.14)#36 | 11.3%(-3.82)#9,484 |
| 37. | Woodsville | 7.6% | 6.4%(+1.19)#37 | 11.3%(-3.76)#9,554 |
| 38. | Lebanon | 7.7% | 6.4%(+1.27)#38 | 11.3%(-3.69)#9,659 |
| 39. | Groveton | 7.9% | 6.4%(+1.55)#39 | 11.3%(-3.41)#10,051 |
| 40. | Laconia | 8.0% | 6.4%(+1.65)#40 | 11.3%(-3.31)#10,177 |
| 41. | New London | 8.1% | 6.4%(+1.67)#41 | 11.3%(-3.28)#10,212 |
| 42. | Rochester | 8.3% | 6.4%(+1.96)#42 | 11.3%(-2.99)#10,596 |
| 43. | Walpole | 8.5% | 6.4%(+2.08)#43 | 11.3%(-2.87)#10,723 |
| 44. | Henniker | 8.7% | 6.4%(+2.30)#44 | 11.3%(-2.65)#10,985 |
| 45. | Concord | 8.8% | 6.4%(+2.38)#45 | 11.3%(-2.57)#11,087 |
| 46. | Marlborough | 8.8% | 6.4%(+2.43)#46 | 11.3%(-2.53)#11,134 |
| 47. | Antrim | 9.0% | 6.4%(+2.64)#47 | 11.3%(-2.31)#11,410 |
| 48. | Bennington | 9.1% | 6.4%(+2.71)#48 | 11.3%(-2.25)#11,497 |
| 49. | Hampton Beach | 9.3% | 6.4%(+2.92)#49 | 11.3%(-2.03)#11,791 |
| 50. | Manchester | 9.4% | 6.4%(+3.04)#50 | 11.3%(-1.92)#11,932 |
| 51. | Farmington | 9.6% | 6.4%(+3.24)#51 | 11.3%(-1.72)#12,193 |
| 52. | North Walpole | 9.7% | 6.4%(+3.27)#52 | 11.3%(-1.69)#12,222 |
| 53. | Lisbon | 10.0% | 6.4%(+3.64)#53 | 11.3%(-1.32)#12,649 |
| 54. | Bristol | 10.3% | 6.4%(+3.93)#54 | 11.3%(-1.02)#12,981 |
| 55. | Suncook | 10.4% | 6.4%(+4.05)#55 | 11.3%(-0.905)#13,120 |
| 56. | Keene | 10.5% | 6.4%(+4.12)#56 | 11.3%(-0.832)#13,209 |
| 57. | Seabrook Beach | 10.7% | 6.4%(+4.36)#57 | 11.3%(-0.594)#13,467 |
| 58. | Newport | 11.4% | 6.4%(+4.98)#58 | 11.3%(+0.025)#14,171 |
| 59. | Greenville | 11.6% | 6.4%(+5.21)#59 | 11.3%(+0.253)#14,430 |
| 60. | East Merrimack | 11.8% | 6.4%(+5.40)#60 | 11.3%(+0.444)#14,662 |
| 61. | Plymouth | 11.8% | 6.4%(+5.46)#61 | 11.3%(+0.506)#14,719 |
| 62. | New Boston | 12.0% | 6.4%(+5.65)#62 | 11.3%(+0.688)#14,925 |
| 63. | Meredith | 12.3% | 6.4%(+5.96)#63 | 11.3%(+1.01)#15,256 |
| 64. | Bethlehem | 12.8% | 6.4%(+6.37)#64 | 11.3%(+1.41)#15,659 |
| 65. | Belmont | 12.9% | 6.4%(+6.48)#65 | 11.3%(+1.52)#15,757 |
| 66. | Wolfeboro | 13.2% | 6.4%(+6.84)#66 | 11.3%(+1.89)#16,149 |
| 67. | Berlin | 13.3% | 6.4%(+6.89)#67 | 11.3%(+1.93)#16,190 |
| 68. | Whitefield | 15.0% | 6.4%(+8.59)#68 | 11.3%(+3.63)#17,694 |
| 69. | Claremont | 15.2% | 6.4%(+8.82)#69 | 11.3%(+3.86)#17,861 |
| 70. | Durham | 15.4% | 6.4%(+9.01)#70 | 11.3%(+4.06)#18,003 |
| 71. | West Stewartstown | 15.5% | 6.4%(+9.16)#71 | 11.3%(+4.20)#18,112 |
| 72. | Littleton | 15.6% | 6.4%(+9.22)#72 | 11.3%(+4.26)#18,172 |
| 73. | Conway | 16.2% | 6.4%(+9.79)#73 | 11.3%(+4.83)#18,620 |
| 74. | Colebrook | 18.2% | 6.4%(+11.8)#74 | 11.3%(+6.86)#20,028 |
| 75. | Enfield | 21.4% | 6.4%(+15.0)#75 | 11.3%(+10.1)#21,784 |
| 76. | Sanbornville | 23.9% | 6.4%(+17.5)#76 | 11.3%(+12.6)#22,892 |
| 77. | Winchester | 24.5% | 6.4%(+18.1)#77 | 11.3%(+13.2)#23,096 |
| 78. | North Conway | 24.6% | 6.4%(+18.2)#78 | 11.3%(+13.2)#23,111 |
| 79. | Ashland | 37.2% | 6.4%(+30.8)#79 | 11.3%(+25.8)#25,726 |
| 80. | Charlestown | 49.2% | 6.4%(+42.8)#80 | 11.3%(+37.9)#26,696 |
| 81. | New Hampton | 49.5% | 6.4%(+43.2)#81 | 11.3%(+38.2)#26,709 |
1
Common Questions
What are the Top 10 Cities with the Lowest Male Poverty Level in New Hampshire?
Top 10 Cities with the Lowest Male Poverty Level in New Hampshire are:
#1
0.0%
#2
0.0%
#3
0.0%
#4
0.0%
#5
0.0%
#6
0.0%
#7
0.0%
#8
0.0%
#9
0.0%
#10
1.3%
What city has the Lowest Male Poverty Level in New Hampshire?
Pittsfield has the Lowest Male Poverty Level in New Hampshire with 1.3%.
What is the Poverty Level Among Males in the State of New Hampshire?
Poverty Level Among Males in New Hampshire is 6.4%.
What is the Poverty Level Among Males in the United States?
Poverty Level Among Males in the United States is 11.3%.