Cities with the Lowest Male Poverty Level in Kansas
RELATED REPORTS & OPTIONS
Lowest Poverty | Male
Kansas
Compare Cities
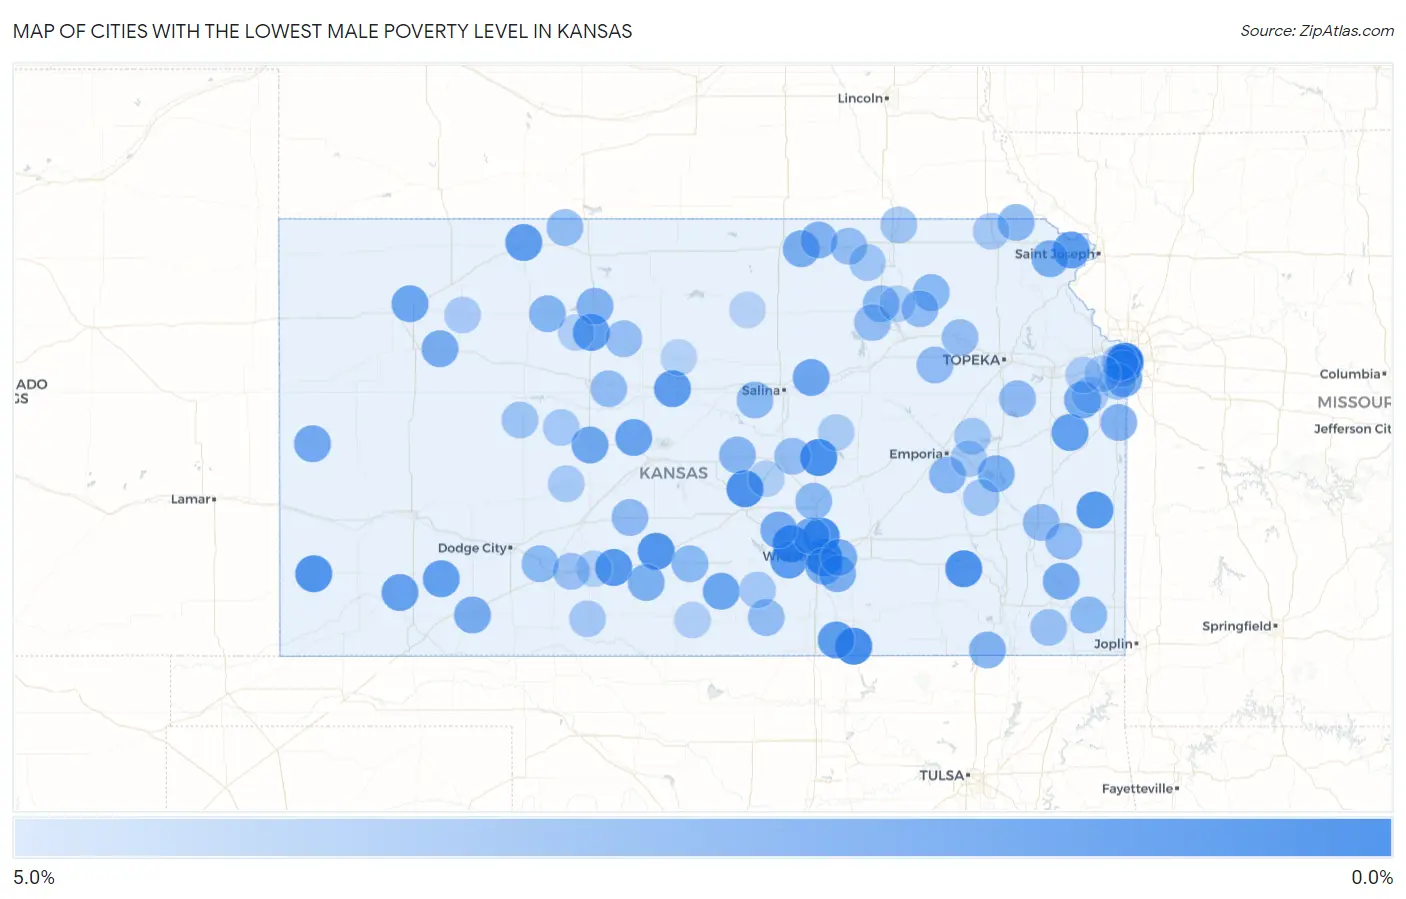
Map of Cities with the Lowest Male Poverty Level in Kansas
5.0%
0.0%
Cities with the Lowest Male Poverty Level in Kansas
| City | Male Poverty | vs State | vs National | |
| 1. | Eastborough | 0.29% | 10.4%(-10.1)#1 | 11.3%(-11.1)#48 |
| 2. | Colwich | 0.58% | 10.4%(-9.81)#2 | 11.3%(-10.8)#183 |
| 3. | Mission Hills | 0.62% | 10.4%(-9.77)#3 | 11.3%(-10.7)#211 |
| 4. | Parkerfield | 0.78% | 10.4%(-9.61)#4 | 11.3%(-10.6)#318 |
| 5. | Lehigh | 0.80% | 10.4%(-9.59)#5 | 11.3%(-10.5)#337 |
| 6. | Kechi | 0.89% | 10.4%(-9.50)#6 | 11.3%(-10.4)#407 |
| 7. | The Highlands | 0.93% | 10.4%(-9.46)#7 | 11.3%(-10.4)#438 |
| 8. | Fall River | 1.0% | 10.4%(-9.38)#8 | 11.3%(-10.3)#494 |
| 9. | Johnson City | 1.1% | 10.4%(-9.26)#9 | 11.3%(-10.2)#577 |
| 10. | Iuka | 1.2% | 10.4%(-9.21)#10 | 11.3%(-10.2)#631 |
| 11. | Haviland | 1.3% | 10.4%(-9.11)#11 | 11.3%(-10.1)#735 |
| 12. | Mapleton | 1.4% | 10.4%(-9.00)#12 | 11.3%(-9.95)#840 |
| 13. | Goddard | 1.4% | 10.4%(-8.96)#13 | 11.3%(-9.91)#874 |
| 14. | Geuda Springs | 1.5% | 10.4%(-8.91)#14 | 11.3%(-9.86)#920 |
| 15. | Troy | 1.5% | 10.4%(-8.87)#15 | 11.3%(-9.82)#952 |
| 16. | Norton | 1.5% | 10.4%(-8.85)#16 | 11.3%(-9.80)#972 |
| 17. | Dorrance | 1.6% | 10.4%(-8.83)#17 | 11.3%(-9.78)#997 |
| 18. | Plainville | 1.6% | 10.4%(-8.82)#18 | 11.3%(-9.77)#1,002 |
| 19. | Copeland | 1.6% | 10.4%(-8.76)#19 | 11.3%(-9.71)#1,052 |
| 20. | Rantoul | 1.6% | 10.4%(-8.75)#20 | 11.3%(-9.70)#1,066 |
| 21. | Satanta | 1.8% | 10.4%(-8.59)#21 | 11.3%(-9.55)#1,255 |
| 22. | Westwood Hills | 1.8% | 10.4%(-8.58)#22 | 11.3%(-9.53)#1,268 |
| 23. | Olmitz | 1.9% | 10.4%(-8.54)#23 | 11.3%(-9.49)#1,320 |
| 24. | Spivey | 2.0% | 10.4%(-8.43)#24 | 11.3%(-9.38)#1,437 |
| 25. | Gem | 2.0% | 10.4%(-8.43)#25 | 11.3%(-9.38)#1,438 |
| 26. | Solomon | 2.0% | 10.4%(-8.34)#26 | 11.3%(-9.29)#1,537 |
| 27. | Rush Center | 2.1% | 10.4%(-8.33)#27 | 11.3%(-9.28)#1,555 |
| 28. | Leawood | 2.1% | 10.4%(-8.28)#28 | 11.3%(-9.23)#1,611 |
| 29. | Tribune | 2.1% | 10.4%(-8.26)#29 | 11.3%(-9.21)#1,644 |
| 30. | Valley Center | 2.2% | 10.4%(-8.20)#30 | 11.3%(-9.15)#1,716 |
| 31. | Edgerton | 2.2% | 10.4%(-8.16)#31 | 11.3%(-9.11)#1,770 |
| 32. | Meade | 2.3% | 10.4%(-8.10)#32 | 11.3%(-9.05)#1,853 |
| 33. | Mount Hope | 2.3% | 10.4%(-8.09)#33 | 11.3%(-9.05)#1,854 |
| 34. | St Paul | 2.3% | 10.4%(-8.06)#34 | 11.3%(-9.02)#1,884 |
| 35. | Grinnell | 2.3% | 10.4%(-8.05)#35 | 11.3%(-9.00)#1,897 |
| 36. | Cuba | 2.4% | 10.4%(-8.03)#36 | 11.3%(-8.98)#1,935 |
| 37. | Mcconnell Afb | 2.4% | 10.4%(-8.00)#37 | 11.3%(-8.95)#1,983 |
| 38. | New Strawn | 2.4% | 10.4%(-7.96)#38 | 11.3%(-8.91)#2,028 |
| 39. | Rose Hill | 2.4% | 10.4%(-7.94)#39 | 11.3%(-8.90)#2,051 |
| 40. | Denton | 2.5% | 10.4%(-7.92)#40 | 11.3%(-8.87)#2,082 |
| 41. | Coats | 2.5% | 10.4%(-7.89)#41 | 11.3%(-8.84)#2,133 |
| 42. | Andover | 2.5% | 10.4%(-7.85)#42 | 11.3%(-8.80)#2,192 |
| 43. | Haddam | 2.6% | 10.4%(-7.76)#43 | 11.3%(-8.71)#2,312 |
| 44. | Westwood | 2.6% | 10.4%(-7.75)#44 | 11.3%(-8.70)#2,320 |
| 45. | Tyro | 2.7% | 10.4%(-7.72)#45 | 11.3%(-8.67)#2,358 |
| 46. | Louisburg | 2.7% | 10.4%(-7.70)#46 | 11.3%(-8.66)#2,378 |
| 47. | Stockton | 2.7% | 10.4%(-7.67)#47 | 11.3%(-8.62)#2,421 |
| 48. | Bogue | 2.8% | 10.4%(-7.61)#48 | 11.3%(-8.56)#2,492 |
| 49. | Olpe | 2.8% | 10.4%(-7.55)#49 | 11.3%(-8.50)#2,577 |
| 50. | Little River | 2.9% | 10.4%(-7.53)#50 | 11.3%(-8.48)#2,596 |
| 51. | Randolph | 2.9% | 10.4%(-7.49)#51 | 11.3%(-8.44)#2,655 |
| 52. | Wheaton | 2.9% | 10.4%(-7.45)#52 | 11.3%(-8.40)#2,717 |
| 53. | Reserve | 2.9% | 10.4%(-7.45)#53 | 11.3%(-8.40)#2,719 |
| 54. | Brookville | 3.0% | 10.4%(-7.43)#54 | 11.3%(-8.38)#2,737 |
| 55. | North Newton | 3.0% | 10.4%(-7.41)#55 | 11.3%(-8.37)#2,754 |
| 56. | Ford | 3.0% | 10.4%(-7.41)#56 | 11.3%(-8.36)#2,773 |
| 57. | Cunningham | 3.0% | 10.4%(-7.39)#57 | 11.3%(-8.34)#2,797 |
| 58. | West Mineral | 3.0% | 10.4%(-7.39)#58 | 11.3%(-8.34)#2,798 |
| 59. | Gas | 3.0% | 10.4%(-7.35)#59 | 11.3%(-8.30)#2,863 |
| 60. | Macksville | 3.1% | 10.4%(-7.32)#60 | 11.3%(-8.27)#2,905 |
| 61. | Overbrook | 3.1% | 10.4%(-7.31)#61 | 11.3%(-8.26)#2,918 |
| 62. | Westmoreland | 3.1% | 10.4%(-7.29)#62 | 11.3%(-8.24)#2,940 |
| 63. | Elsmore | 3.1% | 10.4%(-7.27)#63 | 11.3%(-8.22)#2,982 |
| 64. | Alma | 3.1% | 10.4%(-7.25)#64 | 11.3%(-8.20)#2,989 |
| 65. | Long Island | 3.2% | 10.4%(-7.22)#65 | 11.3%(-8.17)#3,033 |
| 66. | Argonia | 3.2% | 10.4%(-7.21)#66 | 11.3%(-8.16)#3,038 |
| 67. | Washington | 3.2% | 10.4%(-7.19)#67 | 11.3%(-8.14)#3,061 |
| 68. | Victoria | 3.2% | 10.4%(-7.18)#68 | 11.3%(-8.14)#3,072 |
| 69. | St Marys | 3.2% | 10.4%(-7.16)#69 | 11.3%(-8.11)#3,124 |
| 70. | Riley | 3.3% | 10.4%(-7.10)#70 | 11.3%(-8.06)#3,204 |
| 71. | Galva | 3.3% | 10.4%(-7.09)#71 | 11.3%(-8.04)#3,217 |
| 72. | Natoma | 3.3% | 10.4%(-7.07)#72 | 11.3%(-8.02)#3,263 |
| 73. | Mullinville | 3.4% | 10.4%(-7.01)#73 | 11.3%(-7.96)#3,351 |
| 74. | Prairie Village | 3.4% | 10.4%(-6.99)#74 | 11.3%(-7.94)#3,385 |
| 75. | Altamont | 3.4% | 10.4%(-6.97)#75 | 11.3%(-7.92)#3,411 |
| 76. | Ransom | 3.5% | 10.4%(-6.88)#76 | 11.3%(-7.83)#3,544 |
| 77. | Overland Park | 3.6% | 10.4%(-6.84)#77 | 11.3%(-7.79)#3,612 |
| 78. | Oketo | 3.6% | 10.4%(-6.82)#78 | 11.3%(-7.77)#3,643 |
| 79. | Mission | 3.6% | 10.4%(-6.80)#79 | 11.3%(-7.75)#3,664 |
| 80. | Barnes | 3.7% | 10.4%(-6.73)#80 | 11.3%(-7.68)#3,741 |
| 81. | Gridley | 3.7% | 10.4%(-6.69)#81 | 11.3%(-7.64)#3,824 |
| 82. | Reading | 3.7% | 10.4%(-6.64)#82 | 11.3%(-7.59)#3,904 |
| 83. | Mccracken | 3.8% | 10.4%(-6.62)#83 | 11.3%(-7.57)#3,932 |
| 84. | Sabetha | 3.8% | 10.4%(-6.61)#84 | 11.3%(-7.57)#3,934 |
| 85. | Norwich | 3.8% | 10.4%(-6.61)#85 | 11.3%(-7.56)#3,941 |
| 86. | Coldwater | 3.8% | 10.4%(-6.57)#86 | 11.3%(-7.52)#3,988 |
| 87. | Neosho Rapids | 3.8% | 10.4%(-6.56)#87 | 11.3%(-7.51)#4,006 |
| 88. | Burdett | 3.9% | 10.4%(-6.49)#88 | 11.3%(-7.45)#4,126 |
| 89. | Gardner | 3.9% | 10.4%(-6.49)#89 | 11.3%(-7.44)#4,130 |
| 90. | Hoxie | 3.9% | 10.4%(-6.47)#90 | 11.3%(-7.43)#4,149 |
| 91. | De Soto | 3.9% | 10.4%(-6.46)#91 | 11.3%(-7.41)#4,180 |
| 92. | Tampa | 4.0% | 10.4%(-6.39)#92 | 11.3%(-7.34)#4,294 |
| 93. | Inman | 4.1% | 10.4%(-6.32)#93 | 11.3%(-7.27)#4,392 |
| 94. | Greensburg | 4.1% | 10.4%(-6.26)#94 | 11.3%(-7.21)#4,484 |
| 95. | Olsburg | 4.2% | 10.4%(-6.22)#95 | 11.3%(-7.17)#4,543 |
| 96. | Sharon | 4.2% | 10.4%(-6.22)#96 | 11.3%(-7.17)#4,546 |
| 97. | Zurich | 4.2% | 10.4%(-6.22)#97 | 11.3%(-7.17)#4,552 |
| 98. | Lucas | 4.3% | 10.4%(-6.13)#98 | 11.3%(-7.09)#4,672 |
| 99. | Lenexa | 4.3% | 10.4%(-6.11)#99 | 11.3%(-7.06)#4,716 |
| 100. | Simpson | 4.3% | 10.4%(-6.04)#100 | 11.3%(-6.99)#4,820 |
Common Questions
What are the Top 10 Cities with the Lowest Male Poverty Level in Kansas?
Top 10 Cities with the Lowest Male Poverty Level in Kansas are:
#1
0.29%
#2
0.58%
#3
0.62%
#4
0.78%
#5
0.80%
#6
0.89%
#7
0.93%
#8
1.0%
#9
1.1%
#10
1.2%
What city has the Lowest Male Poverty Level in Kansas?
Eastborough has the Lowest Male Poverty Level in Kansas with 0.29%.
What is the Poverty Level Among Males in the State of Kansas?
Poverty Level Among Males in Kansas is 10.4%.
What is the Poverty Level Among Males in the United States?
Poverty Level Among Males in the United States is 11.3%.