Cities with the Lowest Male Poverty Level in Alabama
RELATED REPORTS & OPTIONS
Lowest Poverty | Male
Alabama
Compare Cities
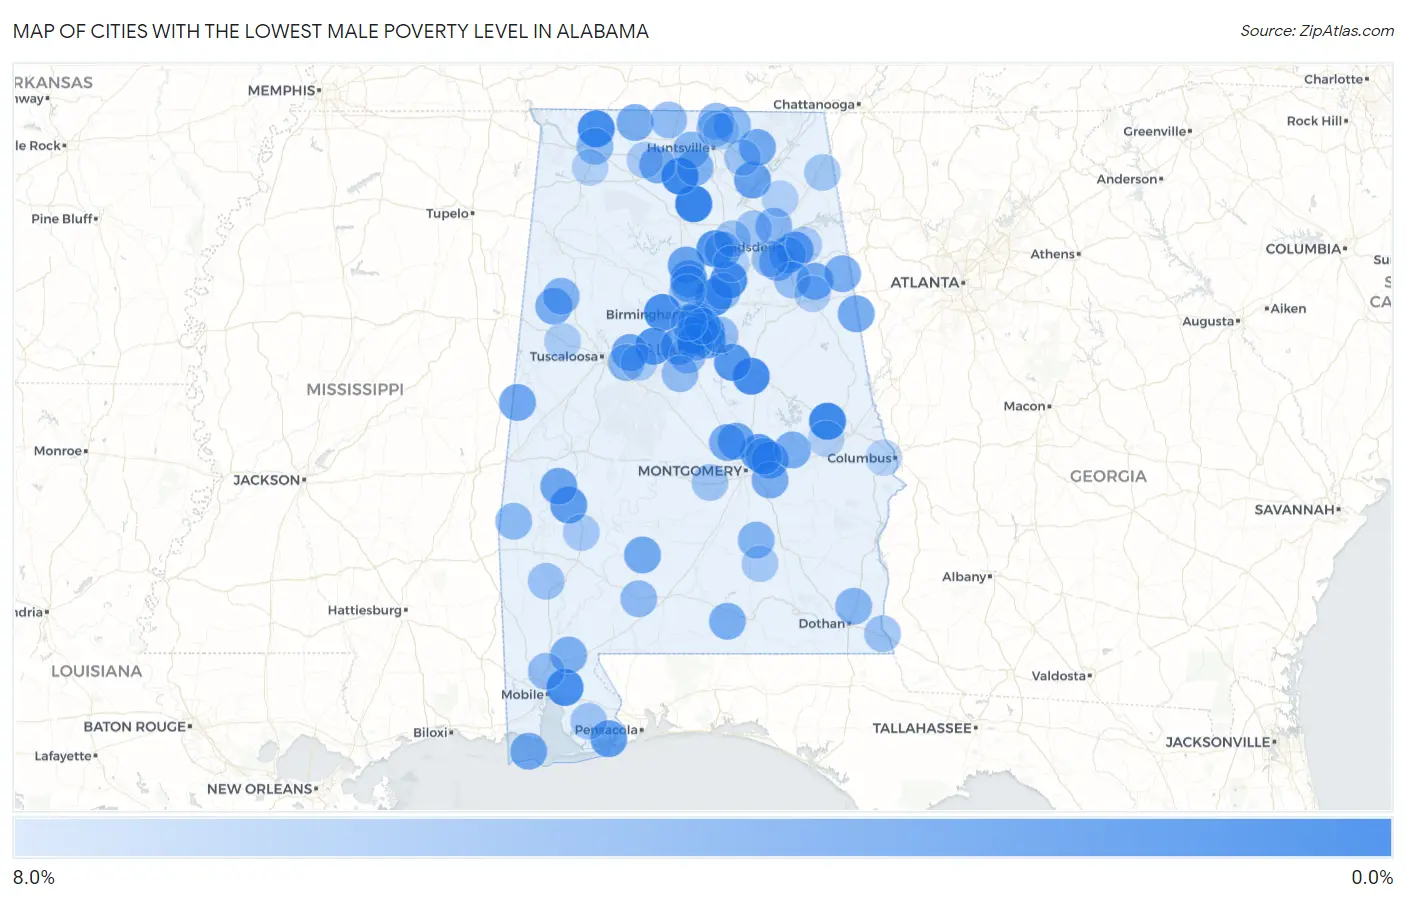
Map of Cities with the Lowest Male Poverty Level in Alabama
8.0%
0.0%
Cities with the Lowest Male Poverty Level in Alabama
| City | Male Poverty | vs State | vs National | |
| 1. | Eva | 0.29% | 13.9%(-13.7)#1 | 11.3%(-11.1)#49 |
| 2. | Waverly | 0.75% | 13.9%(-13.2)#2 | 11.3%(-10.6)#299 |
| 3. | Priceville | 0.78% | 13.9%(-13.2)#3 | 11.3%(-10.6)#320 |
| 4. | St Florian | 0.96% | 13.9%(-13.0)#4 | 11.3%(-10.4)#453 |
| 5. | Trussville | 1.00% | 13.9%(-12.9)#5 | 11.3%(-10.3)#484 |
| 6. | Stewartville | 1.0% | 13.9%(-12.9)#6 | 11.3%(-10.3)#497 |
| 7. | Spanish Fort | 1.1% | 13.9%(-12.8)#7 | 11.3%(-10.2)#591 |
| 8. | Sylvan Springs | 1.2% | 13.9%(-12.7)#8 | 11.3%(-10.1)#663 |
| 9. | Springville | 1.2% | 13.9%(-12.7)#9 | 11.3%(-10.1)#677 |
| 10. | Cleveland | 1.6% | 13.9%(-12.3)#10 | 11.3%(-9.70)#1,060 |
| 11. | Lake View | 1.6% | 13.9%(-12.3)#11 | 11.3%(-9.69)#1,074 |
| 12. | Fayetteville | 2.0% | 13.9%(-12.0)#12 | 11.3%(-9.39)#1,428 |
| 13. | Blue Ridge | 2.1% | 13.9%(-11.9)#13 | 11.3%(-9.26)#1,580 |
| 14. | Highland Lakes | 2.2% | 13.9%(-11.8)#14 | 11.3%(-9.16)#1,705 |
| 15. | Sweet Water | 2.4% | 13.9%(-11.6)#15 | 11.3%(-8.98)#1,937 |
| 16. | Emerald Mountain | 2.4% | 13.9%(-11.6)#16 | 11.3%(-8.97)#1,948 |
| 17. | Perdido Beach | 2.5% | 13.9%(-11.5)#17 | 11.3%(-8.88)#2,063 |
| 18. | Kimberly | 2.6% | 13.9%(-11.4)#18 | 11.3%(-8.75)#2,246 |
| 19. | Hokes Bluff | 2.7% | 13.9%(-11.3)#19 | 11.3%(-8.65)#2,382 |
| 20. | Mountain Brook | 2.7% | 13.9%(-11.2)#20 | 11.3%(-8.61)#2,428 |
| 21. | Helena | 2.7% | 13.9%(-11.2)#21 | 11.3%(-8.61)#2,430 |
| 22. | Smoke Rise | 2.8% | 13.9%(-11.1)#22 | 11.3%(-8.50)#2,569 |
| 23. | Grant | 2.9% | 13.9%(-11.1)#23 | 11.3%(-8.48)#2,604 |
| 24. | Deatsville | 2.9% | 13.9%(-11.0)#24 | 11.3%(-8.41)#2,687 |
| 25. | Chelsea | 3.0% | 13.9%(-11.0)#25 | 11.3%(-8.38)#2,735 |
| 26. | Brookwood | 3.0% | 13.9%(-11.0)#26 | 11.3%(-8.36)#2,768 |
| 27. | Myrtlewood | 3.1% | 13.9%(-10.8)#27 | 11.3%(-8.22)#2,977 |
| 28. | Indian Springs Village | 3.2% | 13.9%(-10.7)#28 | 11.3%(-8.10)#3,137 |
| 29. | White Plains | 3.2% | 13.9%(-10.7)#29 | 11.3%(-8.10)#3,141 |
| 30. | Geiger | 3.3% | 13.9%(-10.7)#30 | 11.3%(-8.06)#3,191 |
| 31. | Dauphin Island | 3.3% | 13.9%(-10.6)#31 | 11.3%(-8.00)#3,299 |
| 32. | Ranburne | 3.4% | 13.9%(-10.6)#32 | 11.3%(-7.97)#3,338 |
| 33. | Pleasant Groves | 3.4% | 13.9%(-10.6)#33 | 11.3%(-7.95)#3,366 |
| 34. | Beatrice | 3.4% | 13.9%(-10.5)#34 | 11.3%(-7.93)#3,396 |
| 35. | Vestavia Hills | 3.4% | 13.9%(-10.5)#35 | 11.3%(-7.91)#3,428 |
| 36. | Meadowbrook | 3.5% | 13.9%(-10.4)#36 | 11.3%(-7.81)#3,569 |
| 37. | Trinity | 3.6% | 13.9%(-10.4)#37 | 11.3%(-7.78)#3,624 |
| 38. | Southside | 3.6% | 13.9%(-10.4)#38 | 11.3%(-7.77)#3,625 |
| 39. | Pine Level | 3.6% | 13.9%(-10.3)#39 | 11.3%(-7.75)#3,670 |
| 40. | Kennedy | 3.7% | 13.9%(-10.3)#40 | 11.3%(-7.66)#3,789 |
| 41. | Pike Road | 3.7% | 13.9%(-10.2)#41 | 11.3%(-7.64)#3,812 |
| 42. | Rosa | 3.7% | 13.9%(-10.2)#42 | 11.3%(-7.62)#3,860 |
| 43. | Anderson | 3.7% | 13.9%(-10.2)#43 | 11.3%(-7.61)#3,871 |
| 44. | Edwardsville | 3.8% | 13.9%(-10.2)#44 | 11.3%(-7.57)#3,929 |
| 45. | Tallassee | 3.8% | 13.9%(-10.1)#45 | 11.3%(-7.52)#3,990 |
| 46. | Libertyville | 3.8% | 13.9%(-10.1)#46 | 11.3%(-7.50)#4,046 |
| 47. | Stockton | 3.9% | 13.9%(-10.1)#47 | 11.3%(-7.48)#4,064 |
| 48. | Glencoe | 3.9% | 13.9%(-10.1)#48 | 11.3%(-7.46)#4,102 |
| 49. | Triana | 4.0% | 13.9%(-9.98)#49 | 11.3%(-7.38)#4,227 |
| 50. | Redland | 4.0% | 13.9%(-9.96)#50 | 11.3%(-7.36)#4,253 |
| 51. | Morris | 4.0% | 13.9%(-9.89)#51 | 11.3%(-7.29)#4,363 |
| 52. | Belk | 4.3% | 13.9%(-9.66)#52 | 11.3%(-7.06)#4,707 |
| 53. | Petrey | 4.3% | 13.9%(-9.59)#53 | 11.3%(-6.99)#4,822 |
| 54. | Whitesboro | 4.4% | 13.9%(-9.53)#54 | 11.3%(-6.93)#4,917 |
| 55. | Headland | 4.4% | 13.9%(-9.52)#55 | 11.3%(-6.92)#4,925 |
| 56. | Madison | 4.5% | 13.9%(-9.43)#56 | 11.3%(-6.83)#5,058 |
| 57. | Coaling | 4.6% | 13.9%(-9.33)#57 | 11.3%(-6.73)#5,224 |
| 58. | Hoover | 4.6% | 13.9%(-9.29)#58 | 11.3%(-6.69)#5,284 |
| 59. | Needham | 4.7% | 13.9%(-9.29)#59 | 11.3%(-6.69)#5,293 |
| 60. | Eagle Point | 4.7% | 13.9%(-9.27)#60 | 11.3%(-6.68)#5,308 |
| 61. | New Market | 4.7% | 13.9%(-9.27)#61 | 11.3%(-6.67)#5,313 |
| 62. | Muscle Shoals | 4.7% | 13.9%(-9.23)#62 | 11.3%(-6.63)#5,391 |
| 63. | Hazel Green | 4.7% | 13.9%(-9.21)#63 | 11.3%(-6.61)#5,420 |
| 64. | Repton | 4.8% | 13.9%(-9.12)#64 | 11.3%(-6.52)#5,555 |
| 65. | Alabaster | 4.8% | 13.9%(-9.11)#65 | 11.3%(-6.51)#5,565 |
| 66. | Pelham | 5.0% | 13.9%(-8.98)#66 | 11.3%(-6.38)#5,732 |
| 67. | Wilton | 5.0% | 13.9%(-8.93)#67 | 11.3%(-6.33)#5,823 |
| 68. | Satsuma | 5.0% | 13.9%(-8.92)#68 | 11.3%(-6.32)#5,834 |
| 69. | Elkmont | 5.0% | 13.9%(-8.90)#69 | 11.3%(-6.30)#5,865 |
| 70. | Meridianville | 5.1% | 13.9%(-8.83)#70 | 11.3%(-6.23)#5,966 |
| 71. | Argo | 5.2% | 13.9%(-8.78)#71 | 11.3%(-6.19)#6,034 |
| 72. | Alexandria | 5.2% | 13.9%(-8.78)#72 | 11.3%(-6.18)#6,045 |
| 73. | Westover | 5.2% | 13.9%(-8.75)#73 | 11.3%(-6.15)#6,104 |
| 74. | Rainbow City | 5.3% | 13.9%(-8.64)#74 | 11.3%(-6.04)#6,252 |
| 75. | Remlap | 5.4% | 13.9%(-8.56)#75 | 11.3%(-5.96)#6,362 |
| 76. | St Stephens | 5.4% | 13.9%(-8.53)#76 | 11.3%(-5.94)#6,400 |
| 77. | Gordon | 5.5% | 13.9%(-8.45)#77 | 11.3%(-5.85)#6,534 |
| 78. | Gardendale | 5.5% | 13.9%(-8.45)#78 | 11.3%(-5.85)#6,537 |
| 79. | Paint Rock | 5.5% | 13.9%(-8.44)#79 | 11.3%(-5.84)#6,559 |
| 80. | New Union | 5.5% | 13.9%(-8.42)#80 | 11.3%(-5.82)#6,579 |
| 81. | Summerdale | 5.5% | 13.9%(-8.42)#81 | 11.3%(-5.82)#6,583 |
| 82. | Susan Moore | 5.7% | 13.9%(-8.25)#82 | 11.3%(-5.65)#6,850 |
| 83. | Lowndesboro | 5.7% | 13.9%(-8.23)#83 | 11.3%(-5.63)#6,882 |
| 84. | Valley Head | 5.8% | 13.9%(-8.11)#84 | 11.3%(-5.51)#7,064 |
| 85. | Glenwood | 6.0% | 13.9%(-7.99)#85 | 11.3%(-5.39)#7,220 |
| 86. | Thomasville | 6.0% | 13.9%(-7.98)#86 | 11.3%(-5.39)#7,227 |
| 87. | Brook Highland | 6.0% | 13.9%(-7.97)#87 | 11.3%(-5.37)#7,249 |
| 88. | Homewood | 6.1% | 13.9%(-7.82)#88 | 11.3%(-5.22)#7,454 |
| 89. | Ballplay | 6.2% | 13.9%(-7.75)#89 | 11.3%(-5.15)#7,558 |
| 90. | Hillsboro | 6.2% | 13.9%(-7.73)#90 | 11.3%(-5.13)#7,572 |
| 91. | Vance | 6.2% | 13.9%(-7.70)#91 | 11.3%(-5.11)#7,610 |
| 92. | Gordo | 6.3% | 13.9%(-7.67)#92 | 11.3%(-5.07)#7,673 |
| 93. | Choccolocco | 6.4% | 13.9%(-7.50)#93 | 11.3%(-4.90)#7,914 |
| 94. | Mccalla | 6.5% | 13.9%(-7.46)#94 | 11.3%(-4.87)#7,951 |
| 95. | Loachapoka | 6.5% | 13.9%(-7.46)#95 | 11.3%(-4.86)#7,961 |
| 96. | Littleville | 6.5% | 13.9%(-7.44)#96 | 11.3%(-4.84)#7,997 |
| 97. | Geraldine | 6.6% | 13.9%(-7.36)#97 | 11.3%(-4.76)#8,105 |
| 98. | Highland Lake | 6.7% | 13.9%(-7.24)#98 | 11.3%(-4.65)#8,287 |
| 99. | Ladonia | 6.7% | 13.9%(-7.21)#99 | 11.3%(-4.61)#8,351 |
| 100. | Moores Mill | 6.9% | 13.9%(-7.07)#100 | 11.3%(-4.48)#8,559 |
Common Questions
What are the Top 10 Cities with the Lowest Male Poverty Level in Alabama?
Top 10 Cities with the Lowest Male Poverty Level in Alabama are:
#1
0.29%
#2
0.75%
#3
0.78%
#4
0.96%
#5
1.00%
#6
1.0%
#7
1.1%
#8
1.2%
#9
1.2%
#10
1.6%
What city has the Lowest Male Poverty Level in Alabama?
Eva has the Lowest Male Poverty Level in Alabama with 0.29%.
What is the Poverty Level Among Males in the State of Alabama?
Poverty Level Among Males in Alabama is 13.9%.
What is the Poverty Level Among Males in the United States?
Poverty Level Among Males in the United States is 11.3%.