Cities with the Lowest Male Poverty Level in Connecticut
RELATED REPORTS & OPTIONS
Lowest Poverty | Male
Connecticut
Compare Cities
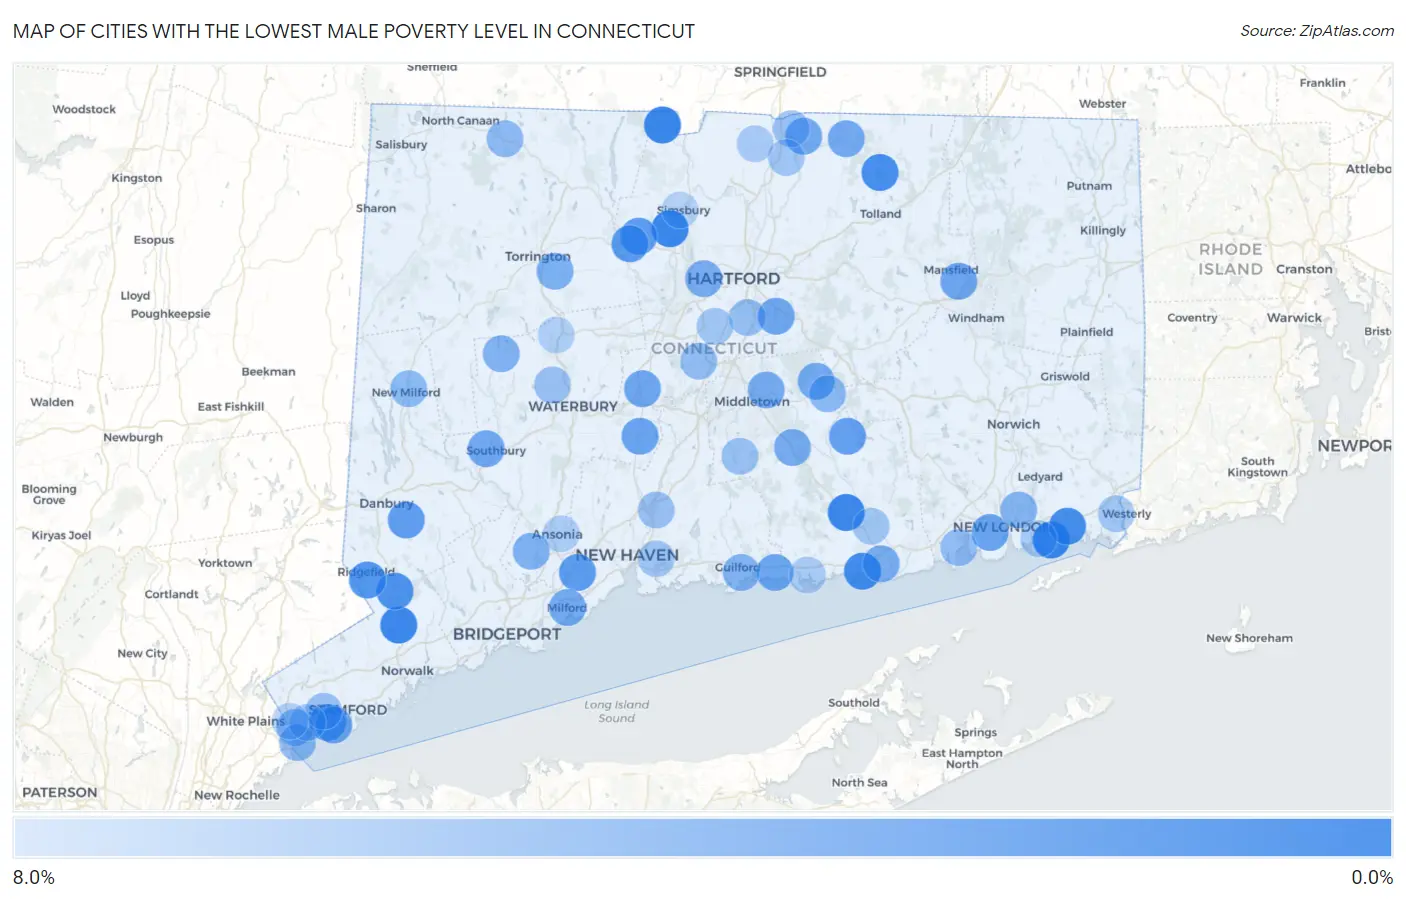
Map of Cities with the Lowest Male Poverty Level in Connecticut
8.0%
0.0%
Cities with the Lowest Male Poverty Level in Connecticut
| City | Male Poverty | vs State | vs National | |
| 1. | Noank | 0.13% | 9.1%(-9.01)#1 | 11.3%(-11.2)#12 |
| 2. | Weston | 0.21% | 9.1%(-8.93)#2 | 11.3%(-11.1)#31 |
| 3. | Weatogue | 0.22% | 9.1%(-8.92)#3 | 11.3%(-11.1)#34 |
| 4. | North Granby | 0.25% | 9.1%(-8.89)#4 | 11.3%(-11.1)#39 |
| 5. | Route 7 Gateway | 0.26% | 9.1%(-8.88)#5 | 11.3%(-11.1)#40 |
| 6. | Deep River Center | 0.43% | 9.1%(-8.71)#6 | 11.3%(-10.9)#109 |
| 7. | Wilton Center | 0.43% | 9.1%(-8.71)#7 | 11.3%(-10.9)#112 |
| 8. | East | 0.71% | 9.1%(-8.43)#8 | 11.3%(-10.6)#267 |
| 9. | Saybrook Manor | 0.81% | 9.1%(-8.33)#9 | 11.3%(-10.5)#340 |
| 10. | Greens Farms | 0.83% | 9.1%(-8.32)#10 | 11.3%(-10.5)#355 |
| 11. | Mystic | 0.91% | 9.1%(-8.23)#11 | 11.3%(-10.4)#421 |
| 12. | Crystal Lake | 1.0% | 9.1%(-8.11)#12 | 11.3%(-10.3)#511 |
| 13. | Westport | 1.1% | 9.1%(-8.00)#13 | 11.3%(-10.2)#587 |
| 14. | Georgetown | 1.4% | 9.1%(-7.78)#14 | 11.3%(-9.98)#813 |
| 15. | Newtown Borough | 1.6% | 9.1%(-7.58)#15 | 11.3%(-9.78)#1,000 |
| 16. | New Canaan | 1.7% | 9.1%(-7.46)#16 | 11.3%(-9.66)#1,123 |
| 17. | Northford | 1.7% | 9.1%(-7.41)#17 | 11.3%(-9.62)#1,175 |
| 18. | Ridgefield | 1.7% | 9.1%(-7.40)#18 | 11.3%(-9.60)#1,197 |
| 19. | Darien Downtown | 1.9% | 9.1%(-7.29)#19 | 11.3%(-9.49)#1,325 |
| 20. | Plattsville | 1.9% | 9.1%(-7.21)#20 | 11.3%(-9.41)#1,404 |
| 21. | Bantam Borough | 2.0% | 9.1%(-7.15)#21 | 11.3%(-9.35)#1,470 |
| 22. | Orange | 2.2% | 9.1%(-6.91)#22 | 11.3%(-9.11)#1,777 |
| 23. | Saugatuck | 2.2% | 9.1%(-6.89)#23 | 11.3%(-9.09)#1,797 |
| 24. | Canton Valley | 2.2% | 9.1%(-6.89)#24 | 11.3%(-9.09)#1,798 |
| 25. | Collinsville | 2.3% | 9.1%(-6.84)#25 | 11.3%(-9.04)#1,865 |
| 26. | Riverside | 2.3% | 9.1%(-6.80)#26 | 11.3%(-9.00)#1,899 |
| 27. | Bethel | 2.5% | 9.1%(-6.65)#27 | 11.3%(-8.85)#2,114 |
| 28. | Candlewood Orchards | 2.6% | 9.1%(-6.59)#28 | 11.3%(-8.79)#2,213 |
| 29. | Moodus | 2.8% | 9.1%(-6.34)#29 | 11.3%(-8.54)#2,519 |
| 30. | Old Hill | 3.0% | 9.1%(-6.11)#30 | 11.3%(-8.31)#2,839 |
| 31. | Sandy Hook | 3.2% | 9.1%(-5.90)#31 | 11.3%(-8.10)#3,127 |
| 32. | Cheshire Village | 3.2% | 9.1%(-5.90)#32 | 11.3%(-8.10)#3,128 |
| 33. | Waterford | 3.2% | 9.1%(-5.90)#33 | 11.3%(-8.10)#3,135 |
| 34. | Madison Center | 3.3% | 9.1%(-5.85)#34 | 11.3%(-8.05)#3,215 |
| 35. | Old Greenwich | 3.4% | 9.1%(-5.73)#35 | 11.3%(-7.93)#3,393 |
| 36. | Glastonbury Center | 3.4% | 9.1%(-5.72)#36 | 11.3%(-7.92)#3,415 |
| 37. | Plantsville | 3.5% | 9.1%(-5.67)#37 | 11.3%(-7.87)#3,503 |
| 38. | Mansfield Center | 3.5% | 9.1%(-5.65)#38 | 11.3%(-7.85)#3,526 |
| 39. | Lakes West | 3.6% | 9.1%(-5.55)#39 | 11.3%(-7.75)#3,669 |
| 40. | Heritage Village | 3.6% | 9.1%(-5.55)#40 | 11.3%(-7.75)#3,671 |
| 41. | Lake Pocotopaug | 3.7% | 9.1%(-5.48)#41 | 11.3%(-7.68)#3,739 |
| 42. | Poplar Plains | 3.7% | 9.1%(-5.48)#42 | 11.3%(-7.68)#3,755 |
| 43. | Hazardville | 3.7% | 9.1%(-5.46)#43 | 11.3%(-7.66)#3,785 |
| 44. | Trumbull Center | 3.7% | 9.1%(-5.45)#44 | 11.3%(-7.65)#3,804 |
| 45. | Somers | 3.7% | 9.1%(-5.44)#45 | 11.3%(-7.64)#3,818 |
| 46. | Woodmont Borough | 3.7% | 9.1%(-5.42)#46 | 11.3%(-7.62)#3,854 |
| 47. | Ball Pond | 3.8% | 9.1%(-5.32)#47 | 11.3%(-7.53)#3,983 |
| 48. | Milford City Balance | 3.8% | 9.1%(-5.32)#48 | 11.3%(-7.52)#3,985 |
| 49. | Higganum | 3.9% | 9.1%(-5.20)#49 | 11.3%(-7.40)#4,200 |
| 50. | Portland | 4.0% | 9.1%(-5.17)#50 | 11.3%(-7.37)#4,238 |
| 51. | Coleytown | 4.0% | 9.1%(-5.14)#51 | 11.3%(-7.34)#4,299 |
| 52. | Old Saybrook Center | 4.0% | 9.1%(-5.10)#52 | 11.3%(-7.30)#4,349 |
| 53. | West Hartford | 4.1% | 9.1%(-5.07)#53 | 11.3%(-7.27)#4,394 |
| 54. | Mamanasco Lake | 4.2% | 9.1%(-4.94)#54 | 11.3%(-7.14)#4,610 |
| 55. | Northwest Harwinton | 4.4% | 9.1%(-4.79)#55 | 11.3%(-6.99)#4,829 |
| 56. | Shelton | 4.5% | 9.1%(-4.65)#56 | 11.3%(-6.85)#5,033 |
| 57. | Naugatuck Borough | 4.5% | 9.1%(-4.61)#57 | 11.3%(-6.81)#5,076 |
| 58. | Bethlehem Village | 4.5% | 9.1%(-4.59)#58 | 11.3%(-6.79)#5,127 |
| 59. | Noroton | 4.6% | 9.1%(-4.54)#59 | 11.3%(-6.74)#5,206 |
| 60. | Guilford Center | 4.6% | 9.1%(-4.49)#60 | 11.3%(-6.69)#5,286 |
| 61. | Gaylordsville | 4.7% | 9.1%(-4.44)#61 | 11.3%(-6.64)#5,373 |
| 62. | Conning Towers Nautilus Park | 4.8% | 9.1%(-4.36)#62 | 11.3%(-6.56)#5,501 |
| 63. | Oronoque | 4.9% | 9.1%(-4.25)#63 | 11.3%(-6.45)#5,661 |
| 64. | Pemberwick | 5.0% | 9.1%(-4.17)#64 | 11.3%(-6.37)#5,754 |
| 65. | Byram | 5.0% | 9.1%(-4.10)#65 | 11.3%(-6.30)#5,856 |
| 66. | New Milford | 5.2% | 9.1%(-3.95)#66 | 11.3%(-6.15)#6,105 |
| 67. | East Hampton | 5.2% | 9.1%(-3.92)#67 | 11.3%(-6.12)#6,142 |
| 68. | Litchfield Borough | 5.3% | 9.1%(-3.80)#68 | 11.3%(-6.00)#6,308 |
| 69. | Norfolk | 5.3% | 9.1%(-3.80)#69 | 11.3%(-6.00)#6,309 |
| 70. | Tashua | 5.4% | 9.1%(-3.75)#70 | 11.3%(-5.95)#6,376 |
| 71. | Ridgebury | 5.5% | 9.1%(-3.67)#71 | 11.3%(-5.88)#6,502 |
| 72. | Stepney | 5.5% | 9.1%(-3.65)#72 | 11.3%(-5.85)#6,540 |
| 73. | Kensington | 5.6% | 9.1%(-3.54)#73 | 11.3%(-5.74)#6,718 |
| 74. | Inglenook | 5.7% | 9.1%(-3.47)#74 | 11.3%(-5.67)#6,808 |
| 75. | Niantic | 5.7% | 9.1%(-3.46)#75 | 11.3%(-5.66)#6,825 |
| 76. | Compo | 5.8% | 9.1%(-3.35)#76 | 11.3%(-5.55)#7,002 |
| 77. | Staples | 5.9% | 9.1%(-3.29)#77 | 11.3%(-5.49)#7,100 |
| 78. | Wethersfield | 5.9% | 9.1%(-3.23)#78 | 11.3%(-5.43)#7,179 |
| 79. | Oakville | 5.9% | 9.1%(-3.20)#79 | 11.3%(-5.40)#7,204 |
| 80. | Sherwood Manor | 6.0% | 9.1%(-3.19)#80 | 11.3%(-5.39)#7,223 |
| 81. | North Haven | 6.0% | 9.1%(-3.12)#81 | 11.3%(-5.32)#7,309 |
| 82. | Cos Cob | 6.0% | 9.1%(-3.09)#82 | 11.3%(-5.29)#7,348 |
| 83. | Durham | 6.2% | 9.1%(-2.98)#83 | 11.3%(-5.18)#7,503 |
| 84. | East Haven | 6.5% | 9.1%(-2.69)#84 | 11.3%(-4.89)#7,920 |
| 85. | Southwood Acres | 6.5% | 9.1%(-2.67)#85 | 11.3%(-4.87)#7,948 |
| 86. | Pawcatuck | 6.6% | 9.1%(-2.55)#86 | 11.3%(-4.75)#8,111 |
| 87. | Newington | 6.6% | 9.1%(-2.52)#87 | 11.3%(-4.72)#8,146 |
| 88. | Essex Village | 6.6% | 9.1%(-2.51)#88 | 11.3%(-4.71)#8,168 |
| 89. | Greenwich | 6.7% | 9.1%(-2.49)#89 | 11.3%(-4.69)#8,199 |
| 90. | Hawleyville | 6.8% | 9.1%(-2.38)#90 | 11.3%(-4.58)#8,389 |
| 91. | Tokeneke | 6.8% | 9.1%(-2.34)#91 | 11.3%(-4.55)#8,444 |
| 92. | Daniels Farm | 7.0% | 9.1%(-2.19)#92 | 11.3%(-4.39)#8,681 |
| 93. | Suffield Depot | 7.0% | 9.1%(-2.16)#93 | 11.3%(-4.36)#8,734 |
| 94. | Clinton | 7.1% | 9.1%(-2.04)#94 | 11.3%(-4.24)#8,882 |
| 95. | Poquonock Bridge | 7.1% | 9.1%(-2.03)#95 | 11.3%(-4.23)#8,901 |
| 96. | Stratford Downtown | 7.1% | 9.1%(-2.03)#96 | 11.3%(-4.23)#8,904 |
| 97. | Ansonia | 7.3% | 9.1%(-1.87)#97 | 11.3%(-4.07)#9,162 |
| 98. | Thomaston | 7.4% | 9.1%(-1.70)#98 | 11.3%(-3.90)#9,386 |
| 99. | Glenville | 7.5% | 9.1%(-1.60)#99 | 11.3%(-3.80)#9,514 |
| 100. | Simsbury Center | 7.8% | 9.1%(-1.37)#100 | 11.3%(-3.57)#9,830 |
1
2Common Questions
What are the Top 10 Cities with the Lowest Male Poverty Level in Connecticut?
Top 10 Cities with the Lowest Male Poverty Level in Connecticut are:
#1
0.13%
#2
0.22%
#3
0.25%
#4
0.43%
#5
0.43%
#6
0.81%
#7
0.91%
#8
1.0%
#9
1.4%
#10
1.7%
What city has the Lowest Male Poverty Level in Connecticut?
Noank has the Lowest Male Poverty Level in Connecticut with 0.13%.
What is the Poverty Level Among Males in the State of Connecticut?
Poverty Level Among Males in Connecticut is 9.1%.
What is the Poverty Level Among Males in the United States?
Poverty Level Among Males in the United States is 11.3%.