Cities with the Lowest Male Poverty Level in West Virginia
RELATED REPORTS & OPTIONS
Lowest Poverty | Male
West Virginia
Compare Cities
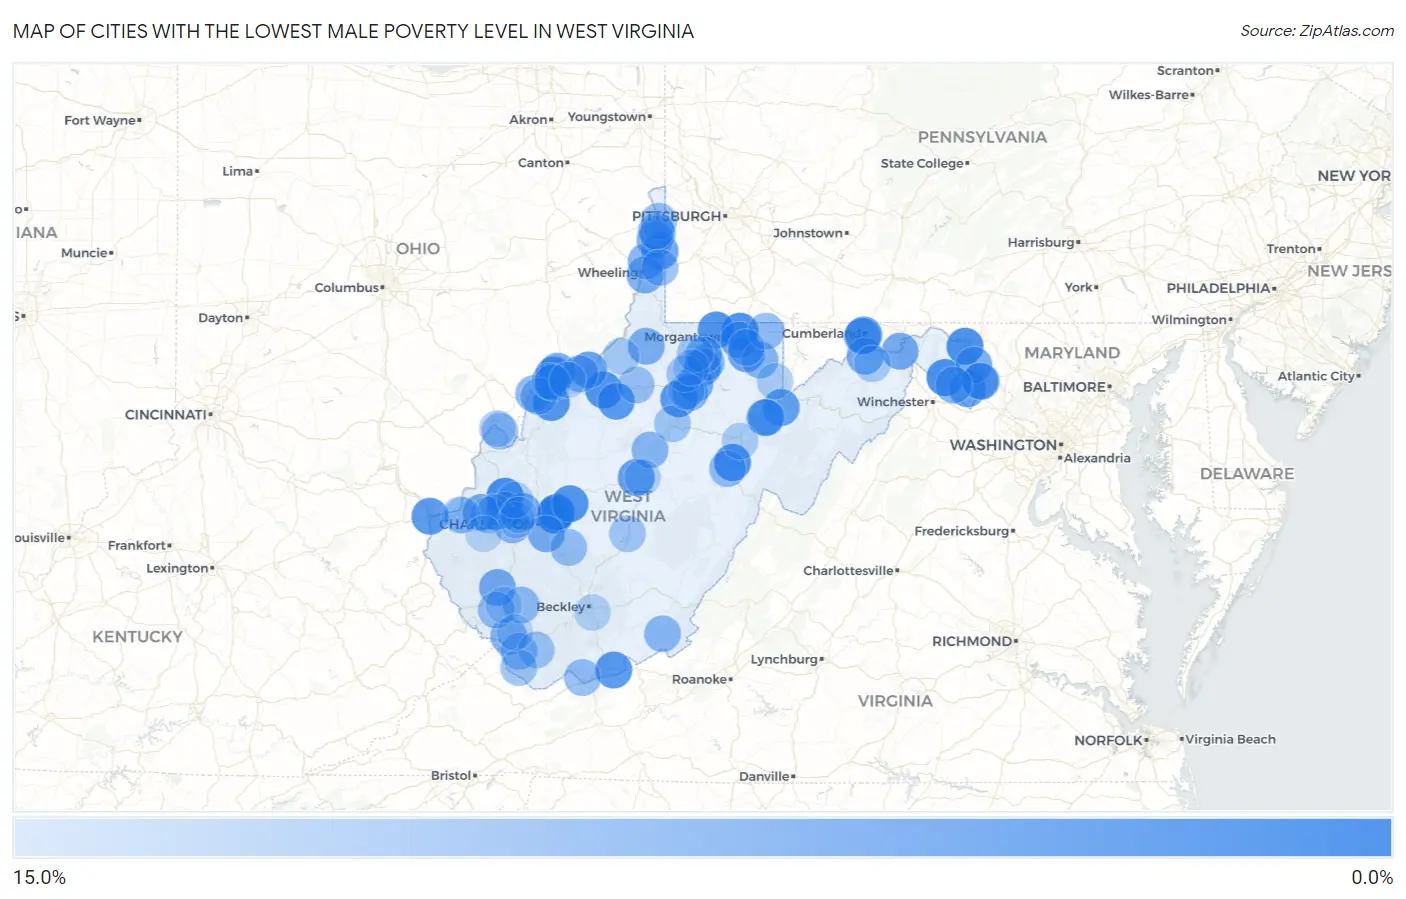
Map of Cities with the Lowest Male Poverty Level in West Virginia
15.0%
0.0%
Cities with the Lowest Male Poverty Level in West Virginia
| City | Male Poverty | vs State | vs National | |
| 1. | Pinch | 0.29% | 15.2%(-14.9)#1 | 11.3%(-11.1)#51 |
| 2. | Eleanor | 1.5% | 15.2%(-13.7)#2 | 11.3%(-9.84)#940 |
| 3. | Cheat Lake | 1.8% | 15.2%(-13.4)#3 | 11.3%(-9.56)#1,236 |
| 4. | Inwood | 1.8% | 15.2%(-13.4)#4 | 11.3%(-9.54)#1,263 |
| 5. | Falling Waters | 2.1% | 15.2%(-13.2)#5 | 11.3%(-9.29)#1,547 |
| 6. | Ellenboro | 2.2% | 15.2%(-13.0)#6 | 11.3%(-9.14)#1,727 |
| 7. | Boaz | 2.3% | 15.2%(-12.9)#7 | 11.3%(-9.02)#1,883 |
| 8. | Valley Bend | 2.3% | 15.2%(-12.9)#8 | 11.3%(-9.00)#1,902 |
| 9. | Elkview | 2.4% | 15.2%(-12.8)#9 | 11.3%(-8.97)#1,949 |
| 10. | Cassville | 2.4% | 15.2%(-12.8)#10 | 11.3%(-8.92)#2,025 |
| 11. | Clendenin | 2.6% | 15.2%(-12.6)#11 | 11.3%(-8.77)#2,228 |
| 12. | Mineralwells | 2.6% | 15.2%(-12.6)#12 | 11.3%(-8.76)#2,241 |
| 13. | West Milford | 3.0% | 15.2%(-12.2)#13 | 11.3%(-8.33)#2,815 |
| 14. | Ridgeley | 3.1% | 15.2%(-12.1)#14 | 11.3%(-8.23)#2,947 |
| 15. | Oakvale | 3.1% | 15.2%(-12.1)#15 | 11.3%(-8.22)#2,970 |
| 16. | Kenova | 3.2% | 15.2%(-12.0)#16 | 11.3%(-8.15)#3,053 |
| 17. | Pullman | 3.3% | 15.2%(-11.9)#17 | 11.3%(-8.04)#3,239 |
| 18. | White Hall | 3.6% | 15.2%(-11.7)#18 | 11.3%(-7.78)#3,617 |
| 19. | Thomas | 4.0% | 15.2%(-11.2)#19 | 11.3%(-7.31)#4,329 |
| 20. | Gassaway | 4.1% | 15.2%(-11.1)#20 | 11.3%(-7.27)#4,391 |
| 21. | St Marys | 4.3% | 15.2%(-10.9)#21 | 11.3%(-7.05)#4,729 |
| 22. | Teays Valley | 4.5% | 15.2%(-10.8)#22 | 11.3%(-6.88)#4,987 |
| 23. | Charles Town | 4.8% | 15.2%(-10.5)#23 | 11.3%(-6.58)#5,449 |
| 24. | Hambleton | 4.8% | 15.2%(-10.5)#24 | 11.3%(-6.58)#5,463 |
| 25. | Bethany | 4.9% | 15.2%(-10.3)#25 | 11.3%(-6.46)#5,633 |
| 26. | Reedsville | 4.9% | 15.2%(-10.3)#26 | 11.3%(-6.46)#5,636 |
| 27. | Bridgeport | 5.4% | 15.2%(-9.83)#27 | 11.3%(-5.95)#6,377 |
| 28. | Paw Paw | 5.4% | 15.2%(-9.80)#28 | 11.3%(-5.92)#6,424 |
| 29. | Milton | 5.5% | 15.2%(-9.70)#29 | 11.3%(-5.83)#6,572 |
| 30. | Mitchell Heights | 5.5% | 15.2%(-9.69)#30 | 11.3%(-5.82)#6,587 |
| 31. | Harpers Ferry | 5.6% | 15.2%(-9.62)#31 | 11.3%(-5.75)#6,702 |
| 32. | Williamstown | 5.6% | 15.2%(-9.60)#32 | 11.3%(-5.72)#6,741 |
| 33. | Cross Lanes | 5.7% | 15.2%(-9.48)#33 | 11.3%(-5.60)#6,914 |
| 34. | Brookhaven | 5.7% | 15.2%(-9.48)#34 | 11.3%(-5.60)#6,921 |
| 35. | Shepherdstown | 5.8% | 15.2%(-9.47)#35 | 11.3%(-5.59)#6,951 |
| 36. | Wellsburg | 5.8% | 15.2%(-9.39)#36 | 11.3%(-5.51)#7,061 |
| 37. | Fort Ashby | 6.0% | 15.2%(-9.26)#37 | 11.3%(-5.38)#7,229 |
| 38. | Rand | 6.0% | 15.2%(-9.21)#38 | 11.3%(-5.33)#7,293 |
| 39. | Bethlehem | 6.2% | 15.2%(-9.02)#39 | 11.3%(-5.14)#7,565 |
| 40. | Pine Grove | 6.2% | 15.2%(-8.97)#40 | 11.3%(-5.09)#7,645 |
| 41. | Carpendale | 6.3% | 15.2%(-8.95)#41 | 11.3%(-5.07)#7,674 |
| 42. | Gilbert Creek | 6.7% | 15.2%(-8.53)#42 | 11.3%(-4.66)#8,261 |
| 43. | Bolivar | 6.7% | 15.2%(-8.50)#43 | 11.3%(-4.62)#8,322 |
| 44. | Middleway | 6.7% | 15.2%(-8.47)#44 | 11.3%(-4.59)#8,371 |
| 45. | Belmont | 6.8% | 15.2%(-8.44)#45 | 11.3%(-4.56)#8,415 |
| 46. | Clearview | 6.9% | 15.2%(-8.33)#46 | 11.3%(-4.46)#8,584 |
| 47. | Pleasant Valley | 7.1% | 15.2%(-8.11)#47 | 11.3%(-4.24)#8,888 |
| 48. | Barrackville | 7.1% | 15.2%(-8.08)#48 | 11.3%(-4.21)#8,924 |
| 49. | Kingwood | 7.2% | 15.2%(-7.97)#49 | 11.3%(-4.10)#9,104 |
| 50. | Stonewood | 7.3% | 15.2%(-7.95)#50 | 11.3%(-4.07)#9,151 |
| 51. | Washington | 7.3% | 15.2%(-7.91)#51 | 11.3%(-4.04)#9,200 |
| 52. | Tornado | 7.3% | 15.2%(-7.88)#52 | 11.3%(-4.00)#9,239 |
| 53. | Hendricks | 7.4% | 15.2%(-7.85)#53 | 11.3%(-3.98)#9,277 |
| 54. | Burnsville | 7.4% | 15.2%(-7.78)#54 | 11.3%(-3.91)#9,372 |
| 55. | Lubeck | 7.4% | 15.2%(-7.78)#55 | 11.3%(-3.90)#9,383 |
| 56. | Union | 7.5% | 15.2%(-7.71)#56 | 11.3%(-3.83)#9,469 |
| 57. | Vienna | 7.7% | 15.2%(-7.50)#57 | 11.3%(-3.62)#9,765 |
| 58. | Robinette | 8.2% | 15.2%(-7.05)#58 | 11.3%(-3.18)#10,352 |
| 59. | Brandonville | 8.2% | 15.2%(-7.05)#59 | 11.3%(-3.18)#10,353 |
| 60. | Weirton | 8.3% | 15.2%(-6.91)#60 | 11.3%(-3.04)#10,514 |
| 61. | Mill Creek | 8.3% | 15.2%(-6.90)#61 | 11.3%(-3.03)#10,521 |
| 62. | Brush Fork | 8.3% | 15.2%(-6.90)#62 | 11.3%(-3.03)#10,528 |
| 63. | Omar | 8.3% | 15.2%(-6.88)#63 | 11.3%(-3.01)#10,558 |
| 64. | Hooverson Heights | 8.4% | 15.2%(-6.81)#64 | 11.3%(-2.93)#10,659 |
| 65. | Iaeger | 8.5% | 15.2%(-6.73)#65 | 11.3%(-2.85)#10,755 |
| 66. | Hinkleville | 8.5% | 15.2%(-6.67)#66 | 11.3%(-2.80)#10,832 |
| 67. | Handley | 8.6% | 15.2%(-6.67)#67 | 11.3%(-2.79)#10,841 |
| 68. | Valley Grove | 8.7% | 15.2%(-6.51)#68 | 11.3%(-2.63)#11,024 |
| 69. | Masontown | 8.8% | 15.2%(-6.45)#69 | 11.3%(-2.58)#11,081 |
| 70. | West Union | 8.8% | 15.2%(-6.37)#70 | 11.3%(-2.50)#11,181 |
| 71. | Follansbee | 9.0% | 15.2%(-6.25)#71 | 11.3%(-2.37)#11,341 |
| 72. | New Haven | 9.1% | 15.2%(-6.10)#72 | 11.3%(-2.23)#11,545 |
| 73. | Lumberport | 9.2% | 15.2%(-6.02)#73 | 11.3%(-2.15)#11,629 |
| 74. | Culloden | 9.3% | 15.2%(-5.94)#74 | 11.3%(-2.07)#11,743 |
| 75. | Davy | 9.3% | 15.2%(-5.91)#75 | 11.3%(-2.04)#11,777 |
| 76. | Bradshaw | 9.4% | 15.2%(-5.81)#76 | 11.3%(-1.94)#11,905 |
| 77. | North Hills | 9.5% | 15.2%(-5.75)#77 | 11.3%(-1.87)#11,992 |
| 78. | Weston | 9.5% | 15.2%(-5.70)#78 | 11.3%(-1.83)#12,059 |
| 79. | Farmington | 9.5% | 15.2%(-5.67)#79 | 11.3%(-1.79)#12,101 |
| 80. | Summersville | 9.6% | 15.2%(-5.64)#80 | 11.3%(-1.77)#12,129 |
| 81. | Arthurdale | 9.9% | 15.2%(-5.34)#81 | 11.3%(-1.47)#12,463 |
| 82. | Pea Ridge | 9.9% | 15.2%(-5.28)#82 | 11.3%(-1.41)#12,540 |
| 83. | Middlebourne | 10.1% | 15.2%(-5.10)#83 | 11.3%(-1.23)#12,747 |
| 84. | Hartford City | 10.1% | 15.2%(-5.09)#84 | 11.3%(-1.21)#12,782 |
| 85. | Springfield | 10.3% | 15.2%(-4.89)#85 | 11.3%(-1.02)#12,990 |
| 86. | Hurricane | 10.6% | 15.2%(-4.64)#86 | 11.3%(-0.763)#13,287 |
| 87. | St Albans | 10.6% | 15.2%(-4.57)#87 | 11.3%(-0.700)#13,347 |
| 88. | Elkins | 10.7% | 15.2%(-4.51)#88 | 11.3%(-0.638)#13,406 |
| 89. | Aurora | 10.7% | 15.2%(-4.50)#89 | 11.3%(-0.627)#13,424 |
| 90. | Nutter Fort | 10.7% | 15.2%(-4.48)#90 | 11.3%(-0.603)#13,452 |
| 91. | Sutton | 11.0% | 15.2%(-4.20)#91 | 11.3%(-0.322)#13,769 |
| 92. | Enterprise | 11.2% | 15.2%(-3.99)#92 | 11.3%(-0.114)#14,028 |
| 93. | Beaver | 11.2% | 15.2%(-3.98)#93 | 11.3%(-0.100)#14,039 |
| 94. | Bancroft | 11.3% | 15.2%(-3.87)#94 | 11.3%(+0.006)#14,149 |
| 95. | Waverly | 11.4% | 15.2%(-3.83)#95 | 11.3%(+0.041)#14,184 |
| 96. | Neibert | 11.5% | 15.2%(-3.68)#96 | 11.3%(+0.197)#14,370 |
| 97. | Barboursville | 11.5% | 15.2%(-3.68)#97 | 11.3%(+0.199)#14,387 |
| 98. | Justice | 11.6% | 15.2%(-3.57)#98 | 11.3%(+0.302)#14,490 |
| 99. | Nitro | 11.7% | 15.2%(-3.53)#99 | 11.3%(+0.348)#14,539 |
| 100. | Hamlin | 11.7% | 15.2%(-3.49)#100 | 11.3%(+0.389)#14,577 |
Common Questions
What are the Top 10 Cities with the Lowest Male Poverty Level in West Virginia?
Top 10 Cities with the Lowest Male Poverty Level in West Virginia are:
#1
0.29%
#2
1.5%
#3
1.8%
#4
1.8%
#5
2.1%
#6
2.2%
#7
2.3%
#8
2.3%
#9
2.4%
#10
2.4%
What city has the Lowest Male Poverty Level in West Virginia?
Pinch has the Lowest Male Poverty Level in West Virginia with 0.29%.
What is the Poverty Level Among Males in the State of West Virginia?
Poverty Level Among Males in West Virginia is 15.2%.
What is the Poverty Level Among Males in the United States?
Poverty Level Among Males in the United States is 11.3%.