Cities with the Lowest Male Poverty Level in Delaware
RELATED REPORTS & OPTIONS
Lowest Poverty | Male
Delaware
Compare Cities
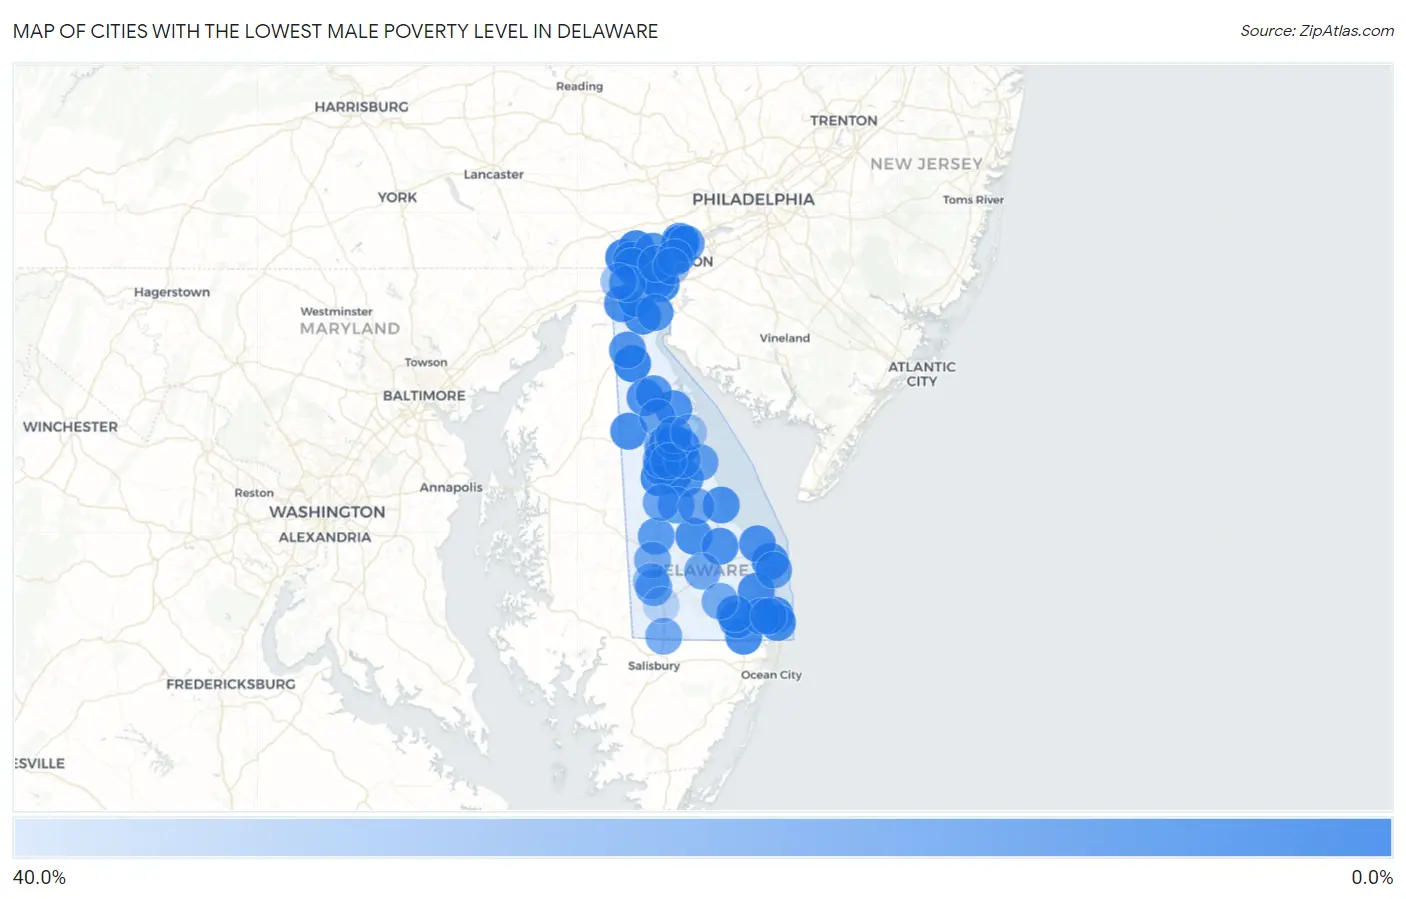
Map of Cities with the Lowest Male Poverty Level in Delaware
40.0%
0.0%
Cities with the Lowest Male Poverty Level in Delaware
| City | Male Poverty | vs State | vs National | |
| 1. | Riverview | 0.090% | 10.0%(-9.89)#1 | 11.3%(-11.3)#7 |
| 2. | Townsend | 0.84% | 10.0%(-9.13)#2 | 11.3%(-10.5)#366 |
| 3. | North Star | 1.3% | 10.0%(-8.67)#3 | 11.3%(-10.0)#765 |
| 4. | Lincoln | 1.8% | 10.0%(-8.16)#4 | 11.3%(-9.53)#1,269 |
| 5. | Hockessin | 1.8% | 10.0%(-8.15)#5 | 11.3%(-9.51)#1,291 |
| 6. | Pike Creek | 2.0% | 10.0%(-7.99)#6 | 11.3%(-9.35)#1,465 |
| 7. | Newport | 2.1% | 10.0%(-7.85)#7 | 11.3%(-9.21)#1,628 |
| 8. | Arden | 2.4% | 10.0%(-7.55)#8 | 11.3%(-8.91)#2,033 |
| 9. | Highland Acres | 2.5% | 10.0%(-7.50)#9 | 11.3%(-8.87)#2,089 |
| 10. | New Castle | 2.6% | 10.0%(-7.40)#10 | 11.3%(-8.76)#2,240 |
| 11. | Felton | 2.7% | 10.0%(-7.30)#11 | 11.3%(-8.67)#2,367 |
| 12. | Bellefonte | 2.8% | 10.0%(-7.15)#12 | 11.3%(-8.52)#2,545 |
| 13. | Dover Base Housing | 3.0% | 10.0%(-6.95)#13 | 11.3%(-8.31)#2,836 |
| 14. | Rehoboth Beach | 3.1% | 10.0%(-6.90)#14 | 11.3%(-8.26)#2,912 |
| 15. | Bethany Beach | 3.3% | 10.0%(-6.64)#15 | 11.3%(-8.01)#3,276 |
| 16. | Selbyville | 3.3% | 10.0%(-6.63)#16 | 11.3%(-8.00)#3,305 |
| 17. | St Georges | 3.8% | 10.0%(-6.14)#17 | 11.3%(-7.51)#4,017 |
| 18. | Long Neck | 4.1% | 10.0%(-5.92)#18 | 11.3%(-7.29)#4,368 |
| 19. | Hartly | 4.2% | 10.0%(-5.74)#19 | 11.3%(-7.10)#4,647 |
| 20. | Glasgow | 4.4% | 10.0%(-5.56)#20 | 11.3%(-6.92)#4,923 |
| 21. | South Bethany | 4.6% | 10.0%(-5.35)#21 | 11.3%(-6.72)#5,258 |
| 22. | Rising Sun Lebanon | 4.9% | 10.0%(-5.05)#22 | 11.3%(-6.42)#5,695 |
| 23. | Ellendale | 5.1% | 10.0%(-4.92)#23 | 11.3%(-6.29)#5,884 |
| 24. | Slaughter Beach | 5.1% | 10.0%(-4.84)#24 | 11.3%(-6.20)#6,010 |
| 25. | Frankford | 5.4% | 10.0%(-4.58)#25 | 11.3%(-5.95)#6,382 |
| 26. | Milton | 5.5% | 10.0%(-4.51)#26 | 11.3%(-5.88)#6,500 |
| 27. | Clayton | 5.6% | 10.0%(-4.36)#27 | 11.3%(-5.73)#6,733 |
| 28. | Leipsic | 5.6% | 10.0%(-4.36)#28 | 11.3%(-5.72)#6,738 |
| 29. | Lewes | 5.7% | 10.0%(-4.32)#29 | 11.3%(-5.69)#6,780 |
| 30. | Ardentown | 5.7% | 10.0%(-4.26)#30 | 11.3%(-5.63)#6,880 |
| 31. | Ardencroft | 5.7% | 10.0%(-4.23)#31 | 11.3%(-5.59)#6,942 |
| 32. | Greenville | 6.3% | 10.0%(-3.70)#32 | 11.3%(-5.07)#7,680 |
| 33. | Millville | 6.3% | 10.0%(-3.67)#33 | 11.3%(-5.03)#7,726 |
| 34. | Bear | 6.6% | 10.0%(-3.37)#34 | 11.3%(-4.74)#8,132 |
| 35. | Pike Creek Valley | 6.8% | 10.0%(-3.22)#35 | 11.3%(-4.58)#8,396 |
| 36. | Frederica | 6.9% | 10.0%(-3.04)#36 | 11.3%(-4.40)#8,662 |
| 37. | Middletown | 7.0% | 10.0%(-3.01)#37 | 11.3%(-4.38)#8,704 |
| 38. | Dagsboro | 7.2% | 10.0%(-2.80)#38 | 11.3%(-4.16)#9,010 |
| 39. | Camden | 7.7% | 10.0%(-2.24)#39 | 11.3%(-3.61)#9,785 |
| 40. | Smyrna | 8.2% | 10.0%(-1.76)#40 | 11.3%(-3.12)#10,424 |
| 41. | Wilmington Manor | 8.4% | 10.0%(-1.55)#41 | 11.3%(-2.91)#10,680 |
| 42. | Delaware City | 8.5% | 10.0%(-1.49)#42 | 11.3%(-2.85)#10,751 |
| 43. | Viola | 8.6% | 10.0%(-1.41)#43 | 11.3%(-2.77)#10,874 |
| 44. | Greenwood | 9.1% | 10.0%(-0.911)#44 | 11.3%(-2.28)#11,451 |
| 45. | Claymont | 10.6% | 10.0%(+0.613)#45 | 11.3%(-0.752)#13,305 |
| 46. | Bowers | 11.0% | 10.0%(+1.05)#46 | 11.3%(-0.312)#13,786 |
| 47. | Ocean View | 11.1% | 10.0%(+1.15)#47 | 11.3%(-0.211)#13,908 |
| 48. | Houston | 11.2% | 10.0%(+1.18)#48 | 11.3%(-0.181)#13,952 |
| 49. | Dewey Beach | 11.2% | 10.0%(+1.27)#49 | 11.3%(-0.099)#14,041 |
| 50. | Blades | 11.8% | 10.0%(+1.80)#50 | 11.3%(+0.436)#14,653 |
| 51. | Cheswold | 11.9% | 10.0%(+1.95)#51 | 11.3%(+0.585)#14,792 |
| 52. | Brookside | 12.0% | 10.0%(+2.03)#52 | 11.3%(+0.662)#14,893 |
| 53. | Harrington | 12.8% | 10.0%(+2.79)#53 | 11.3%(+1.43)#15,677 |
| 54. | Wyoming | 14.2% | 10.0%(+4.22)#54 | 11.3%(+2.85)#17,022 |
| 55. | Milford | 14.3% | 10.0%(+4.35)#55 | 11.3%(+2.98)#17,149 |
| 56. | Rodney Village | 14.7% | 10.0%(+4.71)#56 | 11.3%(+3.34)#17,454 |
| 57. | Delmar | 14.8% | 10.0%(+4.78)#57 | 11.3%(+3.41)#17,518 |
| 58. | Woodside | 15.0% | 10.0%(+5.02)#58 | 11.3%(+3.66)#17,715 |
| 59. | Georgetown | 15.0% | 10.0%(+5.04)#59 | 11.3%(+3.68)#17,733 |
| 60. | Bridgeville | 15.2% | 10.0%(+5.17)#60 | 11.3%(+3.81)#17,822 |
| 61. | Millsboro | 15.3% | 10.0%(+5.33)#61 | 11.3%(+3.96)#17,938 |
| 62. | Elsmere | 16.2% | 10.0%(+6.24)#62 | 11.3%(+4.87)#18,648 |
| 63. | Magnolia | 16.4% | 10.0%(+6.43)#63 | 11.3%(+5.06)#18,785 |
| 64. | Kent Acres | 16.4% | 10.0%(+6.46)#64 | 11.3%(+5.10)#18,806 |
| 65. | Dover | 16.8% | 10.0%(+6.85)#65 | 11.3%(+5.49)#19,089 |
| 66. | Seaford | 22.0% | 10.0%(+12.1)#66 | 11.3%(+10.7)#22,078 |
| 67. | Edgemoor | 22.9% | 10.0%(+12.9)#67 | 11.3%(+11.6)#22,495 |
| 68. | Wilmington | 23.3% | 10.0%(+13.3)#68 | 11.3%(+12.0)#22,638 |
| 69. | Newark | 23.5% | 10.0%(+13.5)#69 | 11.3%(+12.1)#22,721 |
| 70. | Woodside East | 23.7% | 10.0%(+13.8)#70 | 11.3%(+12.4)#22,812 |
| 71. | Little Creek | 27.3% | 10.0%(+17.4)#71 | 11.3%(+16.0)#24,004 |
| 72. | Laurel | 31.9% | 10.0%(+21.9)#72 | 11.3%(+20.6)#24,993 |
1
Common Questions
What are the Top 10 Cities with the Lowest Male Poverty Level in Delaware?
Top 10 Cities with the Lowest Male Poverty Level in Delaware are:
#1
0.0%
#2
0.0%
#3
0.0%
#4
0.0%
#5
0.090%
#6
0.84%
#7
1.3%
#8
1.8%
#9
2.0%
#10
2.1%
What city has the Lowest Male Poverty Level in Delaware?
Riverview has the Lowest Male Poverty Level in Delaware with 0.090%.
What is the Poverty Level Among Males in the State of Delaware?
Poverty Level Among Males in Delaware is 10.0%.
What is the Poverty Level Among Males in the United States?
Poverty Level Among Males in the United States is 11.3%.