Cities with the Lowest Male Poverty Level in Tennessee
RELATED REPORTS & OPTIONS
Lowest Poverty | Male
Tennessee
Compare Cities
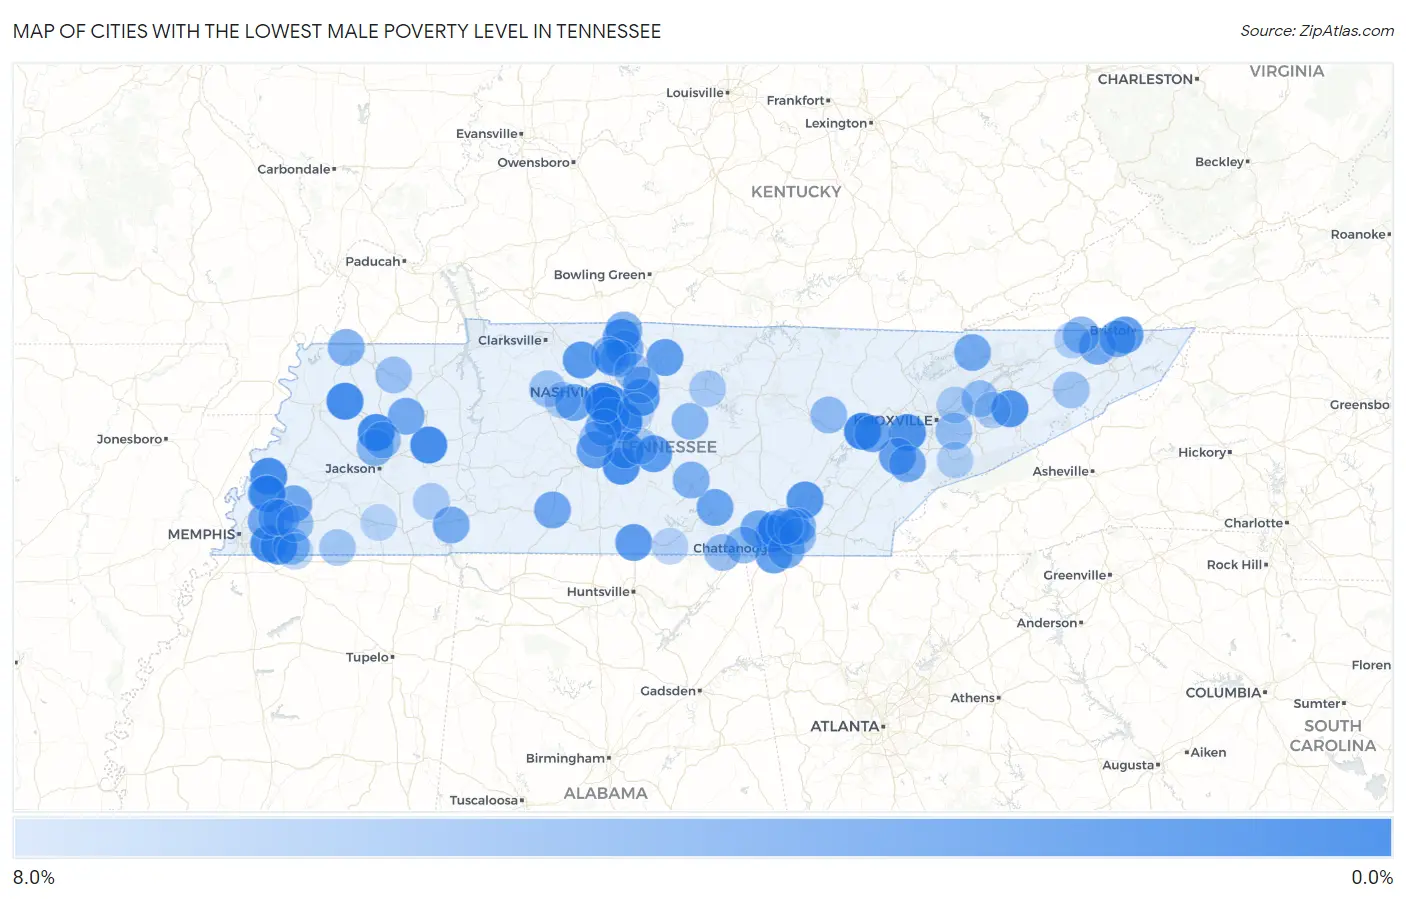
Map of Cities with the Lowest Male Poverty Level in Tennessee
8.0%
0.0%
Cities with the Lowest Male Poverty Level in Tennessee
| City | Male Poverty | vs State | vs National | |
| 1. | Oak Hill | 0.37% | 12.6%(-12.2)#1 | 11.3%(-11.0)#75 |
| 2. | Belle Meade | 0.42% | 12.6%(-12.2)#2 | 11.3%(-10.9)#102 |
| 3. | Strawberry Plains | 0.46% | 12.6%(-12.1)#3 | 11.3%(-10.9)#125 |
| 4. | Nolensville | 0.50% | 12.6%(-12.1)#4 | 11.3%(-10.8)#140 |
| 5. | Midtown | 0.85% | 12.6%(-11.7)#5 | 11.3%(-10.5)#375 |
| 6. | Gibson | 1.1% | 12.6%(-11.5)#6 | 11.3%(-10.3)#521 |
| 7. | Yorkville | 1.2% | 12.6%(-11.4)#7 | 11.3%(-10.2)#638 |
| 8. | Parker S Crossroads | 1.2% | 12.6%(-11.4)#8 | 11.3%(-10.1)#657 |
| 9. | Burlison | 1.3% | 12.6%(-11.3)#9 | 11.3%(-10.0)#761 |
| 10. | Germantown | 1.4% | 12.6%(-11.1)#10 | 11.3%(-9.90)#886 |
| 11. | Chapel Hill | 1.5% | 12.6%(-11.1)#11 | 11.3%(-9.86)#916 |
| 12. | Farragut | 1.6% | 12.6%(-11.0)#12 | 11.3%(-9.74)#1,026 |
| 13. | Signal Mountain | 1.7% | 12.6%(-10.9)#13 | 11.3%(-9.67)#1,109 |
| 14. | Brentwood | 1.8% | 12.6%(-10.8)#14 | 11.3%(-9.52)#1,280 |
| 15. | Baneberry | 1.8% | 12.6%(-10.7)#15 | 11.3%(-9.51)#1,296 |
| 16. | Collierville | 1.8% | 12.6%(-10.7)#16 | 11.3%(-9.50)#1,308 |
| 17. | Sale Creek | 2.1% | 12.6%(-10.5)#17 | 11.3%(-9.27)#1,570 |
| 18. | Rural Hill | 2.1% | 12.6%(-10.5)#18 | 11.3%(-9.25)#1,592 |
| 19. | Eagleville | 2.1% | 12.6%(-10.5)#19 | 11.3%(-9.23)#1,607 |
| 20. | Cross Plains | 2.2% | 12.6%(-10.4)#20 | 11.3%(-9.14)#1,739 |
| 21. | Pleasant View | 2.2% | 12.6%(-10.4)#21 | 11.3%(-9.12)#1,748 |
| 22. | Christiana | 2.3% | 12.6%(-10.3)#22 | 11.3%(-9.05)#1,852 |
| 23. | Walnut Hill | 2.5% | 12.6%(-10.1)#23 | 11.3%(-8.86)#2,095 |
| 24. | Park City | 2.5% | 12.6%(-10.0)#24 | 11.3%(-8.80)#2,191 |
| 25. | Castalian Springs | 2.7% | 12.6%(-9.91)#25 | 11.3%(-8.67)#2,355 |
| 26. | Lookout Mountain | 2.9% | 12.6%(-9.71)#26 | 11.3%(-8.48)#2,606 |
| 27. | Spring Hill | 2.9% | 12.6%(-9.70)#27 | 11.3%(-8.46)#2,628 |
| 28. | Munford | 2.9% | 12.6%(-9.66)#28 | 11.3%(-8.42)#2,674 |
| 29. | Tellico Village | 2.9% | 12.6%(-9.64)#29 | 11.3%(-8.40)#2,696 |
| 30. | Kingston Springs | 3.1% | 12.6%(-9.44)#30 | 11.3%(-8.20)#2,986 |
| 31. | Oak Grove Cdp Washington County | 3.2% | 12.6%(-9.39)#31 | 11.3%(-8.16)#3,042 |
| 32. | Pelham | 3.3% | 12.6%(-9.24)#32 | 11.3%(-8.01)#3,278 |
| 33. | Kingston | 3.4% | 12.6%(-9.17)#33 | 11.3%(-7.93)#3,391 |
| 34. | Franklin | 3.4% | 12.6%(-9.16)#34 | 11.3%(-7.93)#3,407 |
| 35. | Bartlett | 3.5% | 12.6%(-9.11)#35 | 11.3%(-7.87)#3,493 |
| 36. | Ethridge | 3.5% | 12.6%(-9.03)#36 | 11.3%(-7.79)#3,604 |
| 37. | Braden | 3.6% | 12.6%(-9.03)#37 | 11.3%(-7.79)#3,607 |
| 38. | Mclemoresville | 3.6% | 12.6%(-8.95)#38 | 11.3%(-7.72)#3,706 |
| 39. | Orebank | 3.6% | 12.6%(-8.94)#39 | 11.3%(-7.71)#3,715 |
| 40. | Powells Crossroads | 3.7% | 12.6%(-8.89)#40 | 11.3%(-7.65)#3,803 |
| 41. | Colonial Heights | 3.7% | 12.6%(-8.86)#41 | 11.3%(-7.62)#3,849 |
| 42. | New Tazewell | 3.7% | 12.6%(-8.84)#42 | 11.3%(-7.61)#3,872 |
| 43. | Mount Juliet | 3.8% | 12.6%(-8.79)#43 | 11.3%(-7.56)#3,942 |
| 44. | Fairmount | 3.8% | 12.6%(-8.78)#44 | 11.3%(-7.54)#3,961 |
| 45. | Greenback | 3.8% | 12.6%(-8.77)#45 | 11.3%(-7.54)#3,969 |
| 46. | White House | 3.8% | 12.6%(-8.73)#46 | 11.3%(-7.50)#4,025 |
| 47. | Ridgeside | 3.9% | 12.6%(-8.69)#47 | 11.3%(-7.45)#4,115 |
| 48. | Rarity Bay | 3.9% | 12.6%(-8.68)#48 | 11.3%(-7.45)#4,117 |
| 49. | Blountville | 4.0% | 12.6%(-8.60)#49 | 11.3%(-7.37)#4,241 |
| 50. | Olivet | 4.0% | 12.6%(-8.59)#50 | 11.3%(-7.35)#4,265 |
| 51. | Finley | 4.0% | 12.6%(-8.53)#51 | 11.3%(-7.29)#4,366 |
| 52. | Embreeville | 4.2% | 12.6%(-8.40)#52 | 11.3%(-7.16)#4,575 |
| 53. | Powell | 4.3% | 12.6%(-8.31)#53 | 11.3%(-7.08)#4,685 |
| 54. | Lakesite | 4.3% | 12.6%(-8.31)#54 | 11.3%(-7.07)#4,688 |
| 55. | New Union | 4.3% | 12.6%(-8.29)#55 | 11.3%(-7.05)#4,728 |
| 56. | Orlinda | 4.3% | 12.6%(-8.29)#56 | 11.3%(-7.05)#4,732 |
| 57. | Woodland Mills | 4.3% | 12.6%(-8.25)#57 | 11.3%(-7.01)#4,783 |
| 58. | Atoka | 4.5% | 12.6%(-8.05)#58 | 11.3%(-6.82)#5,071 |
| 59. | Millersville | 4.6% | 12.6%(-7.99)#59 | 11.3%(-6.75)#5,184 |
| 60. | Three Way | 4.6% | 12.6%(-7.93)#60 | 11.3%(-6.70)#5,280 |
| 61. | Mount Carmel | 4.7% | 12.6%(-7.88)#61 | 11.3%(-6.64)#5,356 |
| 62. | Greenbrier | 4.8% | 12.6%(-7.75)#62 | 11.3%(-6.51)#5,562 |
| 63. | Auburntown | 4.9% | 12.6%(-7.66)#63 | 11.3%(-6.42)#5,685 |
| 64. | Jasper | 5.0% | 12.6%(-7.60)#64 | 11.3%(-6.36)#5,758 |
| 65. | Medina | 5.0% | 12.6%(-7.59)#65 | 11.3%(-6.36)#5,768 |
| 66. | Ridgetop | 5.0% | 12.6%(-7.57)#66 | 11.3%(-6.33)#5,819 |
| 67. | Karns | 5.0% | 12.6%(-7.55)#67 | 11.3%(-6.32)#5,839 |
| 68. | Piperton | 5.1% | 12.6%(-7.52)#68 | 11.3%(-6.28)#5,887 |
| 69. | Middle Valley | 5.1% | 12.6%(-7.52)#69 | 11.3%(-6.28)#5,888 |
| 70. | Fairfield Glade | 5.1% | 12.6%(-7.47)#70 | 11.3%(-6.24)#5,954 |
| 71. | Harrison | 5.2% | 12.6%(-7.42)#71 | 11.3%(-6.19)#6,029 |
| 72. | New Market | 5.2% | 12.6%(-7.35)#72 | 11.3%(-6.12)#6,138 |
| 73. | Arlington | 5.3% | 12.6%(-7.32)#73 | 11.3%(-6.08)#6,180 |
| 74. | Orme | 5.3% | 12.6%(-7.31)#74 | 11.3%(-6.08)#6,199 |
| 75. | Lakeland | 5.3% | 12.6%(-7.29)#75 | 11.3%(-6.06)#6,223 |
| 76. | Oakland | 5.4% | 12.6%(-7.21)#76 | 11.3%(-5.98)#6,340 |
| 77. | Falling Water | 5.4% | 12.6%(-7.13)#77 | 11.3%(-5.90)#6,463 |
| 78. | Seymour | 5.5% | 12.6%(-7.10)#78 | 11.3%(-5.86)#6,513 |
| 79. | Dresden | 5.8% | 12.6%(-6.83)#79 | 11.3%(-5.59)#6,952 |
| 80. | Charlotte | 5.8% | 12.6%(-6.73)#80 | 11.3%(-5.49)#7,094 |
| 81. | Thompson S Station | 6.1% | 12.6%(-6.49)#81 | 11.3%(-5.26)#7,395 |
| 82. | Tusculum | 6.1% | 12.6%(-6.43)#82 | 11.3%(-5.20)#7,480 |
| 83. | Hendersonville | 6.2% | 12.6%(-6.37)#83 | 11.3%(-5.13)#7,577 |
| 84. | Blanche | 6.3% | 12.6%(-6.29)#84 | 11.3%(-5.05)#7,703 |
| 85. | Grand Junction | 6.3% | 12.6%(-6.27)#85 | 11.3%(-5.03)#7,730 |
| 86. | Gordonsville | 6.4% | 12.6%(-6.18)#86 | 11.3%(-4.95)#7,848 |
| 87. | Rockvale | 6.4% | 12.6%(-6.13)#87 | 11.3%(-4.90)#7,912 |
| 88. | Mascot | 6.5% | 12.6%(-6.05)#88 | 11.3%(-4.81)#8,025 |
| 89. | White Bluff | 6.7% | 12.6%(-5.89)#89 | 11.3%(-4.66)#8,263 |
| 90. | Milledgeville | 6.7% | 12.6%(-5.86)#90 | 11.3%(-4.63)#8,320 |
| 91. | Townsend | 6.9% | 12.6%(-5.71)#91 | 11.3%(-4.48)#8,557 |
| 92. | Church Hill | 6.9% | 12.6%(-5.65)#92 | 11.3%(-4.41)#8,648 |
| 93. | Dandridge | 7.1% | 12.6%(-5.44)#93 | 11.3%(-4.21)#8,925 |
| 94. | Chewalla | 7.1% | 12.6%(-5.43)#94 | 11.3%(-4.20)#8,961 |
| 95. | Huntland | 7.2% | 12.6%(-5.39)#95 | 11.3%(-4.15)#9,023 |
| 96. | Rossville | 7.2% | 12.6%(-5.33)#96 | 11.3%(-4.10)#9,102 |
| 97. | Hornsby | 7.3% | 12.6%(-5.29)#97 | 11.3%(-4.06)#9,171 |
| 98. | Forest Hills | 7.3% | 12.6%(-5.28)#98 | 11.3%(-4.05)#9,192 |
| 99. | Lynchburg | 7.3% | 12.6%(-5.24)#99 | 11.3%(-4.01)#9,232 |
| 100. | La Vergne | 7.4% | 12.6%(-5.20)#100 | 11.3%(-3.97)#9,299 |
Common Questions
What are the Top 10 Cities with the Lowest Male Poverty Level in Tennessee?
Top 10 Cities with the Lowest Male Poverty Level in Tennessee are:
#1
0.37%
#2
0.42%
#3
0.50%
#4
0.85%
#5
1.1%
#6
1.2%
#7
1.2%
#8
1.3%
#9
1.4%
#10
1.5%
What city has the Lowest Male Poverty Level in Tennessee?
Oak Hill has the Lowest Male Poverty Level in Tennessee with 0.37%.
What is the Poverty Level Among Males in the State of Tennessee?
Poverty Level Among Males in Tennessee is 12.6%.
What is the Poverty Level Among Males in the United States?
Poverty Level Among Males in the United States is 11.3%.