Cities with the Lowest Male Poverty Level in Pennsylvania
RELATED REPORTS & OPTIONS
Lowest Poverty | Male
Pennsylvania
Compare Cities
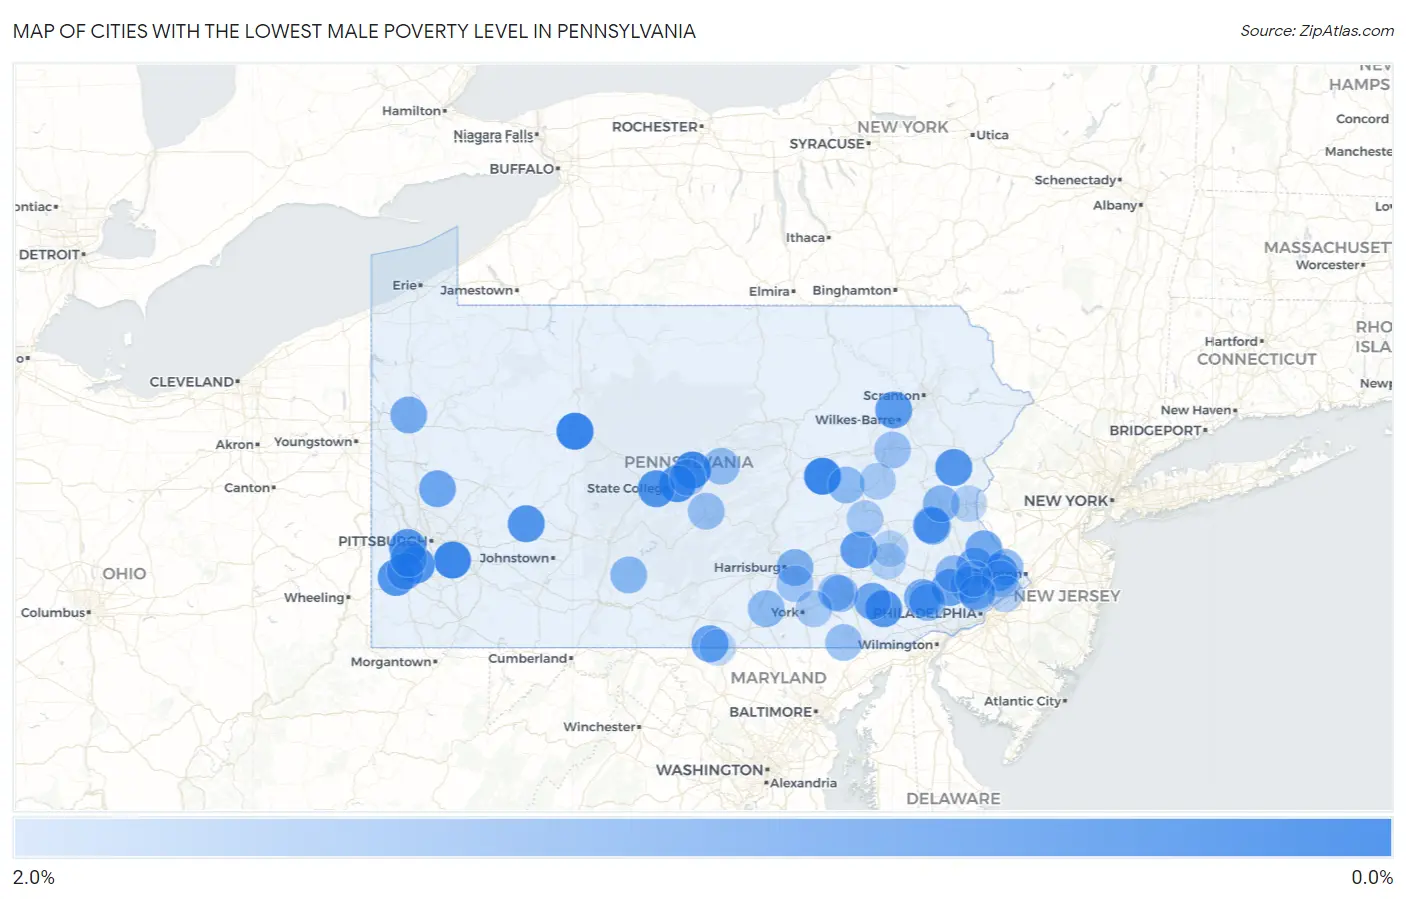
Map of Cities with the Lowest Male Poverty Level in Pennsylvania
2.0%
0.0%
Cities with the Lowest Male Poverty Level in Pennsylvania
| City | Male Poverty | vs State | vs National | |
| 1. | Treasure Lake | 0.072% | 10.6%(-10.6)#1 | 11.3%(-11.3)#4 |
| 2. | Elysburg | 0.095% | 10.6%(-10.5)#2 | 11.3%(-11.2)#8 |
| 3. | Greenock | 0.15% | 10.6%(-10.5)#3 | 11.3%(-11.2)#20 |
| 4. | Zion | 0.17% | 10.6%(-10.5)#4 | 11.3%(-11.2)#24 |
| 5. | Edgeworth Borough | 0.26% | 10.6%(-10.4)#5 | 11.3%(-11.1)#41 |
| 6. | Houserville | 0.27% | 10.6%(-10.4)#6 | 11.3%(-11.1)#43 |
| 7. | Newtown Borough | 0.32% | 10.6%(-10.3)#7 | 11.3%(-11.0)#55 |
| 8. | Callery Borough | 0.33% | 10.6%(-10.3)#8 | 11.3%(-11.0)#64 |
| 9. | Tatamy Borough | 0.34% | 10.6%(-10.3)#9 | 11.3%(-11.0)#68 |
| 10. | Thompsonville | 0.36% | 10.6%(-10.3)#10 | 11.3%(-11.0)#72 |
| 11. | Wolfdale | 0.37% | 10.6%(-10.3)#11 | 11.3%(-11.0)#77 |
| 12. | Stormstown | 0.38% | 10.6%(-10.2)#12 | 11.3%(-11.0)#78 |
| 13. | Silverdale Borough | 0.40% | 10.6%(-10.2)#13 | 11.3%(-10.9)#93 |
| 14. | Lucerne Mines | 0.41% | 10.6%(-10.2)#14 | 11.3%(-10.9)#98 |
| 15. | Noblestown | 0.44% | 10.6%(-10.2)#15 | 11.3%(-10.9)#117 |
| 16. | Gap | 0.44% | 10.6%(-10.2)#16 | 11.3%(-10.9)#118 |
| 17. | Brodheadsville | 0.45% | 10.6%(-10.2)#17 | 11.3%(-10.9)#123 |
| 18. | Trucksville | 0.51% | 10.6%(-10.1)#18 | 11.3%(-10.8)#150 |
| 19. | Yatesville Borough | 0.52% | 10.6%(-10.1)#19 | 11.3%(-10.8)#158 |
| 20. | Laceyville Borough | 0.53% | 10.6%(-10.1)#20 | 11.3%(-10.8)#167 |
| 21. | Stouchsburg | 0.56% | 10.6%(-10.1)#21 | 11.3%(-10.8)#177 |
| 22. | Snydertown Borough | 0.58% | 10.6%(-10.0)#22 | 11.3%(-10.8)#185 |
| 23. | Mcsherrystown Borough | 0.60% | 10.6%(-10.0)#23 | 11.3%(-10.7)#198 |
| 24. | Clarks Summit Borough | 0.62% | 10.6%(-10.0)#24 | 11.3%(-10.7)#209 |
| 25. | Audubon | 0.63% | 10.6%(-9.99)#25 | 11.3%(-10.7)#217 |
| 26. | Cherry Tree Borough | 0.65% | 10.6%(-9.98)#26 | 11.3%(-10.7)#232 |
| 27. | Richboro | 0.66% | 10.6%(-9.96)#27 | 11.3%(-10.7)#237 |
| 28. | Wayne Heights | 0.69% | 10.6%(-9.94)#28 | 11.3%(-10.7)#252 |
| 29. | Nixon | 0.72% | 10.6%(-9.90)#29 | 11.3%(-10.6)#274 |
| 30. | Carroll Valley Borough | 0.74% | 10.6%(-9.89)#30 | 11.3%(-10.6)#287 |
| 31. | Intercourse | 0.75% | 10.6%(-9.88)#31 | 11.3%(-10.6)#300 |
| 32. | Oakland Cdp Lawrence County | 0.77% | 10.6%(-9.86)#32 | 11.3%(-10.6)#313 |
| 33. | Mcgovern | 0.78% | 10.6%(-9.85)#33 | 11.3%(-10.6)#316 |
| 34. | Ancient Oaks | 0.83% | 10.6%(-9.80)#34 | 11.3%(-10.5)#356 |
| 35. | Eagleview | 0.83% | 10.6%(-9.80)#35 | 11.3%(-10.5)#358 |
| 36. | Brittany Farms The Highlands | 0.83% | 10.6%(-9.80)#36 | 11.3%(-10.5)#359 |
| 37. | Clarks Green Borough | 0.83% | 10.6%(-9.79)#37 | 11.3%(-10.5)#360 |
| 38. | Plumsteadville | 0.84% | 10.6%(-9.78)#38 | 11.3%(-10.5)#367 |
| 39. | Lake Latonka | 0.85% | 10.6%(-9.78)#39 | 11.3%(-10.5)#370 |
| 40. | Manor Borough | 0.85% | 10.6%(-9.78)#40 | 11.3%(-10.5)#372 |
| 41. | Cecil Bishop | 0.86% | 10.6%(-9.77)#41 | 11.3%(-10.5)#378 |
| 42. | Rutledge Borough | 0.87% | 10.6%(-9.76)#42 | 11.3%(-10.5)#389 |
| 43. | Glen Osborne Borough | 0.90% | 10.6%(-9.72)#43 | 11.3%(-10.4)#416 |
| 44. | Troutville Borough | 0.93% | 10.6%(-9.70)#44 | 11.3%(-10.4)#429 |
| 45. | Rosslyn Farms Borough | 0.93% | 10.6%(-9.70)#45 | 11.3%(-10.4)#434 |
| 46. | Blue Bell | 0.94% | 10.6%(-9.68)#46 | 11.3%(-10.4)#444 |
| 47. | Sewickley Hills Borough | 0.96% | 10.6%(-9.67)#47 | 11.3%(-10.4)#452 |
| 48. | Lawnton | 0.96% | 10.6%(-9.67)#48 | 11.3%(-10.4)#454 |
| 49. | Fox Chapel Borough | 0.97% | 10.6%(-9.66)#49 | 11.3%(-10.4)#461 |
| 50. | Yardley Borough | 0.97% | 10.6%(-9.66)#50 | 11.3%(-10.4)#462 |
| 51. | Flourtown | 0.98% | 10.6%(-9.64)#51 | 11.3%(-10.4)#475 |
| 52. | Glen Hope Borough | 1.0% | 10.6%(-9.63)#52 | 11.3%(-10.3)#489 |
| 53. | Trexlertown | 1.0% | 10.6%(-9.62)#53 | 11.3%(-10.3)#491 |
| 54. | Cementon | 1.1% | 10.6%(-9.57)#54 | 11.3%(-10.3)#524 |
| 55. | Seven Fields Borough | 1.1% | 10.6%(-9.57)#55 | 11.3%(-10.3)#526 |
| 56. | Lyons Borough | 1.1% | 10.6%(-9.57)#56 | 11.3%(-10.3)#527 |
| 57. | Stonerstown | 1.1% | 10.6%(-9.53)#57 | 11.3%(-10.2)#552 |
| 58. | Chester Heights Borough | 1.1% | 10.6%(-9.51)#58 | 11.3%(-10.2)#564 |
| 59. | Lake Meade | 1.1% | 10.6%(-9.51)#59 | 11.3%(-10.2)#567 |
| 60. | Newtown Grant | 1.1% | 10.6%(-9.50)#60 | 11.3%(-10.2)#571 |
| 61. | Aristes | 1.1% | 10.6%(-9.50)#61 | 11.3%(-10.2)#574 |
| 62. | Exton | 1.1% | 10.6%(-9.50)#62 | 11.3%(-10.2)#580 |
| 63. | Shirleysburg Borough | 1.1% | 10.6%(-9.48)#63 | 11.3%(-10.2)#603 |
| 64. | Landisville | 1.2% | 10.6%(-9.47)#64 | 11.3%(-10.2)#612 |
| 65. | Skippack | 1.2% | 10.6%(-9.46)#65 | 11.3%(-10.2)#618 |
| 66. | Rebersburg | 1.2% | 10.6%(-9.43)#66 | 11.3%(-10.1)#662 |
| 67. | Conyngham Borough | 1.2% | 10.6%(-9.42)#67 | 11.3%(-10.1)#674 |
| 68. | Yeagertown | 1.2% | 10.6%(-9.38)#68 | 11.3%(-10.1)#709 |
| 69. | Susquehanna Trails | 1.3% | 10.6%(-9.37)#69 | 11.3%(-10.1)#723 |
| 70. | Salunga | 1.3% | 10.6%(-9.33)#70 | 11.3%(-10.0)#739 |
| 71. | Beech Mountain Lakes | 1.3% | 10.6%(-9.33)#71 | 11.3%(-10.0)#740 |
| 72. | Churchville | 1.3% | 10.6%(-9.29)#72 | 11.3%(-10.0)#787 |
| 73. | Valley Green | 1.4% | 10.6%(-9.26)#73 | 11.3%(-9.97)#817 |
| 74. | Addison Borough | 1.4% | 10.6%(-9.26)#74 | 11.3%(-9.97)#821 |
| 75. | Pleasant Gap | 1.4% | 10.6%(-9.24)#75 | 11.3%(-9.95)#837 |
| 76. | Merion Station | 1.4% | 10.6%(-9.19)#76 | 11.3%(-9.91)#877 |
| 77. | Stonybrook | 1.4% | 10.6%(-9.19)#77 | 11.3%(-9.91)#880 |
| 78. | Manorville Borough | 1.4% | 10.6%(-9.19)#78 | 11.3%(-9.91)#881 |
| 79. | Loop | 1.4% | 10.6%(-9.18)#79 | 11.3%(-9.89)#893 |
| 80. | East Prospect Borough | 1.5% | 10.6%(-9.17)#80 | 11.3%(-9.89)#899 |
| 81. | Lake Wynonah | 1.5% | 10.6%(-9.17)#81 | 11.3%(-9.89)#900 |
| 82. | Parkside Borough | 1.5% | 10.6%(-9.17)#82 | 11.3%(-9.88)#903 |
| 83. | Dunlevy Borough | 1.5% | 10.6%(-9.15)#83 | 11.3%(-9.86)#915 |
| 84. | Delano | 1.5% | 10.6%(-9.14)#84 | 11.3%(-9.86)#919 |
| 85. | Bernville Borough | 1.5% | 10.6%(-9.13)#85 | 11.3%(-9.85)#931 |
| 86. | Eddington | 1.5% | 10.6%(-9.12)#86 | 11.3%(-9.84)#942 |
| 87. | Pughtown | 1.5% | 10.6%(-9.12)#87 | 11.3%(-9.83)#943 |
| 88. | Wyndmoor | 1.5% | 10.6%(-9.10)#88 | 11.3%(-9.82)#959 |
| 89. | Jacobus Borough | 1.5% | 10.6%(-9.10)#89 | 11.3%(-9.82)#961 |
| 90. | Honey Brook Borough | 1.5% | 10.6%(-9.09)#90 | 11.3%(-9.81)#970 |
| 91. | Spring House | 1.6% | 10.6%(-9.07)#91 | 11.3%(-9.79)#988 |
| 92. | Montrose Manor | 1.6% | 10.6%(-9.06)#92 | 11.3%(-9.78)#995 |
| 93. | Lionville | 1.6% | 10.6%(-9.04)#93 | 11.3%(-9.75)#1,017 |
| 94. | Big Beaver Borough | 1.6% | 10.6%(-9.04)#94 | 11.3%(-9.75)#1,019 |
| 95. | Palmer Heights | 1.6% | 10.6%(-9.03)#95 | 11.3%(-9.75)#1,021 |
| 96. | Riverview Park | 1.6% | 10.6%(-9.03)#96 | 11.3%(-9.75)#1,022 |
| 97. | Sankertown Borough | 1.6% | 10.6%(-9.00)#97 | 11.3%(-9.72)#1,042 |
| 98. | Blue Ridge Summit | 1.6% | 10.6%(-9.00)#98 | 11.3%(-9.71)#1,048 |
| 99. | North Irwin Borough | 1.6% | 10.6%(-8.98)#99 | 11.3%(-9.70)#1,069 |
| 100. | Georgetown Borough | 1.7% | 10.6%(-8.97)#100 | 11.3%(-9.69)#1,078 |
Common Questions
What are the Top 10 Cities with the Lowest Male Poverty Level in Pennsylvania?
Top 10 Cities with the Lowest Male Poverty Level in Pennsylvania are:
#1
0.072%
#2
0.095%
#3
0.15%
#4
0.17%
#5
0.27%
#6
0.36%
#7
0.37%
#8
0.38%
#9
0.41%
#10
0.44%
What city has the Lowest Male Poverty Level in Pennsylvania?
Treasure Lake has the Lowest Male Poverty Level in Pennsylvania with 0.072%.
What is the Poverty Level Among Males in the State of Pennsylvania?
Poverty Level Among Males in Pennsylvania is 10.6%.
What is the Poverty Level Among Males in the United States?
Poverty Level Among Males in the United States is 11.3%.