Cities with the Lowest Male Poverty Level in the United States
RELATED REPORTS & OPTIONS
Lowest Poverty | Male
United States
Compare Cities
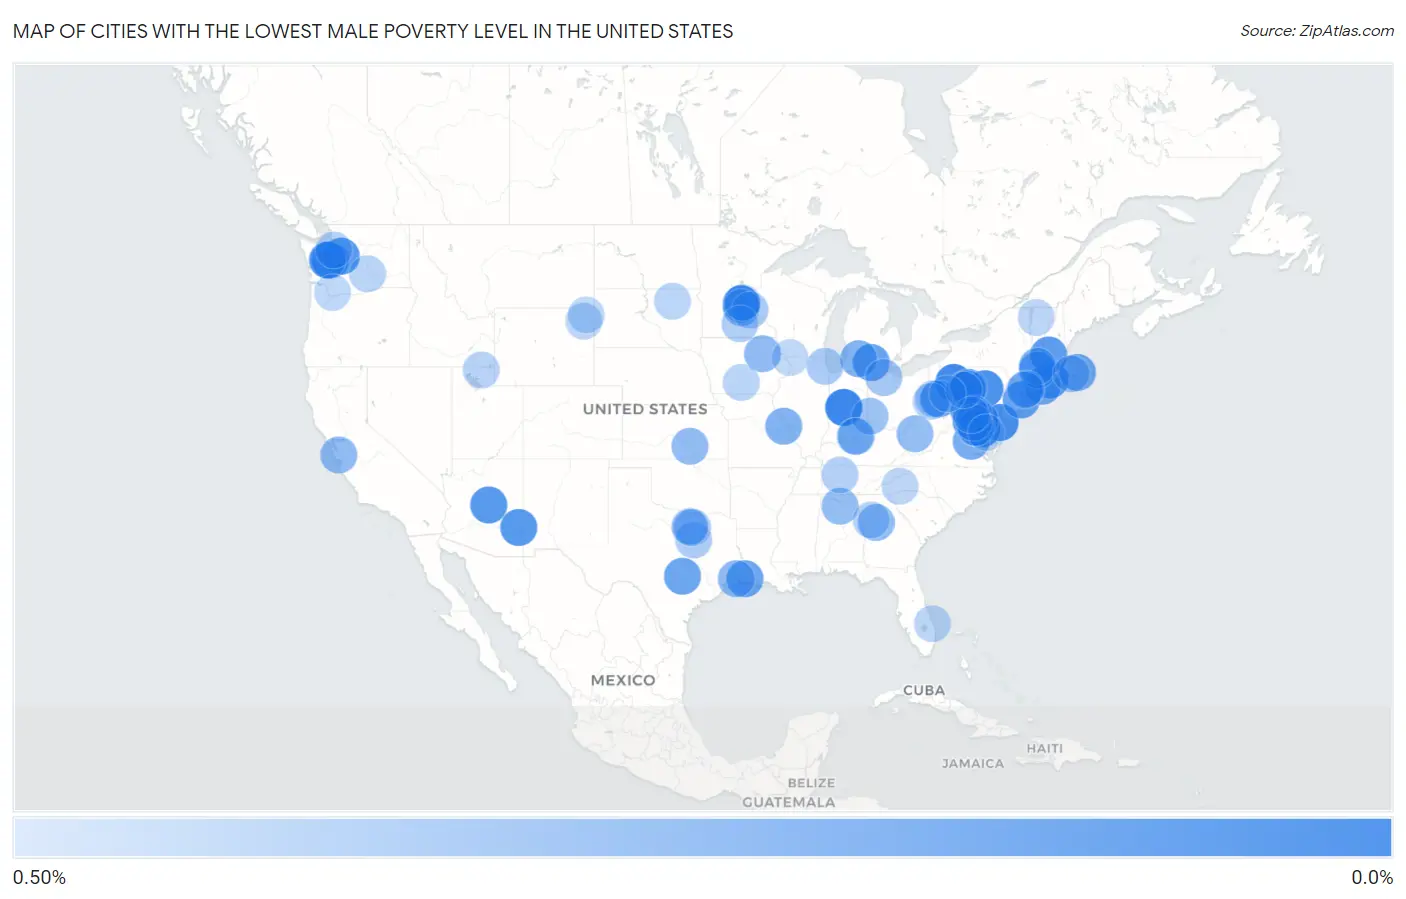
Map of Cities with the Lowest Male Poverty Level in the United States
0.50%
0.0%
Cities with the Lowest Male Poverty Level in the United States
| City | Male Poverty | vs State | vs National | |
| 1. | Pittsboro | 0.054% | 11.1%(-11.0)#1 | 11.3%(-11.3)#1 |
| 2. | Braddock | 0.061% | 8.9%(-8.81)#1 | 11.3%(-11.3)#2 |
| 3. | Hopelawn | 0.066% | 8.6%(-8.54)#1 | 11.3%(-11.3)#3 |
| 4. | Treasure Lake | 0.072% | 10.6%(-10.6)#1 | 11.3%(-11.3)#4 |
| 5. | Albertville | 0.075% | 8.4%(-8.32)#1 | 11.3%(-11.3)#5 |
| 6. | Belmont | 0.079% | 8.9%(-8.79)#2 | 11.3%(-11.3)#6 |
| 7. | Riverview | 0.090% | 10.0%(-9.89)#1 | 11.3%(-11.3)#7 |
| 8. | Elysburg | 0.095% | 10.6%(-10.5)#2 | 11.3%(-11.2)#8 |
| 9. | Baden | 0.10% | 8.2%(-8.12)#1 | 11.3%(-11.2)#9 |
| 10. | Fulton | 0.11% | 8.2%(-8.12)#2 | 11.3%(-11.2)#10 |
| 11. | Maplewood | 0.12% | 9.0%(-8.83)#1 | 11.3%(-11.2)#11 |
| 12. | Noank | 0.13% | 9.1%(-9.01)#1 | 11.3%(-11.2)#12 |
| 13. | Pine | 0.13% | 12.1%(-12.0)#1 | 11.3%(-11.2)#13 |
| 14. | Morenci | 0.13% | 12.1%(-12.0)#2 | 11.3%(-11.2)#14 |
| 15. | Snoqualmie | 0.13% | 9.0%(-8.82)#2 | 11.3%(-11.2)#15 |
| 16. | Vaughn | 0.14% | 9.0%(-8.81)#3 | 11.3%(-11.2)#16 |
| 17. | Ho Ho Kus Borough | 0.14% | 8.6%(-8.47)#2 | 11.3%(-11.2)#17 |
| 18. | Baldwinville | 0.15% | 9.0%(-8.88)#1 | 11.3%(-11.2)#18 |
| 19. | Steiner Ranch | 0.15% | 12.6%(-12.4)#1 | 11.3%(-11.2)#19 |
| 20. | Greenock | 0.15% | 10.6%(-10.5)#3 | 11.3%(-11.2)#20 |
| 21. | Bedminster | 0.15% | 8.6%(-8.45)#3 | 11.3%(-11.2)#21 |
| 22. | Oakhurst | 0.16% | 8.6%(-8.45)#4 | 11.3%(-11.2)#22 |
| 23. | Paramount Long Meadow | 0.16% | 8.2%(-8.07)#3 | 11.3%(-11.2)#23 |
| 24. | Zion | 0.17% | 10.6%(-10.5)#4 | 11.3%(-11.2)#24 |
| 25. | Clear Lake Cdp Pierce County | 0.17% | 9.0%(-8.78)#4 | 11.3%(-11.2)#25 |
| 26. | Spring Arbor | 0.17% | 12.0%(-11.8)#1 | 11.3%(-11.2)#26 |
| 27. | Manchaca | 0.19% | 12.6%(-12.4)#2 | 11.3%(-11.2)#27 |
| 28. | Hackberry | 0.19% | 16.8%(-16.6)#1 | 11.3%(-11.2)#28 |
| 29. | East Harwich | 0.19% | 9.0%(-8.83)#2 | 11.3%(-11.1)#29 |
| 30. | Sea Girt Borough | 0.19% | 8.6%(-8.42)#5 | 11.3%(-11.1)#30 |
| 31. | Weston | 0.21% | 9.1%(-8.93)#2 | 11.3%(-11.1)#31 |
| 32. | Mattituck | 0.22% | 12.4%(-12.2)#1 | 11.3%(-11.1)#32 |
| 33. | Lake Land Or | 0.22% | 8.9%(-8.66)#3 | 11.3%(-11.1)#33 |
| 34. | Weatogue | 0.22% | 9.1%(-8.92)#3 | 11.3%(-11.1)#34 |
| 35. | Hewitt | 0.22% | 8.6%(-8.38)#6 | 11.3%(-11.1)#35 |
| 36. | St Paul | 0.24% | 11.7%(-11.4)#1 | 11.3%(-11.1)#36 |
| 37. | Fripp Island | 0.24% | 13.0%(-12.8)#1 | 11.3%(-11.1)#37 |
| 38. | South Gull Lake | 0.24% | 12.0%(-11.7)#2 | 11.3%(-11.1)#38 |
| 39. | North Granby | 0.25% | 9.1%(-8.89)#4 | 11.3%(-11.1)#39 |
| 40. | Route 7 Gateway | 0.26% | 9.1%(-8.88)#5 | 11.3%(-11.1)#40 |
| 41. | Edgeworth Borough | 0.26% | 10.6%(-10.4)#5 | 11.3%(-11.1)#41 |
| 42. | Spring Valley | 0.26% | 14.5%(-14.2)#1 | 11.3%(-11.1)#42 |
| 43. | Houserville | 0.27% | 10.6%(-10.4)#6 | 11.3%(-11.1)#43 |
| 44. | Readlyn | 0.28% | 10.0%(-9.70)#1 | 11.3%(-11.1)#44 |
| 45. | Central Gardens | 0.28% | 12.6%(-12.3)#3 | 11.3%(-11.1)#45 |
| 46. | Monte Sereno | 0.28% | 11.1%(-10.8)#1 | 11.3%(-11.1)#46 |
| 47. | Heron Bay | 0.28% | 12.2%(-11.9)#1 | 11.3%(-11.1)#47 |
| 48. | Eastborough | 0.29% | 10.4%(-10.1)#1 | 11.3%(-11.1)#48 |
| 49. | Eva | 0.29% | 13.9%(-13.7)#1 | 11.3%(-11.1)#49 |
| 50. | South Run | 0.29% | 8.9%(-8.59)#4 | 11.3%(-11.1)#50 |
| 51. | Pinch | 0.29% | 15.2%(-14.9)#1 | 11.3%(-11.1)#51 |
| 52. | Independence | 0.31% | 8.4%(-8.09)#2 | 11.3%(-11.0)#52 |
| 53. | Hayfield | 0.31% | 8.9%(-8.56)#5 | 11.3%(-11.0)#53 |
| 54. | Millville | 0.31% | 12.0%(-11.7)#1 | 11.3%(-11.0)#54 |
| 55. | Newtown Borough | 0.32% | 10.6%(-10.3)#7 | 11.3%(-11.0)#55 |
| 56. | Walkersville | 0.32% | 8.2%(-7.91)#4 | 11.3%(-11.0)#56 |
| 57. | Baxter Estates | 0.32% | 12.4%(-12.1)#2 | 11.3%(-11.0)#57 |
| 58. | Lowes Island | 0.32% | 8.9%(-8.55)#6 | 11.3%(-11.0)#58 |
| 59. | Brown Station | 0.33% | 8.2%(-7.90)#5 | 11.3%(-11.0)#59 |
| 60. | Saddle Rock | 0.33% | 12.4%(-12.1)#3 | 11.3%(-11.0)#60 |
| 61. | Lantana | 0.33% | 12.6%(-12.2)#4 | 11.3%(-11.0)#61 |
| 62. | Haskins | 0.33% | 12.0%(-11.7)#2 | 11.3%(-11.0)#62 |
| 63. | Mashpee Neck | 0.33% | 9.0%(-8.69)#3 | 11.3%(-11.0)#63 |
| 64. | Callery Borough | 0.33% | 10.6%(-10.3)#8 | 11.3%(-11.0)#64 |
| 65. | Middletown | 0.33% | 8.2%(-7.90)#6 | 11.3%(-11.0)#65 |
| 66. | Mountain Lakes Borough | 0.34% | 8.6%(-8.27)#7 | 11.3%(-11.0)#66 |
| 67. | Greenville | 0.34% | 9.6%(-9.24)#1 | 11.3%(-11.0)#67 |
| 68. | Tatamy Borough | 0.34% | 10.6%(-10.3)#9 | 11.3%(-11.0)#68 |
| 69. | Golf | 0.34% | 10.6%(-10.2)#1 | 11.3%(-11.0)#69 |
| 70. | Sunfish Lake | 0.34% | 8.4%(-8.05)#3 | 11.3%(-11.0)#70 |
| 71. | Maypearl | 0.36% | 12.6%(-12.2)#5 | 11.3%(-11.0)#71 |
| 72. | Thompsonville | 0.36% | 10.6%(-10.3)#10 | 11.3%(-11.0)#72 |
| 73. | Packanack Lake | 0.36% | 8.6%(-8.25)#8 | 11.3%(-11.0)#73 |
| 74. | Madison Lake | 0.36% | 8.4%(-8.04)#4 | 11.3%(-11.0)#74 |
| 75. | Oak Hill | 0.37% | 12.6%(-12.2)#1 | 11.3%(-11.0)#75 |
| 76. | Woodway | 0.37% | 9.0%(-8.58)#5 | 11.3%(-11.0)#76 |
| 77. | Wolfdale | 0.37% | 10.6%(-10.3)#11 | 11.3%(-11.0)#77 |
| 78. | Stormstown | 0.38% | 10.6%(-10.2)#12 | 11.3%(-11.0)#78 |
| 79. | Tyrone | 0.38% | 12.2%(-11.8)#2 | 11.3%(-11.0)#79 |
| 80. | Great Notch | 0.38% | 8.6%(-8.23)#9 | 11.3%(-11.0)#80 |
| 81. | Newton | 0.38% | 7.7%(-7.33)#1 | 11.3%(-11.0)#81 |
| 82. | Dish | 0.38% | 12.6%(-12.2)#6 | 11.3%(-11.0)#82 |
| 83. | Warner | 0.38% | 11.0%(-10.6)#1 | 11.3%(-11.0)#83 |
| 84. | Desert Aire | 0.38% | 9.0%(-8.57)#6 | 11.3%(-11.0)#84 |
| 85. | New Virginia | 0.39% | 10.0%(-9.59)#2 | 11.3%(-11.0)#85 |
| 86. | Pine Haven | 0.39% | 9.4%(-9.04)#1 | 11.3%(-11.0)#86 |
| 87. | Jericho | 0.39% | 9.3%(-8.95)#1 | 11.3%(-11.0)#87 |
| 88. | Sewall S Point | 0.39% | 11.8%(-11.4)#1 | 11.3%(-10.9)#88 |
| 89. | Royal Pines | 0.39% | 12.0%(-11.6)#1 | 11.3%(-10.9)#89 |
| 90. | Hulett | 0.40% | 9.4%(-9.04)#2 | 11.3%(-10.9)#90 |
| 91. | Venersborg | 0.40% | 9.0%(-8.55)#7 | 11.3%(-10.9)#91 |
| 92. | Tioga Terrace | 0.40% | 12.4%(-12.0)#4 | 11.3%(-10.9)#92 |
| 93. | Silverdale Borough | 0.40% | 10.6%(-10.2)#13 | 11.3%(-10.9)#93 |
| 94. | Justin | 0.40% | 12.6%(-12.2)#7 | 11.3%(-10.9)#94 |
| 95. | Rolling Fields | 0.40% | 14.5%(-14.1)#2 | 11.3%(-10.9)#95 |
| 96. | Scales Mound | 0.41% | 10.6%(-10.2)#2 | 11.3%(-10.9)#96 |
| 97. | Island Heights Borough | 0.41% | 8.6%(-8.20)#10 | 11.3%(-10.9)#97 |
| 98. | Lucerne Mines | 0.41% | 10.6%(-10.2)#14 | 11.3%(-10.9)#98 |
| 99. | Long Beach | 0.41% | 8.2%(-7.82)#7 | 11.3%(-10.9)#99 |
| 100. | Otsego | 0.42% | 8.4%(-7.98)#5 | 11.3%(-10.9)#100 |
Common Questions
What are the Top 10 Cities with the Lowest Male Poverty Level in the United States?
Top 10 Cities with the Lowest Male Poverty Level in the United States are:
What city has the Lowest Male Poverty Level in the United States?
Pittsboro has the Lowest Male Poverty Level in the United States with 0.054%.
What is the Poverty Level Among Males in the United States?
Poverty Level Among Males in the United States is 11.3%.